Markets 2026
• For financial markets, the muddle through for global economics and policy provides support for risk assets, combined with solid earnings prospects from some of the magnificent 7. However, U.S. equities are once again significantly overvalued and we look for a 5-10% correction in 2026, before a recovery to end-2026 around 7,300 for the S&P500.
• The risk of some AI disappointment is greater in 2027, while rates will have bottomed and the U.S. Treasury market will be debating the risk of Fed tightening into 2028. DM equity markets ex Japan will find it difficult to outperform, though we think Brazil and India can beat the U.S. in 2026 and 2027.
• JGB yield risk a yield spike due to very heavy BOJ QT, which can spillover to other government bond markets. The BOJ will likely do a partial U turn and switch from lower to higher bond purchases. Meanwhile, we favor 2026 bullish yield curve steepening in U.S./EZ and UK government bond markets, as further rate cuts help short-end yields to move lower. 2027 will then likely see yield curve flattening, as markets wonder whether the next move is to higher rates. Elsewhere, further USD declines are forecast against DM currencies in 2026 and 2027, though at a slower pace than 2025. We see most scope for JPY/AUD and NOK gains. In EM FX, we like the BRL given the still large interest rate differentials. MXN in contrast will face pressure from the Trump Administration including to renegotiate USMCA.
• In commodities, the U.S. action in Venezuela (here) does not change our view of a modest decline in oil prices, as it will take many years for oil production to rise substantively to impact the global market. We look for WTI at USD53 for end 2026.
Our 2026 market views are shaped by the economic/policy and political developments into 2027 as well as 2026, which was published in our December Outlook (here).
Figure 1: Policy Rates Projections Major DM’s (%)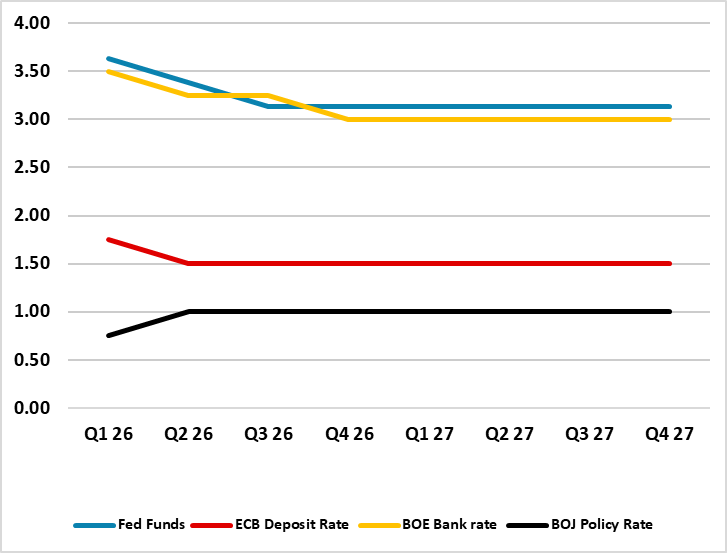 Source: Continuum Economics
Financial markets in 2026 depends on tariffs, economy, policy and geopolitics.
Macro muddlethrough/Easing for Most
The U.S. slowdown remains in focus as the lagged effects of President Trump’s tariff increases continues to feedthrough, though our baseline is for a 2026 soft-landing (see U.S. Outlook here). Even so, the U.S. consumer needs to be watched closely, as low to middle income households struggle with ongoing cost of living problems since COVID and consumption is too dependent on high income households (here). The U.S. Supreme court will likely rule against part or all of Trump’s reciprocal tariffs, which will create short-term uncertainty. However, Trump will likely increase other tariffs, but also codify tariffs in the trade framework deals that have been struck in 2025. Some H1 2026 softness of the U.S. economy remains our baseline and a temporary increase in inflation. The Fed will likely pause in early 2026, but then resume down to a 3.00-3.25% Fed Funds rate (here) as monthly inflation readings come under control. While Trump appointees will increase at the Fed, they are unlikely to dominate voting or actual policy rate levels now that district Fed presidents have been reappointed until 2031, but could led to internal Fed disagreements and communication problems (here). The Democrats are also likely to regain the House and this will mean fiscal deadlock until at least 2029. Finally, the AI economic boom will continue to drive business investment in semiconductors/data centers and enterprise AI, as commitments are strong through until 2028.
Meanwhile, tariffs outside the U.S. are disinflationary, as they hurt exports and employment. Additionally, China is seeking to redirect excess production at competitive prices. Other DM economies recoveries are also being restrained by population aging, slow productivity and cautious consumers in certain countries. This points to further easing from the ECB and BOE (Figure 1), though fiscal policy is mixed with UK tightening but Germany easing (see our EZ (here) and Western Europe Outlooks (here)). Meanwhile, we think further BOJ rate normalization will only be a further 25bps (Japan Outlook here), as inflation slows. A sharp spike in JGB yields (QT at 6% of GDP in 2026) could see the BOJ also doing a partial U turn on the pace of QT. While speculation exists that the RBA could also tighten, our baseline is for no change from the RBA.
Figure 2: EM Policy Rates Projections (%) 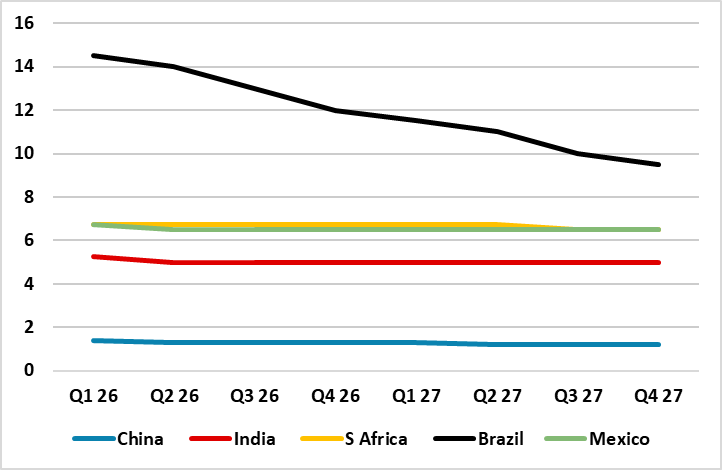 Source: Continuum Economics
The economic and policy muddlethrough will also be evident in EM economies. For China, economic momentum is slowing into 2026 due to a modest consumer, plus continued drag from residential investment and slowing exports pointing to a trend slowdown to 4% (China Outlook here). However, further fiscal stimulus is highly likely and suggests 2026 GDP growth of 4.4%. However, India should prove resilient, due to domestic stimulation (Asia Outlook here). Brazil growth will likely slow as the lagged effects of very tight monetary policy feeds through, but we foresee BCB will start easing by spring 2026 with more cuts in 2027. The key October 2026 Brazil presidential election is currently too close to call, but is likely to be a local rather than global issue.
Geopolitical and risk scenarios
The U.S. action in Venezuela reinforces the pivot to the Americas seen in December’s national security strategy (here), which will be followed by the 2026 Pentagon’s national defense strategy moving troops from Europe to the Americas. This could lead to political instability/unrest in Cuba; interference in the May 2026 Columbia presidential race and Mexican military action against the cartels (this would be a face saving option for Trump and Sheinbaum). Whether Trump is serious on annexing Greenland or would be happy with another military base/U.S. companies exploring for rare earth minerals and removing China and Russia from the Greenland sphere of influence is an open question. However, Trump is reluctant to have U.S. troops on foreign soil for any length of time and this argues against invasions like Panama (1989) or Grenada (1983).
Geopolitically, we still do not see China invading or blockading Taiwan in 2026 or 2027, as this is an ultra-high risk strategy with the U.S. maintaining its strategic ambiguity. Our baseline remains for ongoing grey warfare, with a 20% probability of a temporary China coastguard partial quarantine operations in 2027 (here). Re Ukraine, our baseline (70%) remains for a Russia friendly peace deal in Q4 2026/Q1 2027, with both sides have major redlines in the current round of peace negotiations (here) – the alternative is for the war to continue (30%) into 2027. Removal of sanctions will be slow, while Europe will likely be reluctant to become addicted to cheap Russian gas again.
Re risk scenarios the greatest concern is a U.S. recession, as the lagged effects of Trump’s tariffs could turn out to be more than expected and as absolute consumption is hit by the immigration crackdown. We attach a 20% probability to this scenario in 2026. A mild U.S. recession would likely hurt the global economy via a stock market selloff, but also via the business confidence channel. Such a scenario would extend and deepen DM and EM easing cycles. In financial markets, it would like cause around a 15-20% decline in U.S. equities, which would initially drag global equities down. It would also accelerate USD losses. In terms of DM and EM financial stability our review highlights the most serious issue remains the 2nd tier bank problems in China (here).
Market Views
This all feeds into our 2026 asset views, alongside current valuations to produce our 2026 asset allocation views (Figure 3). Starting with government bonds the trend in the U.S./EZ and UK will remain towards yield curve steepening. However, once the Fed Funds rate gets closer to 3.0-3.25% and the slowdown turns into a soft landing, the market will likely worry that the U.S. policy rate is close to bottom and the eventual risk of higher policy rates need to factored into 2yr yields. While we see inflation coming down in H2 2026, it is unlikely to hit the Fed’s target. We see around a positive 20-30bps 2yr-Fed Funds spread by end 2026, which is more controlled than the experience at the end of Fed easing cycle in the 1990’s. A similar process of thinking will likely occur in the EZ and UK front-ends (DM Rate Outlook here) into 2027.
Figure 3: Asset Allocation for 12 Months to end 2026
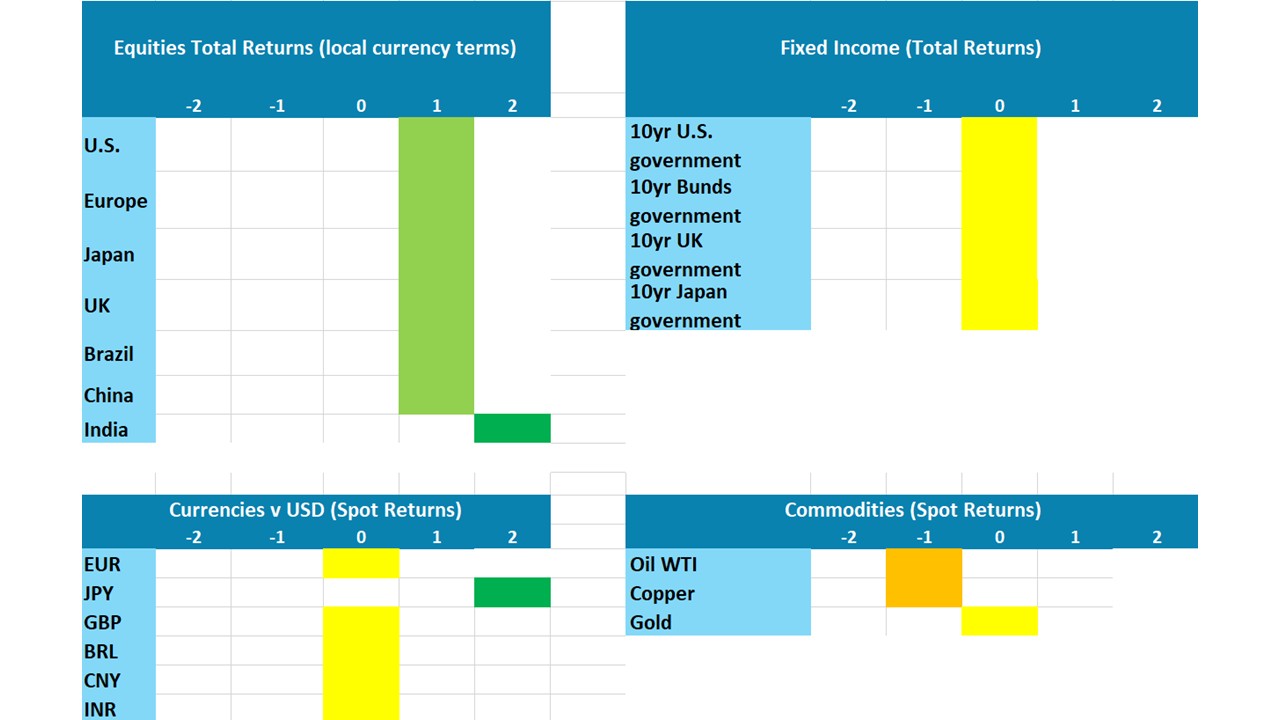
Source: Continuum Economics Note: Asset views in absolute total returns from levels on January 6 2026 (e.g., 0 = -5 to +5%, +1 = 5-10%, +2 = 10% plus).
For 10yr yields, in the U.S./EZ and UK yield curve steepening is projected to continue in 2026, both as yield curves tend to steepen in rate cut cycles and the market can factor in more easing than is currently discounted. The current yield curve is also not steep by 1990’s standards and we can see choppy 10yr yields edging back above 4.25% into H2 2026 (Figure 4) and 10-2yr yield curve steepening to 90-100bps. Given the size of funding requirement; long-term government debt trajectory and political reluctance to undertake fiscal consolidation, 2% 10yr real yields also feel right and fair value. For now we pencil in a budget deficit of 6.0% of GDP for 2026, with the risk of 0.5% extra if the Supreme Court rules against all reciprocal tariffs. Though the Supreme Court could rule against reciprocal tariffs (here), it is likely that the Trump administration would eventually find a partial substitute of extra tariffs while framework deals have also already been agreed with a lot of major countries. In the EZ, 10yr real Bund yields look slightly low and can rise, given ongoing ECB QT and extra German supply. Even so, 10yr Bund yields could be capped in Q4 2026 by concerns that the May 2027 French presidential election will not prompt a move towards fiscal consolidation. This could see more French fiscal pressures in 2027 and worst case a crisis, which could paralyse the ECB! For more see DM Rates Outlook here.
Figure 4: 10yr Government Bond Yield Forecasts (%) 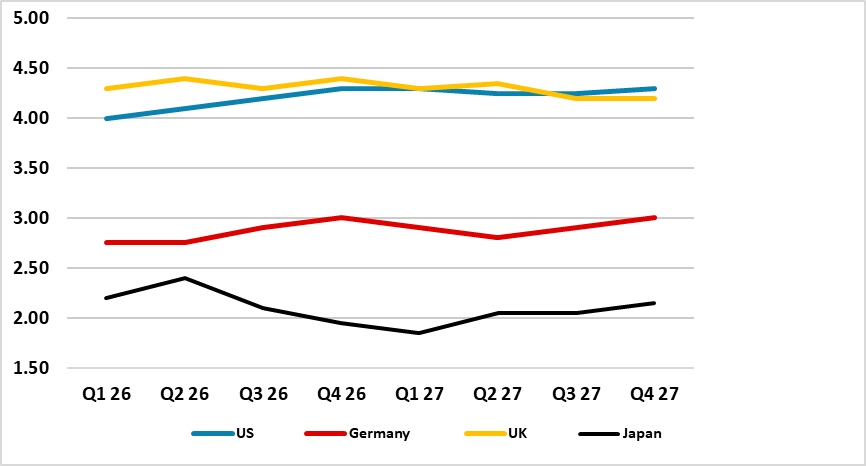 Source: Continuum Economics
10yr JGB yields however are projected to move higher due to the huge BOJ QT (Figure 5). The supply picture is so bad that a large spike in 10yr JGB yields will likely be seen to 2.5%, but this would likely prompt slower BOJ QT (via a U turn to increase monthly bond buying) rather than a return to QE. We do see one further BOJ policy rate hike to 1.0%, but then a slowdown in CPI and government pressure will likely produce a hold throughout 2027.
Figure 5: 2026 Budget Deficit and QT to GDP (%)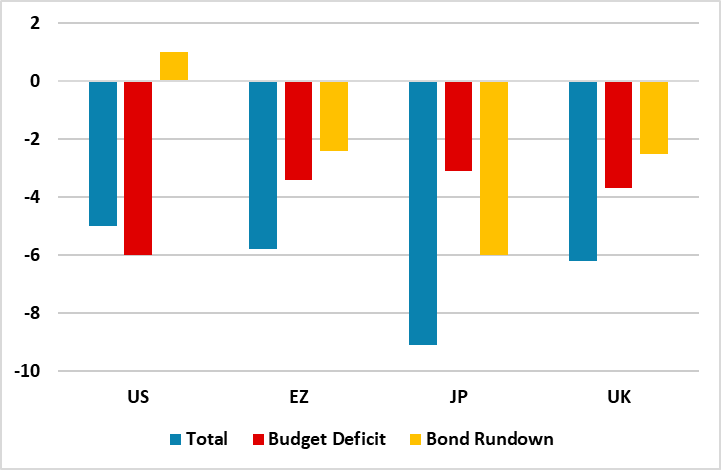 Source: IMF/Continuum Economics
The JGB yield spike could be so bad that it spills over to other DM government bond markets. 30yr yield spreads versus JGB’s have narrowed (Figure 6), as 30yr JGB yields have spiralled up to 3.48%. Though other government bond market have different demand/supply balances, 30yr has been a problem in the U.S./EZ and UK in 2025 that has prompted debt agencies to reduce issuance with lower structural demand beyond 10yrs. A JGB yield curve spike could thus prompt an unsettled period in 30yrs in other DM markets and potentially 10yr on a temporary basis.
The overall key risk to our government bond views however is a U.S. recession. Though we only attach a 20% probability to such a scenario in the next 12 months, if the U.S. economy sees a harder landing towards mild recession, disinflation could mean a quicker return to the 2% core PCE target in 2026 and a still weaker labor market. Fed easing would likely be quicker and potentially to 2.0-2.5% Fed Funds rate. 2yr yields decline would likely fall quickly in 2025 and drag 10yr U.S. Treasury to 3.5% (see DM Rates Outlook here).
Figure 6: 30yr Government Bond Yields At Risk (%) 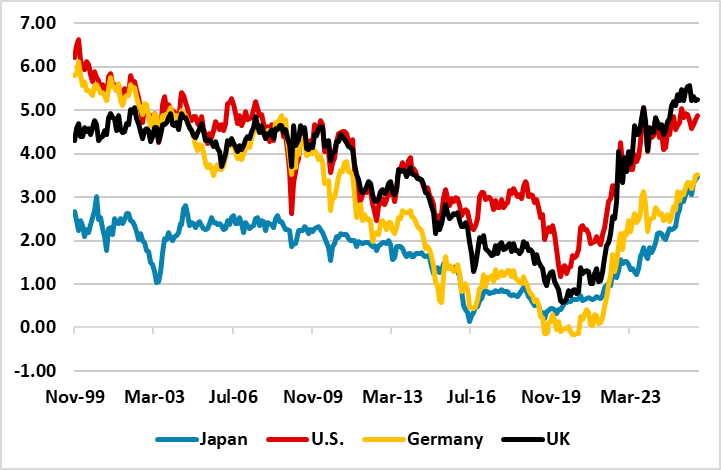 Source: Continuum Economics
AI Market Optimism and Winners/Losers
Figure 7: AI Financing 2025-28 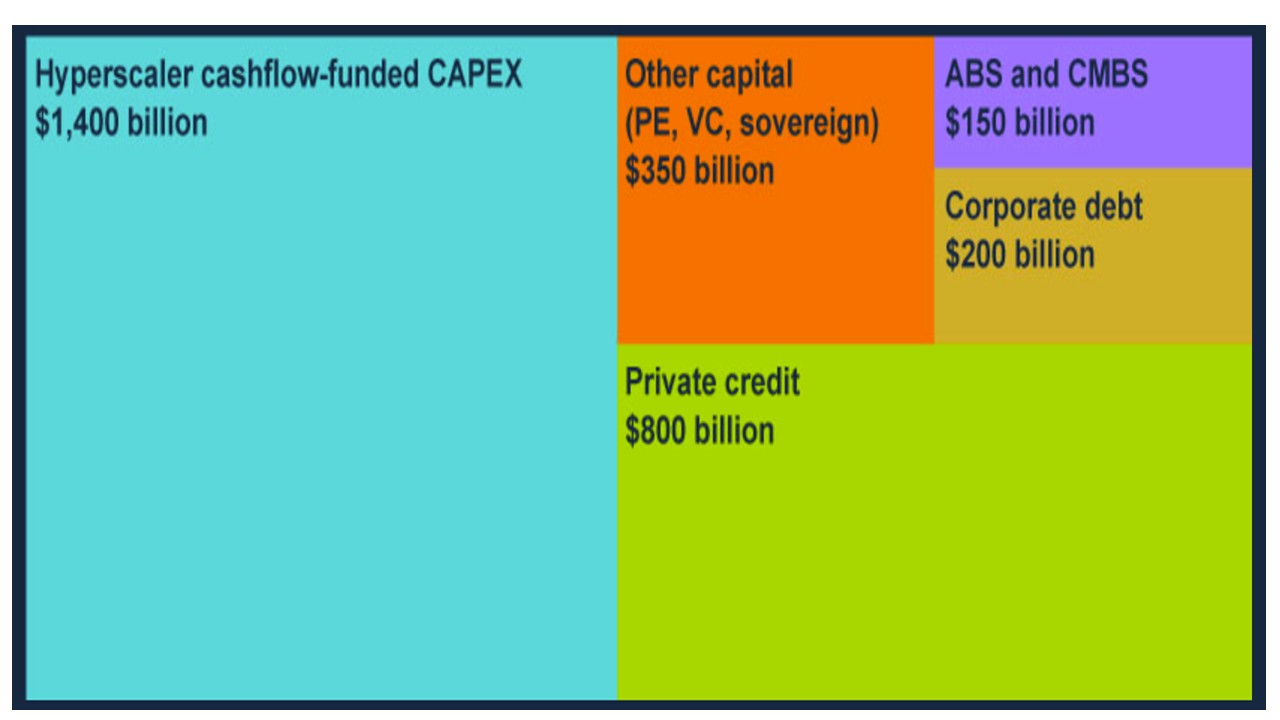 Source: Morgan Stanley/BOE (here)
While macro will provide some direction to the U.S. and global equity markets in 2026, a key question is also over AI optimism in the equity market. AI will provide a boost to U.S./Asia and China economies and also to AI enabler companies, as heavy investment in semiconductors/data centers/enterprise AI is largely funded out of cash flow for Alphabet/Amazon and Microsoft. The quarterly reporting season will be close watched, but provided that earnings growth remains strong it will not upset the AI optimism in the economy or markets. A 2nd tier issue is whether AI adversely impacts existing tech revenue. Some industry analysts question whether AI search will change the nature of search and lead to less traditional tech ad revenue, which could hurt corporate earnings optimism for Alphabet and Meta.
However, the main issue is for Open AI/Anthropic/xAI as well as Oracle and Meta and their cashflow and increasing reliance on external finance (Figure 7). If AI application revenues continue the exponential growth seen in 2025 (Open AI/Anthropic), then this external finance is unlikely to be heavily disturbed despite the Q4 increase in corporate bond/private credit financing costs. Open AI and Anthropic price to revenue at 25 and 60 in 2025 would come down and build momentum towards IPOs in the next 12-24 months. If AI application revenue growth disappoints then uncertainty will grow about 2027 onwards semiconductor chip and data center commitments, but more importantly financing for lose making pure AI plays.
Tesla also needs to be watched as the current sky high P/E ratio reflects hope that Tesla shareholders will get a cheap deal for Space X IPO expected in 2026 at around USD1.5trn (100 times 2025 revenue!) and optimism about Tesla robotics/self-driving cars. However, practical rollout of AI guided humanoid robots in most areas is unlikely to be rapid. Humanoid robots are currently USD150-250k according to McKinsey, while also require spending for maintenance and battery life is currently problematic (here). Additionally, the range of hand movement also does not match human capability, which restrict the ability to replace blue collar workers e.g. plumbers. Meanwhile, Autonomous vehicles usage can ramp up further and replace some blue collar drivers, though adoption has been modest in the U.S. rather than rapid. In China, autonomous vehicles are also being rolled out, but profit margins are being squeezed by high running costs. Tesla could thus be overdone optimism and could face a significant shakeout that spillovers to impact sentiment in the U.S. equity market. 2026 will be about AI winners and losers.
Our U.S. equity market baseline for 2026 is for a rally on good earnings, with a correction followed by a recovery that leaves the market up modestly from end 2025 levels. The 2022 and 2001-2 P/E derating were caused by major catalysts in the shape of aggressive Fed tightening and a recession respectively. No large adverse catalyst is in our baseline U.S. economic and policy view for 2026. However, we see 10yr U.S. Treasury yields remaining close to current levels (see above) throughout 2026, which leaves a strain on equity-bond relatives. Any moderate adverse news could be enough to prompt a 5-10% correction in U.S. equites. Overall, we look for 7300 on the S&P500 for end 2026. For more see our Equities Outlook (here).
In terms of 2027, we feel that the risk of a disappointment on future tech profits from some big tech companies could be greater than 2026 (here), while the economic cycle will be more mature. Super high valuations have also lasted 12-18 months, which leaves U.S. equities structurally vulnerable by 2027. This risks a deeper correction in the overvalued U.S. equity market. We then see a recovery to 6850 by end 2027. For EZ equities, a clear new catalyst is needed for significant outperformance versus the U.S. and a further 50bps ECB cut is unlikely to be enough. UK equities will remain restrained by fiscal consolidation and volatile UK politics, though supported by more BOE easing than the market is discounting. Finally, Japanese equities are too optimistic on new reflation policy, but corporate reform and higher return on equity can drive modest outperformance versus the U.S. in 2026 and 2027.
In EM equities, 2026 can see a China 2.5-5% outperformance versus the U.S., but driven by tech. Non tech is slightly overvalued and facing the cyclical challenge of modest consumption and the ongoing residential property bust, alongside a profit margin squeeze from the excess of production over domestic demand. India can only outperform modestly in 2026, as good corporate earnings growth will partially go into a further de-rating of the P/E multiple. Finally, Brazil equities will likely pause in H1 2026, as BCB will be slow to ease and concerns grow over a tight October 2026 presidential election. 2027 will be a better year.
Figure 8: USD/JPY and 10 year yield spread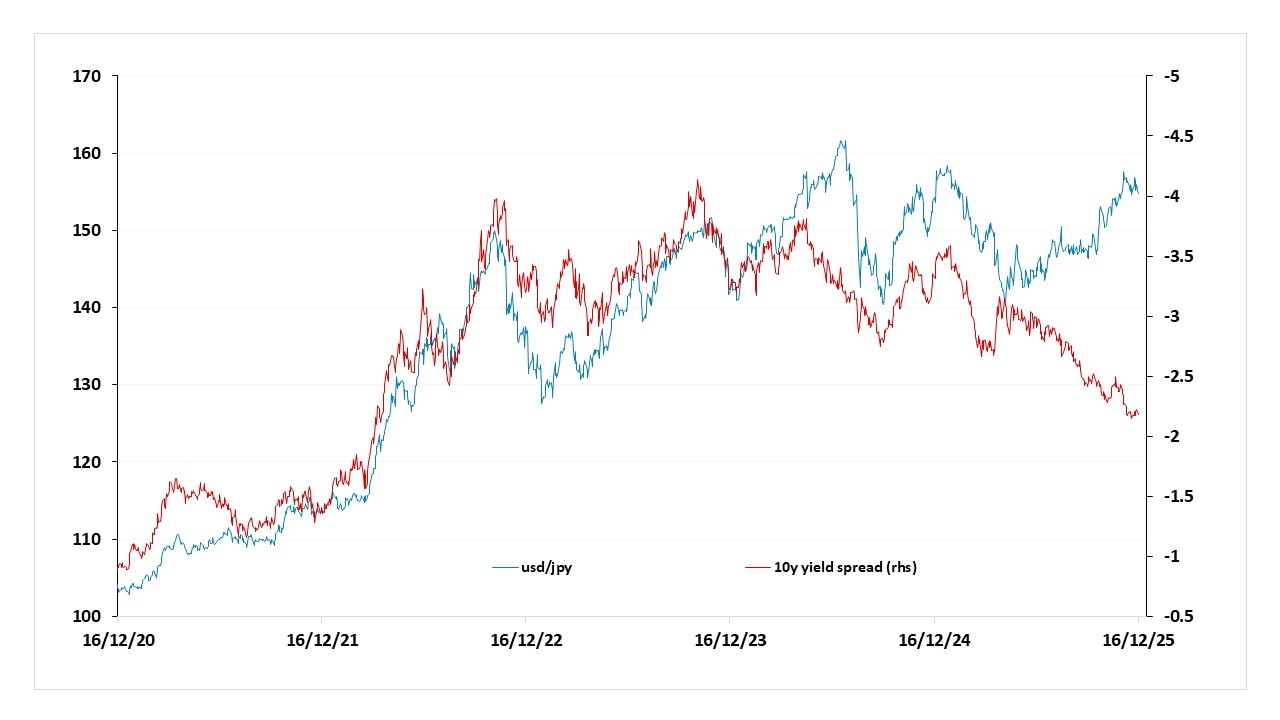 Source: Datastream, CE
We expect some modest USD losses across the board over the next couple of years, but there is much more scope for losses against the JPY, AUD and NOK than the other G10 currencies, as yield spreads have moved dramatically in favor of these currencies (Figure 6), and the currencies have hugely underperformed. Which performs best in any period will likely depend on risk sentiment, but over the longer run all ought to make gains across the board. We forecast 140 on USD/JPY for end 2026, 0.72 on AUD/USD and 11.00 on EUR/NOK (DM FX Outlook here). Our Commodity Outlook is here and events in Venezuela this weekend (here) do not change our view of USD53 for WTI by end 2026, as it will take years to raise oil production substantively.
EM currency 2026 prospects come against a backdrop of a further but slower USD depreciation against DM currencies, but inflation differentials, domestic central bank policy and politics also matter. We forecast the Mexican Peso (MXN) will likely be more volatile, as President Donald Trump wants to renegotiate USMCA. This will drag on throughout 2026 and a deal may only be reached in 2027 (here). In contrast the Brazilian Real (BRL) has already seen a correction and has scope to 5.20 v USD after the October 2026 presidential election. In Asia, the Chinese Yuan (CNY) will gain some marginal ground versus the USD, but will likely be strongly restrained by China’s authorities desire to maintain competitiveness. The Indonesian Rupiah (IDR) is undervalued and has scope for modest gains. Other EM currencies will be mixed versus the USD on a spot basis, though the Turkish Lira (TRL) will fall given still high inflation. Our EM FX Outlook is here.