View:
October 21, 2026
China September Activity Data Review: Dichotomy between Supply and Demand

October 21, 2026 1:32 AM UTC
China’s dichotomy between supply and demand continued to deepen in September, as sluggish retail sales and fixed-asset investment slump highlighted persistent weakness in domestic demand, with analysts expecting more policy stimulus from Beijing to stave off downside risks. Export and Industrial n
October 20, 2026
U.S. September Pending Home Sales - More signs of housing sector weakness
October 20, 2026 2:17 PM UTC
September’s 7.3% decline in pending home sales is the sharpest decline since December with the level a record low. This adds to growing evidence that rising mortgage rates are undermining housing demand.
U.S. September Housing Starts and Permits - Signs of weakness building
October 20, 2026 12:50 PM UTC
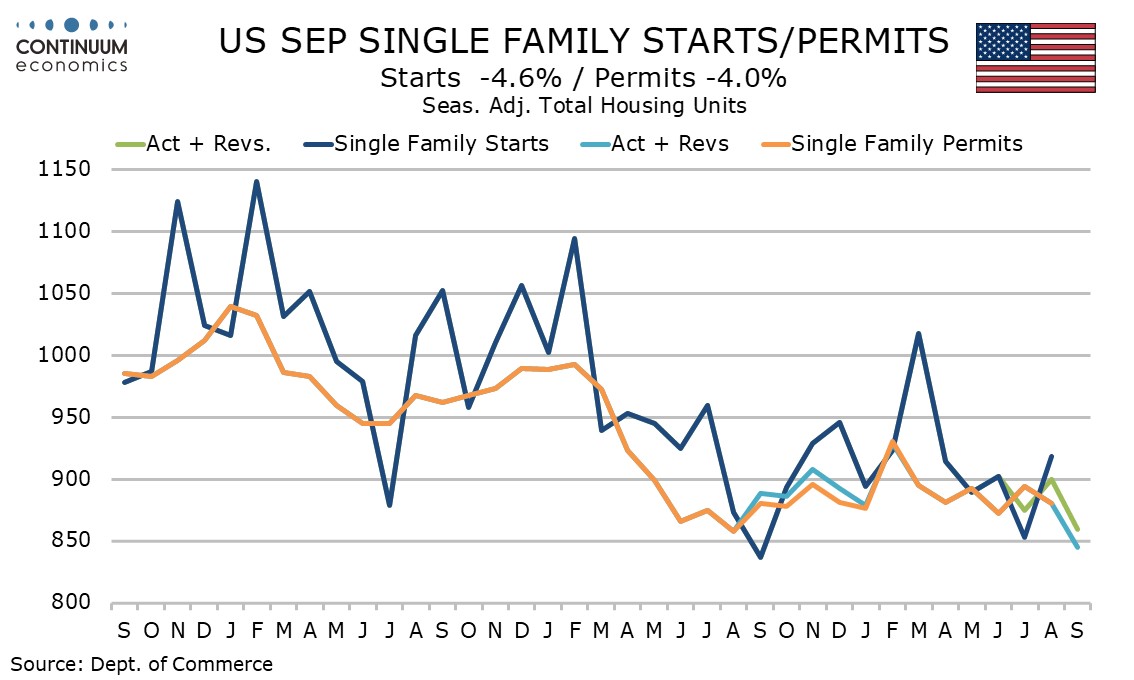
September housing starts are clearly weaker than expected, -5.2% to 1221k, with both singles and multiples lower. Permits held up better, -0.2% to 1400k, but with multiples up and singles down the net message is for a slowing housing sector, restrained by rising mortgage rates.
U.S. September Housing Starts and Permits - Signs of weakness building
October 20, 2026 12:50 PM UTC
September housing starts are clearly weaker than expected, -5.2% to 1221k, with both singles and multiples lower. Permits held up better, -0.2% to 1400k, but with multiples up and singles down the net message is for a slowing housing sector, restrained by rising mortgage rates.
October 19, 2026
UK CPI Preview: Further Increase Will Push the BoE to Hike in November
October 19, 2026 8:47 AM UTC
This week’s CPI headline is expected to continue to reflect the impact of the oil price shock with markets seeing an increase to 3.4% y/y in September from 3.1% before. To date, energy has been the main culprit behind the rise in headline inflation with goods also showing a modest increase (see Fi

UK CPI Preview: Further Increase Will Push the BoE to Hike in November

October 19, 2026 8:46 AM UTC
This week’s CPI headline is expected to continue to reflect the impact of the oil price shock with markets seeing an increase to 3.4% y/y in September from 3.1% before. To date, energy has been the main culprit behind the rise in headline inflation with goods also showing a modest increase (see Fi
October 15, 2026
U.S. September Retail Sales and PPI, October Philly Fed and Empire State, Initial Claims - Generally strong
October 15, 2026 1:15 PM UTC
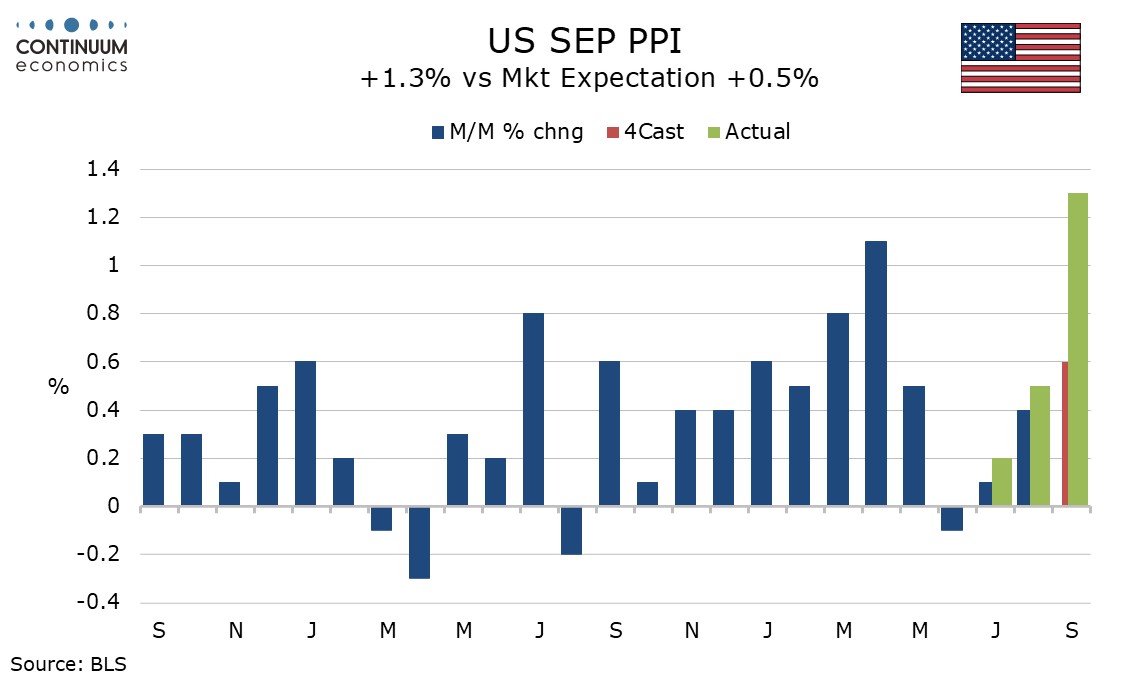
The latest set of US data is on the firm side of expectations, September PPI at 1.3% overall and 0.7% ex food and energy, September retail sales at 0.8%, 0.9% ex autos. Underlying gains of 0.5% for PPI ex food energy and trade and 0.2% for retail sales ex autos and gasoline are less firm but far fro
U.S. September Retail Sales and PPI, October Philly Fed and Empire State, Initial Claims - Generally strong
October 15, 2026 1:15 PM UTC
The latest set of US data is on the firm side of expectations, September PPI at 1.3% overall and 0.7% ex food and energy, September retail sales at 0.8%, 0.9% ex autos. Underlying gains of 0.5% for PPI ex food energy and trade and 0.2% for retail sales ex autos and gasoline are less firm but far fro
UK Growth Resilience Continues in August
October 15, 2026 7:32 AM UTC
In the event, growth did not contract by 0.1% m/m as consensus had expected, but grew 0.1% in August. While the month-on-month number can be volatile, the more reliable 3-month measure is showing the economy is proving to be a lot more resilient than many had expected. The better growth outturn alon

UK Growth Resilience Continues in August
October 15, 2026 7:32 AM UTC
In the event, growth did not contract by 0.1% m/m as consensus had expected, but grew 0.1% in August. While the month-on-month number can be volatile, the more reliable 3-month measure is showing the economy is proving to be a lot more resilient than many had expected. The better growth outturn alon
October 14, 2026
U.S. September CPI - Makes a case for tightening, will Warsh?
October 14, 2026 1:20 PM UTC
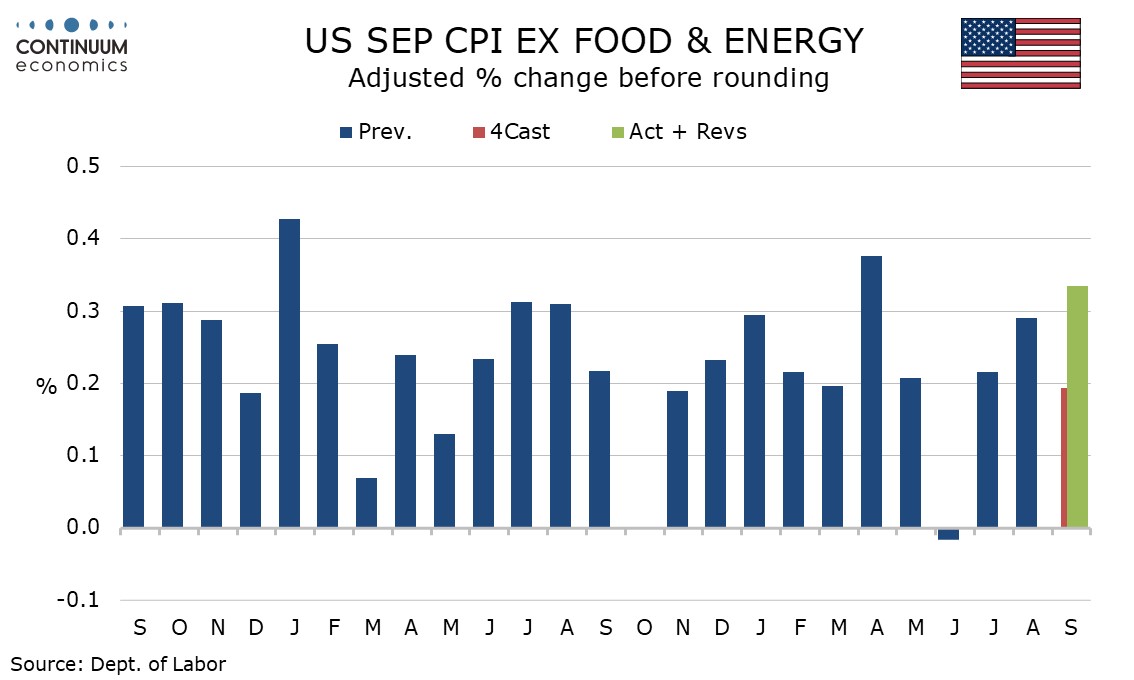
September’s core CPI is stronger than expected at 0.3% and at 0.335% before rounding a clear disappointment, with the strength broader based than August’s 0.29% when almost 0.1% came from what has proven a one-time bounce in telephone services. Overall CPI rise by 0.6% as expected, but was 0.649
U.S. September CPI - Makes a case for tightening, will Warsh?
October 14, 2026 1:19 PM UTC
September’s core CPI is stronger than expected at 0.3% and at 0.335% before rounding a clear disappointment, with the strength broader based than August’s 0.29% when almost 0.1% came from what has proven a one-time bounce in telephone services. Overall CPI rise by 0.6% as expected, but was 0.649
October 13, 2026
U.S. September Existing Home Sales - Correction higher but trend weakening
October 13, 2026 2:19 PM UTC
September existing home sales rose by 1.5% after a 3.2% decline in August, with August’s decline revised from -2.0%. This leaves the data slightly stronger than expected though still on a weakening trend, which is likely to continue given rising mortgage rates.
October 12, 2026
UK GDP Preview: Growth Could Surprise Negatively in August
October 12, 2026 4:05 PM UTC
The economy is expected to have contracted by -0.1% m/m in August following a gain of 0.4% in July. Recall that July’s outturn was better than markets had ben expecting with growth boosted by the services sector, computer programming, and a spending boom in AI and cloud computing activities. Beyon

UK GDP Preview: Growth Could Surprise Negatively in August
October 12, 2026 4:04 PM UTC
The economy is expected to have contracted by -0.1% m/m in August following a gain of 0.4% in July. Recall that July’s outturn was better than markets had ben expecting with growth boosted by the services sector, computer programming, and a spending boom in AI and cloud computing activities. Beyon

China’s Quite 2nd Tier Banking Clean Up
October 12, 2026 7:05 AM UTC
· The quite though large scale action for rural banks takeover and mergers in 2025 shows that the authorities are proactive. This is good long-term, but the transition risks rural and city commercial banks restraining credit supply. Equity capital injections to 8 large state banks is
October 09, 2026
Canada September Employment - Public sector fully explains the sharp decline
October 9, 2026 12:58 PM UTC
Canada’s September employment report shows a strikingly weak headline with a 68.3k decline in employment though the decline is fully explained by a 70k decline in the public sector, while most of the decline (49.4k) came in Quebec. Still, unemployment did increase, to 6.5% from 6.4% as expected. T
October 07, 2026
New York Fed survey shows near term U.S. inflation expectations higher in September, but stable on a 5-year view
October 7, 2026 3:24 PM UTC
The New York Fed’s inflation expectations survey still shows the 5-year view stable at 3.0%, despite the 1-year view accelerating to 3.9% from 3.6%, reaching its highest since June 2023.
October 06, 2026
BoE patience on inflation outlook will be tested the longer conflict goes on
October 6, 2026 1:33 PM UTC
Recent comments by BoE members continue to show a divergence of views between those who prefer a pre-emptive rate hike and those who want to see evidence that the initial oil shock is spreading to the rest of the economy. The three members who voted for a hike last month (Pill, Mann and Green) warn

BoE patience on inflation outlook will be tested the longer conflict goes on
October 6, 2026 1:32 PM UTC
Recent comments by BoE members continue to show a divergence of views between those who prefer a pre-emptive rate hike and those who want to see evidence that the initial oil shock is spreading to the rest of the economy. The three members who voted for a hike last month (Pill, Mann and Green) warn
Despite tariffs, US trade deficits increasing and Canadian trade surpluses increasing
October 6, 2026 1:16 PM UTC
A wider than expected August US trade deficit of $105.6bn from $92.8bn contrasts with a wider than expected August Canadian trade surplus of C$4.2bn versus C$0.79bn in July. The US deficit is the largest since the pre-tariff record of $133.0bn in March 2025. Canada’s August surplus is the widest s