View:
August 03, 2026
Fed SLOOS on Bank Lending shows stronger demand for C+I loans
August 3, 2026 6:27 PM UTC
The Fed’s July Senior Loan Officer Opinion Survey of bank lending practices suggests a positive picture for commercial and industrial loans, particularly for large firms, presumably led by AI, though elsewhere the survey presents a less impressive picture.
U.S. July ISM Manufacturing - Strong but with supply problems
August 3, 2026 2:26 PM UTC
July’s ISM manufacturing index of 55.6 from 53.3 is stronger than expected and the highest since May 2022, suggesting this year’s manufacturing revival, led by AI-related business investment, is accelerating further.
Preview: Due August 13 - U.S. July PPI - Prices seen subdued when data was surveyed
August 3, 2026 1:12 PM UTC
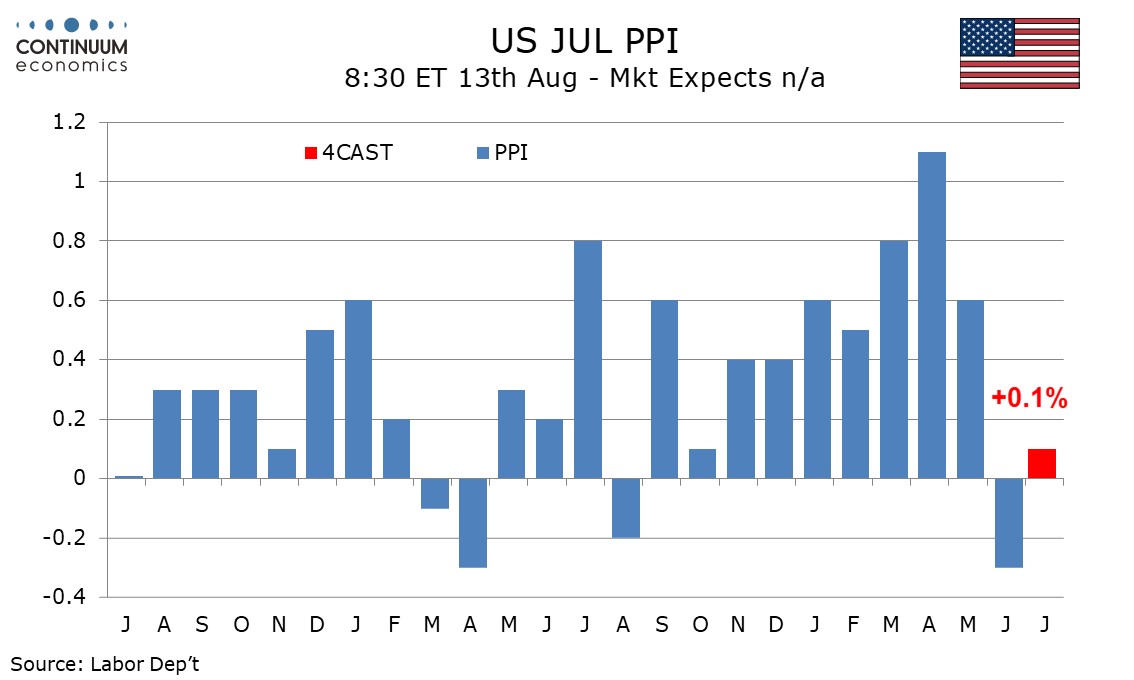
We expect July’s PPI to reflect more the more optimistic view of the Middle East seen at the start of the month than the riskier one later in the month. We expect gains of 0.1% overall, 0.3% ex food and energy and 0.2% ex food and trade, mostly subdued, if stronger than respective June outcomes of
Preview: Due August 13 - U.S. July PPI - Prices seen subdued when data was surveyed
August 3, 2026 1:12 PM UTC
We expect July’s PPI to reflect more the more optimistic view of the Middle East seen at the start of the month than the riskier one later in the month. We expect gains of 0.1% overall, 0.3% ex food and energy and 0.2% ex food and trade, mostly subdued, if stronger than respective June outcomes of
Preview: Due August 4 - U.S. June Trade Balance - Deficit to correct lower, but remain large
August 3, 2026 12:40 PM UTC
We expect a June trade deficit of $73.5bn, down from $77.6bn in May which was the widest since a record pre-tariff deficit in March 2025, but still significantly above the deficits seen in the first four months of 2026, each of which was close to $55bn.
The Fed's Balance Sheet: Revolution or Recalibration
August 3, 2026 9:18 AM UTC
· Fed chair Warsh has reopened the question of how the Federal Reserve implements monetary policy, not just the size of the balance sheet. The two go hand in hand.
· The realistic choice is not between today's balance sheet and a return to 2006, but among several ways of o
USD/JPY, EUR/USD flows: Notable breaks cemented after US blinked on USTs?
August 3, 2026 6:44 AM UTC
USD/JPY makes downward inroads on the charts after confirmed intervention
Brent to new pullback lows on regional initiative to broker deal
Joining dots could be the US blinking as UST yields reached critical highs