U.S. Consumption Vulnerable to Asset Market Hit
Overall, we see consumption growth prospects as being modest for 2026, as low to middle income households still struggle with the cost of living crisis. Additionally, the slowdown in immigration is causing less overall employment gains and in turn less absolute increase in real income and consumption.
U.S. consumption is a two tier story with workers on below average income struggling, but consumption being sustained by high income households. What are the risks for 2026?
Figure 1: Income, Wealth and Consumption of top 20% (%)
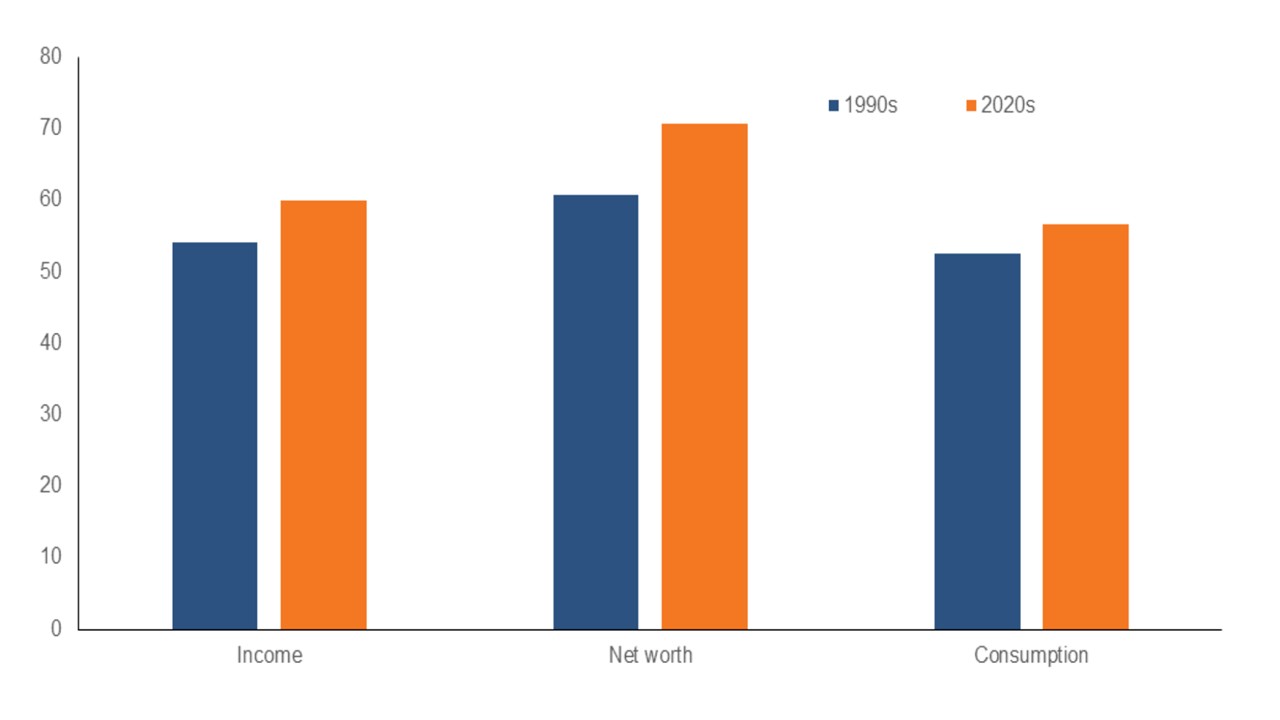
Source: Dallas Fed (here)
High income households are helping to sustain U.S. consumption growth, with Dallas Fed estimates that 57% of consumption is driven by the top 20% of workers – their income and wealth share is even bigger (Figure 1). In contrast workers on average incomes or below complain about the cost of living crisis – that wages have struggled to keep up with inflation since 2019 (Figure 2). BEA data estimates that personal income for the bottom 20% grew by 2.7% in 2024 compared to 5.5% for the top 20% (here). This means that average measures such as mean rather than median can underestimate the challenges facing lower income groups, which face lower wage growth than high income groups but also a larger exposure to higher price essentials. Additionally, Boston Fed research shows that low income households credit card debt has risen above pre pandemic levels (here), which underlines the challenges facing low to middle income groups.
For lower income groups, the feedthrough of the Trump administration tariffs and forthcoming health insurance increases for some households due to new Obamacare restrictions are a further blow going into 2026. Additionally, lower to mid-income households Republican voters had hoped for lower price levels rather than higher, given President Trump promises on the campaign trail during 2024 – which also explains some of the pessimism in consumer confidence surveys. Lower to middle income groups depend heavily on wages and thus a stalling of hiring or rising layoffs is a severe threat to individual households, but in a macro perspective only impacts if hiring freeze and layoffs are big.
Figure 2: PCE Prices and Employment Cost Index (Q4 2019 = 100)
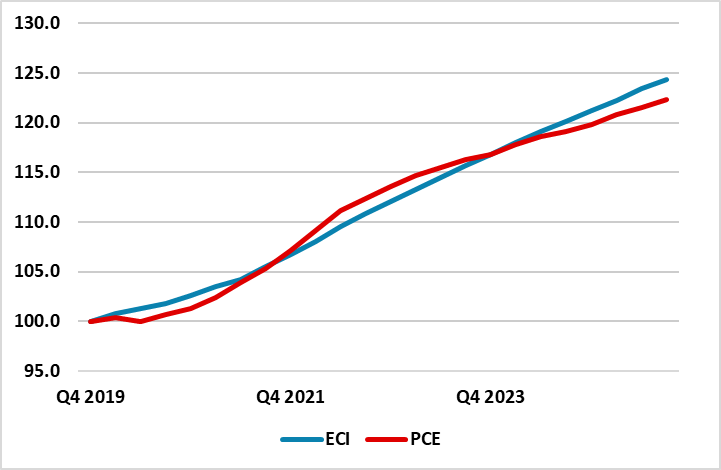
Source: Datastream/Continuum Economics
For high income households, the real threat to consumption is a U.S. equity bear market. The Dallas Fed did a simulation exercise that showed a great impact from a U.S. equity market selloff than a slowdown in income growth (Figure 3) – high unemployment has the least impact, due to the safety net from unemployment benefits. A U.S. equity bear market is not our baseline for 2026, but rather a correction that will likely not have too much impact on high income groups. The big beautiful bill also has tax rebates for households that will help in H1 2026.
Figure 3: Percentage Change in Consumption From Various Shocks (%)
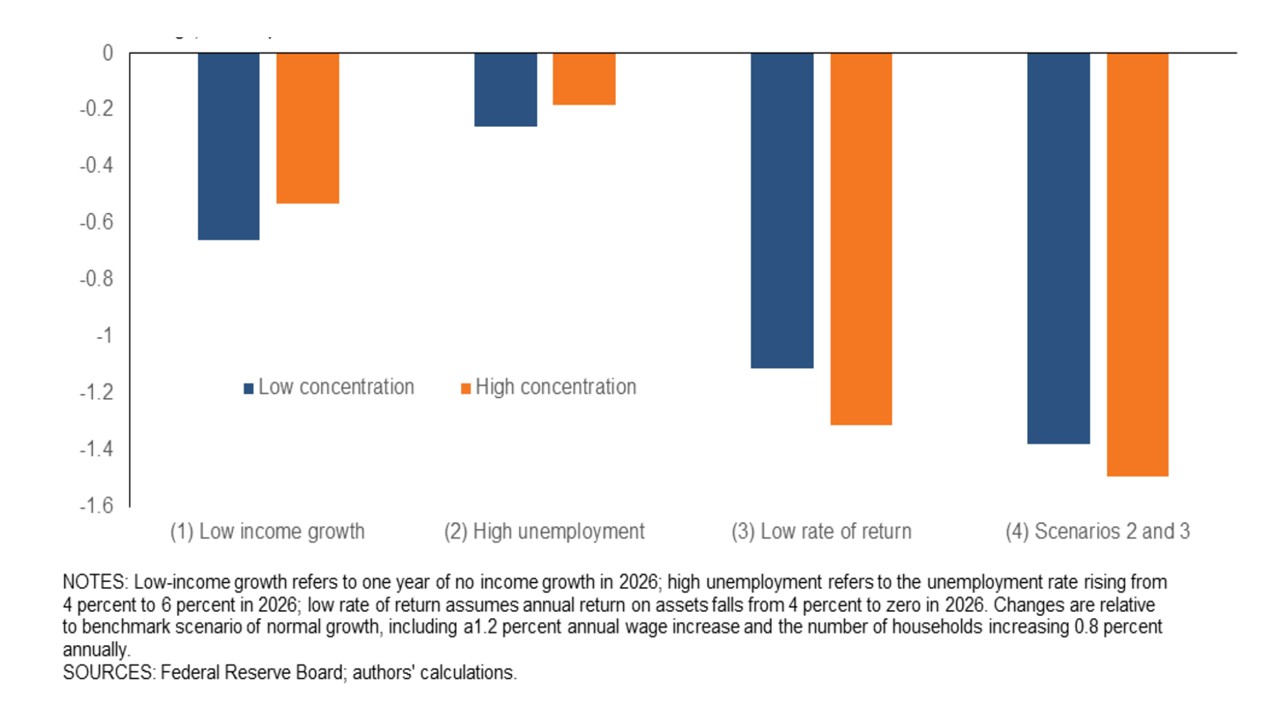
Source: Dallas Fed (here)
Overall, we see consumption growth prospects as being modest for 2026, as low to middle income households still struggle with the cost of living crisis. Additionally, the slowdown in immigration is causing less overall employment gains and in turn less absolute increase in real income and consumption. This all points to a soft H1 2026 as outlined in our U.S. outlook (here), but lagged Fed easing plus two more 25bps cuts should help support the economy H2 2026.
AI cost savings via labor shedding has started to appear (here), but for the next 1-2 years is unlikely to be at a faster pace than the ICT revolution (manual jobs are unlikely to be cost effectively replaced until the 2030’s due to battery life problems with humanoid robots). However, fear that AI could replace eventually jobs could impact 2026/27 consumer behaviour, and this needs to be monitored in the U.S.