Markets 2026
· The Fed, ECB and BOE will likely drive further 10-2yr government bond yield curve steepening, with 10yr Bund yields rising due to ECB QT and German fiscal expansion. 10yr JGB yields are set to surge through 2%, as BOJ QT remains excessive and underestimated. The BOJ could partially reverse QT.
· In equities, the U.S. equity market is now extremely overvalued on equity only and equity-bond valuations measures. In 2026, we expect a 5-10% correction and then a rebound, that ends up leaving the S&P500 at 6600 by end 2026. Other DM equity markets will likely see small to modest outperformance, restrained by domestic cyclical and structural stories. In EM equities, China equities are at risk of a correction and we prefer India and Brazil in 2026 (long-term earnings and rate cuts respectively).
· In the DM FX space, the JPY is once again undervalued versus fundamentals such as the 10yr U.S.-Treasury-JGB spread. We can see JPY appreciation and our end 2026 forecast is now 140. The USD can decline further against other DM currencies, but will likely be less than 2025. For example, we see EUR/USD at 1.20 by end 2026, which reflects the impact of further Fed easing and further multi-year unwinding of USD overvaluation.
· In EM FX, for 2026 as a whole, we still like the BRL on a total return basis, helped by a stable spot rate and large nominal and real interest rate differentials. MXN is vulnerable in H1 2026 to President Trump taking an aggressive stance in the USMCA negotiations.
Figure 1: End 2026 Asset Allocation View
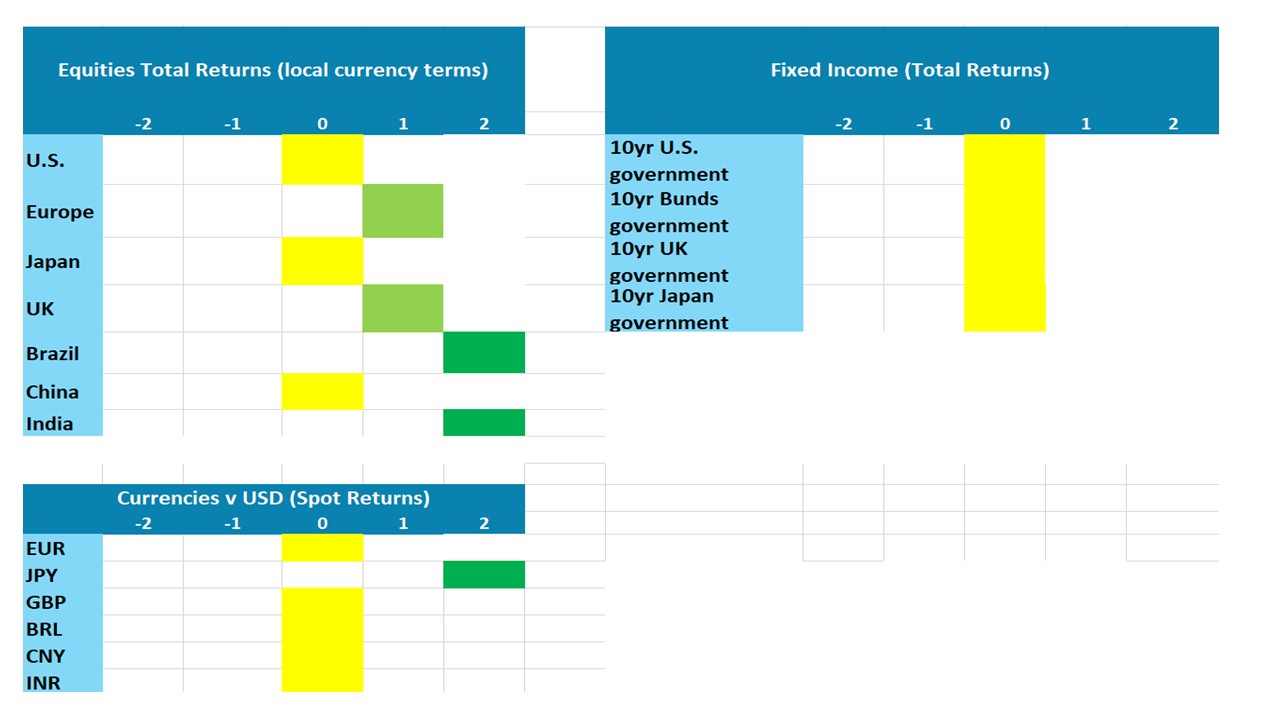
Source: Continuum Economics
Economic Backdrop
Before turning to our 2026 financial market forecasts it is worth summarizing our key economic projections. These largely come from the September Outlook (here) and will be fine tuned in the December Outlook due December 19 – we will also provide quarterly details of our 2027 economic, policy and financial market forecasts. Our 2027-30 annual forecasts have already been revised and are available on our forecast section (here). Key points for 2026 include.
· The critical question is how much the U.S. economy is slowing with the feedthrough of President Donald Trump’s tariffs boosting inflation and restraining GDP growth, with the effective rate currently around 17% on U.S. imports. Some of this has occurred in 2025, but it will still feedthrough in 2026. Additionally, we expect the Supreme Court to reject part or all Trump’s reciprocal tariffs (here), which will add to uncertainty and the Trump administration will likely result in some alternative tariffs but also try to get trade framework to become actual trade deals and tariffs. Even so, our economic baseline remains for a slowing rather than a hard landing for the U.S., with tax cuts from the 10yr budget bill being mildly stimulative in H1 2026. The December FOMC meeting is a close call and for now we are penciling in a further 25bps cut from the Fed. More importantly, we then see the Fed pausing in Q1, as the inflation/growth picture warrants patience. We see a further two 25bps cuts before the Fed pausing throughout 2027 (Figure 2). While Trump appointees will increase at the Fed, they are unlikely to dominate voting or actual policy rate levels but could led to internal Fed disagreements and communication problems.
· Other DM economies have the headwind of tariffs on U.S. trade, but economic recoveries are also being restrained by population aging; slow productivity and in certain countries cautious consumers. Tariffs outside the U.S. are also disinflationary, as they hurt exports and employment; and as China is seeking to redirect excess production at competitive prices. This points to further easing by end 2026 from the ECB (50bps) and BOE (100bps), though fiscal policy is mixed with UK tightening but Germany easing. Further BOJ rate normalization will be slow, as inflation slows.
· For EM countries, the tariff reality is also a headwind for exports and capex, with the scale influenced by the scale of openness for the economies. For China, a modest consumer, plus continued drag from residential investment, structural drag from population aging and slowing productivity, points to a trend slowdown to 4%. However, further fiscal stimulus is highly likely and suggests 2026 GDP growth of 4.5%. India should prove resilient, due to domestic stimulation. Brazil will likely slow as the lagged effects of very tight monetary policy feed through.
· Geopolitically our baseline (70%) remains for the war in Ukraine to drag into 2026, as Putin maintains a hard line stance and talks have failed to reach a ceasefire or peace deal. Meanwhile, with the U.S. strategic ambiguity policy towards Taiwan remaining in place, a military invasion or PLA navy blockade of Taiwan would be too high risk for Xi. Instead, we expect further grey warfare in 2026, with a small to modest chance of a temporary China coastguard quarantine (here).
Market Forecasts and 2026 Asset Allocation
It is worth starting with our government bond yield forecasts, given the impact on other markets. For 2yr U.S. Treasuries we see scope for a further decline in yields, both as the Fed delivers a neutral policy rate and we do not see a 2027 tightening cycle. Though the supply situation has improved with the Fed balance sheet expansion likely to see around USD25bln monthly purchases, the budget deficit remains large enough to keep real yields around 2%. With core PCE inflation likely to slow, but still remain just above 2%, a U.S. soft landing makes it difficult to see a sustained decline below 4% 10yr yields (Figure 2). Yield curve steepening is thus favored, for more details see our 2026-27 U.S. Treasury view (here). Only in our alternative scenario of a mild U.S. recession would 10yr yields fall consistently below 4%, with aggressive Fed easing – though we now see the probability of such a scenario as 20% rather than 30%.
Figure 2: U.S. Treasury and Fed Funds Forecasts (%)
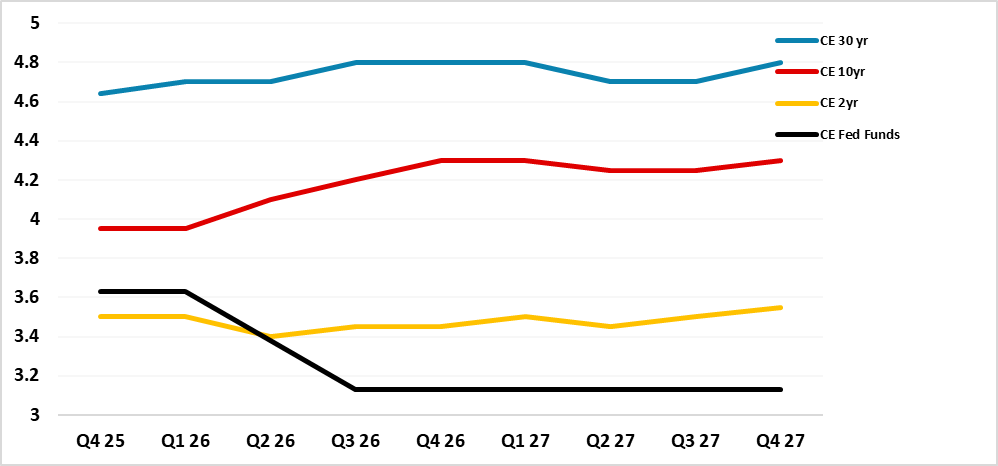
Source: Continuum Economics
In other DM countries, 2yr Bund and Gilt yields have scope to fall, given we see more easing than the market currently sees. However, 10yr Bund yields will likely move higher due to large ECB QT; normal end of cycle steepening and German fiscal expansion. Concerns over a 2027 French budget crisis could kick in late 2026 and cap Bund yields (here). 10yr Gilt yields will likely be choppy, as supply remain heavy with BOE QT adding to the UK budget deficit (Figure 3). Meanwhile, internal Labour infighting risks the fiscal rules in their current form. For more on the 2026-27 Gilt view, see here. Yield curve steepening is preferred in U.S./EZ and UK, which means better returns in the front-end and only modest 10yr returns in 2026.
10yr JGB yields look likely to surge past 2% and could spike towards 2.5%, given excessively large BOJ QT more that modest BOJ policy rate hikes (here). This will likely prompt the BOJ to then do a partial U turn and stop raising the policy rate beyond 1%.
Figure 3: 10yr Government Bond Yield Forecasts – Major DM’s (%)
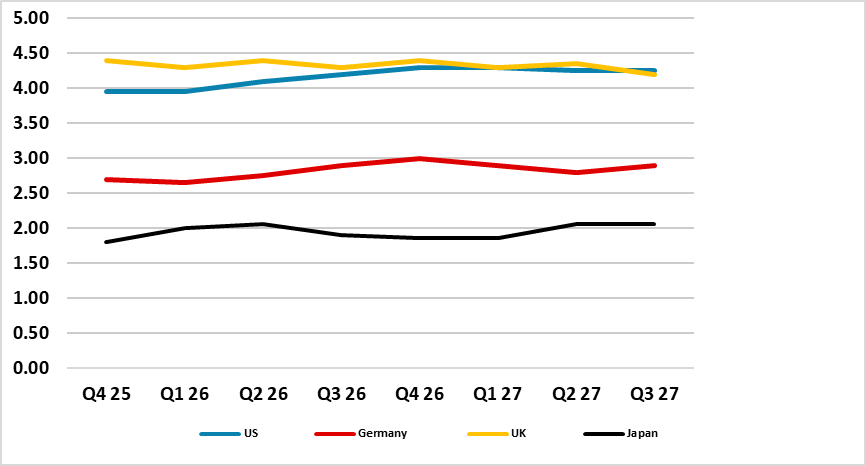
Source: Continuum Economics
For the U.S. equity market, private sector data shows the risk of a U.S. hard landing is lower than a couple of months ago, with economic data more consistent with a soft landing. Additionally, the tech/AI optimism has not been dented, while buybacks would only be hurt by a hard landing. Even so, the U.S. equity market is now extremely overvalued on both equity-only and equity-bond valuations measures (Figure 4). In 2026, we expect a 5-10% correction and then a rebound, that ends up leaving the S&P500 at 6600 by end 2026 (here).
Figure 4: 12mth Fwd S&P500 P/E versus 10yr Inverted Real Bond Yield (%)
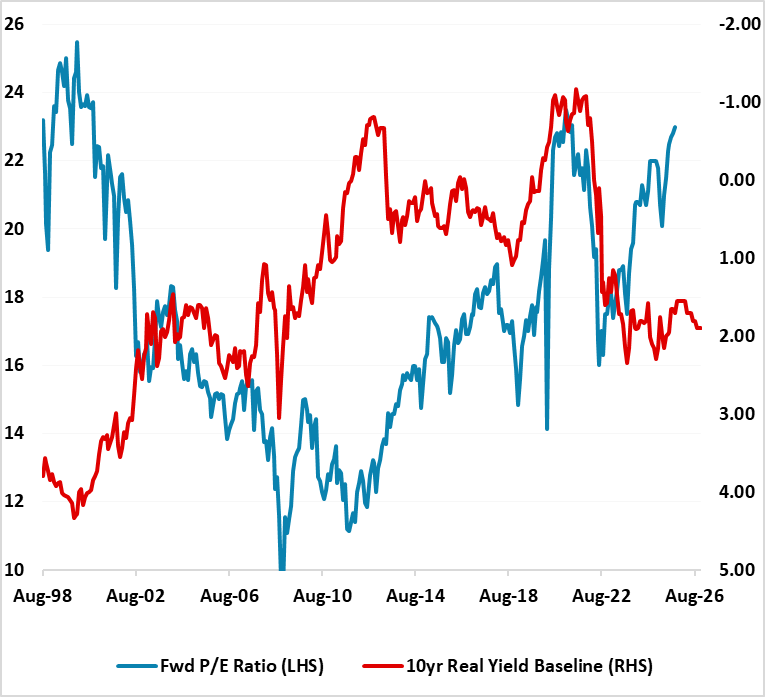
Source: Datastream/Continuum Economics. Using Real Indexed Linked Yields and Projections.
For other DM equity markets, we can see modest outperformance versus the U.S. by end 2026 (Figure 1), given less stretched valuations in equity or equity-bond comparables. Even so, EZ equities will face the headwind of a slow recovery; UK equities face lingering fiscal and political concerns, while Japan equities look overdone on the actual fiscal easing that will likely be seen.
In EM equities, the China rally is not built on firm foundations and is at risk of a correction given that nominal GDP is a mere 5% and a major headwind to corporate earnings growth. Some outperformance can occur on a better U.S./China trade framework but a trade deal is now unlikely (here), though strategically we still have concerns over China multi-year. Elsewhere, India is once again expensive and unlikely to outperform in the next 3-6 months, but H2 2026 should be better and scope exists to outperform then. For Brazil’s equities, H2 2026 should see consistent BCB easing helping to bring down bond yields and allowing a fall in fwd earnings yields that sees the price/earnings ratio moving up towards 10. 10% outperformance versus the U.S. can be seen in 2026.
For more details see the September Equity Outlook (here).
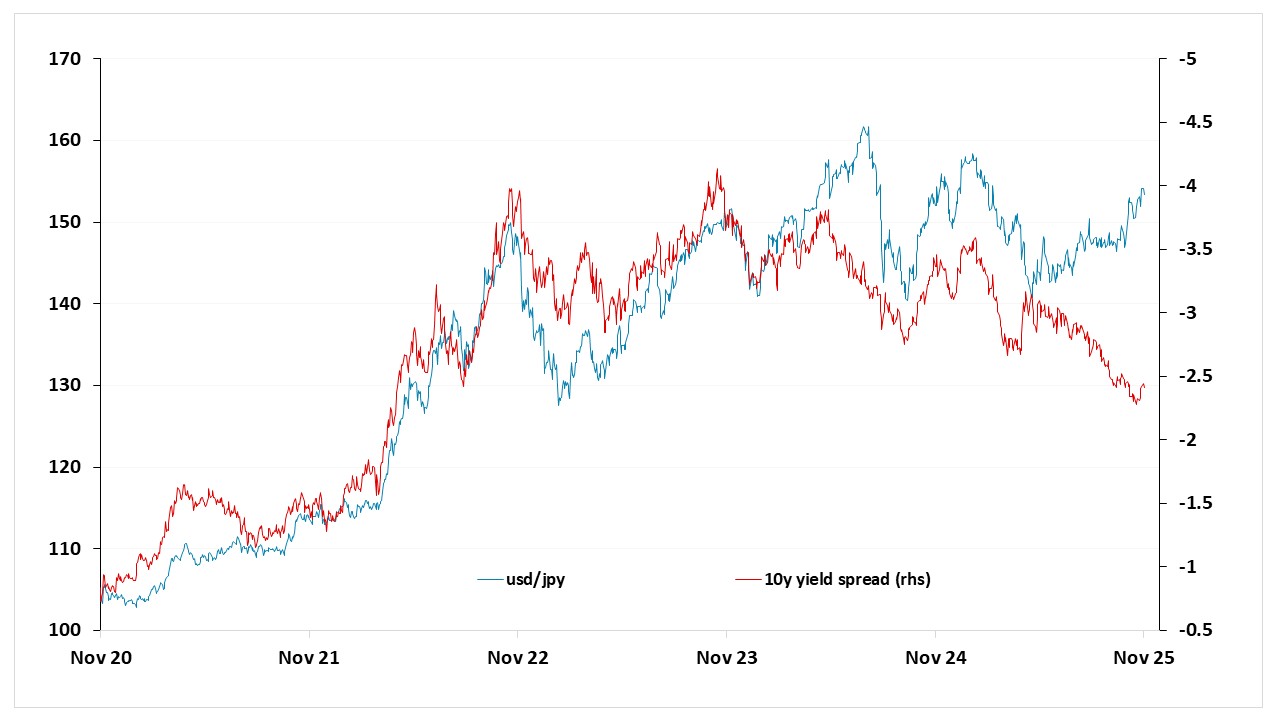
In DM FX, the JPY has been weak with the change of LDP leader, but also the inverse relationship with the buoyant and overvalued U.S. equity market. Though this can carry on in the near-term, the JPY is once again undervalued versus fundamentals such as the 10yr U.S.-Treasury-JGB spread. We can see JPY appreciation in 2026 and our end 2026 forecast is now 140 (here). The USD can decline further against other DM currencies, but will likely be less than 2025. For example, we see EUR/USD at 1.20 by end 2026, which reflects the impact of further Fed easing and further multi-year unwinding of USD overvaluation.
Figure 5: USDJPY and 10yr U.S.-JGB Government Bond Spread (level and %)
Source: Continuum Economics
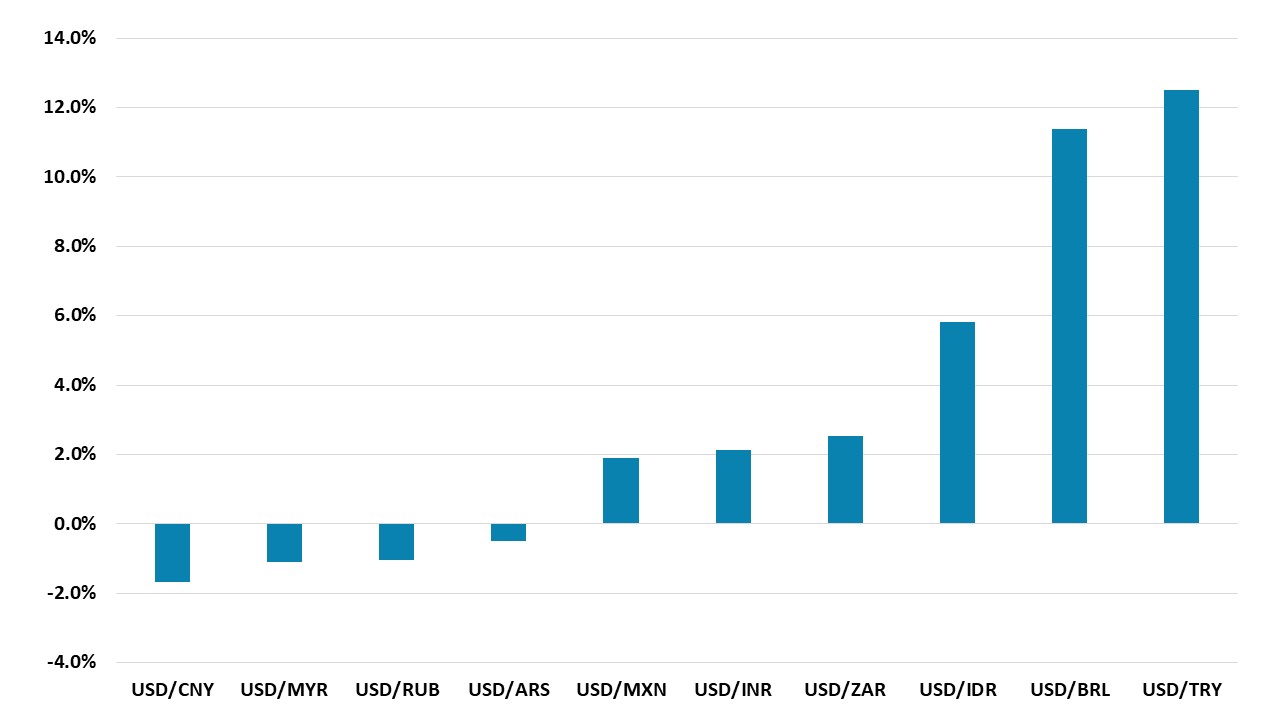
In the EM FX arena, the USD has stabilized rather than seen a partial recovery. Nevertheless, renewed uncertainty with a likely Supreme Court part or full ruling against Trump’s reciprocal tariffs will likely cause some volatility on EM currencies, with small nominal and real yield differentials against the USD e.g. India Rupee (INR) and Indonesian Rupiah (IDR). A correction can also be seen in the Mexican Peso (MXN) in H1 2026, as Trump pushes aggressively for a reset USMCA deal. The Brazilian Real (BRL) will be less impacted, as nominal and real interest rate differentials remain large, though some softening can be seen into October Brazilian presidential election. The Chinese Yuan (CNY) will likely consolidate in 2026, as the trade truce with the U.S. will be difficult to turn into a positive and comprehensive trade deal (here). For 2026 as a whole, we still likely the BRL on a total return basis (Figure 6), as the Turkish Lira (TRL) gains will likely be volatile at times.
Figure 6: End 2026 Total Returns EMFX v USD
Source: Continuum Economics