U.S. Treasuries: Waiting for Data and Yield Curve Steepening
• Multi quarter we still look for 75bps of further Fed easing by end 2026, which will likely initially bring 2yr yields down to 3.4%. However, once the Fed Funds rate get closer to 3.0-3.25% and the slowdown turns into a soft landing, the 2yr will likely move to a premium versus Fed Funds. We see around a 25-35bps 2yr-Fed Funds spread by end 2026. 10yr yields can once again dip below 4% on cyclical economic concerns in the coming months, but in 2026 are likely to rotate back above 4%. 10-2yr will likely steepen to 80-90bps.
Figure 1: 2yr-Fed Funds and Fed Funds Rate Inverted (%) 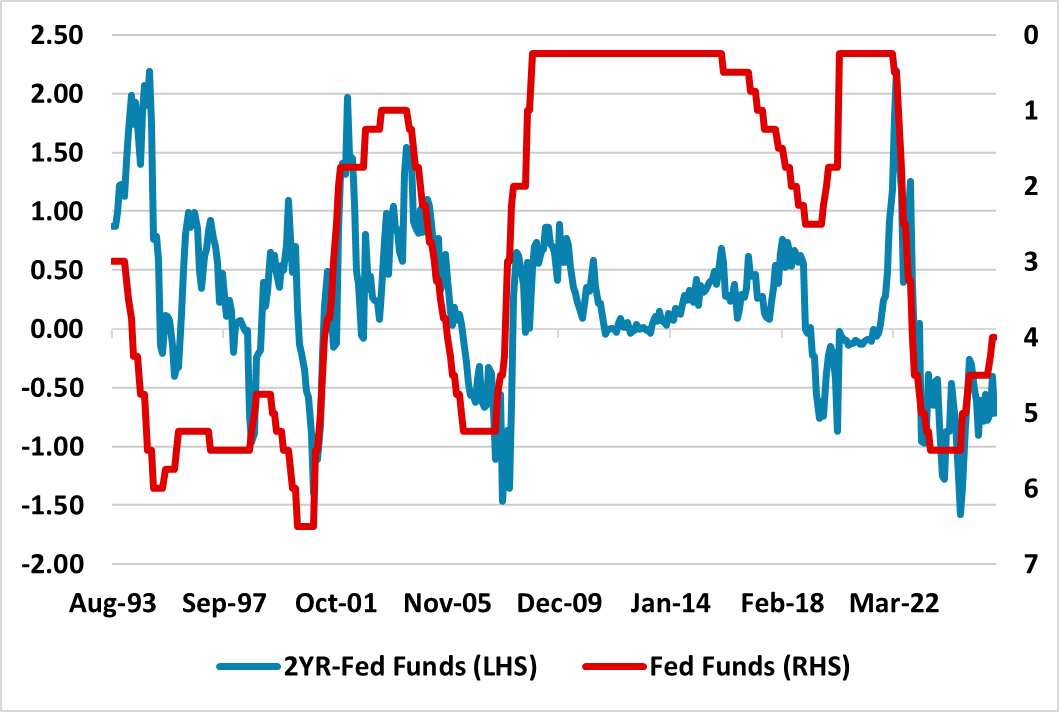 Source: Datastream/Continuum Economics
The U.S. Treasury market is in a broader holding pattern. Though the October FOMC (here) has tempered ideas of a 25bps at the December FOMC meeting, the market still feels that the Fed Funds rate in 2026 will get close to the neutral policy rate with a 3.00-3.25% policy rate still regarded as feasible. Though economists have been pushing up Q3 GDP estimates, the softness in the labor market still exists and the debate is still between below trend growth into late 2025 or a deeper slowdown. The market remains inclined to the actual tariff rate of around 17% still feeding into slow growth and producing a temporary rise in inflation. Private sector data in the absence of federal data has also left the market taking this wait and see approach. The government shutdown should end in November, which will mean more data for the markets. However, the restart of data collection will mean that some of the data will be suspect (some may also not be released in full) and this will reduce interpretation of the data e.g. October and November CPI. Multi quarter we still look for 75bps of further easing by end 2026, which will likely initially bring 2yr yields down to 3.4% (Figure 2). If a hard landing is seen then the Fed could ease to 2.0-2.5% and produce a larger 2yr yield decline. However, our previous 30% probability of a hard landing will likely be reduced in the December outlook, as economic data is not deteriorating sharply to sustain this probability. However, once the Fed Funds rate gets closer to 3.0-3.25% and the slowdown turns into a soft landing, the market will likely worry that the policy rate is close to bottom and the risk of higher rates need to factored into 2yr yields. While we see inflation coming down in H2 2026, it is unlikely to undershoot target. We see around a 25-35bps 2yr-Fed Funds spread by end 2026, which is more controlled than the experience at the end of Fed easing cycle in the 1990’s (Figure 1).
Figure 2: U.S. Treasury and Fed Funds Forecasts (%) 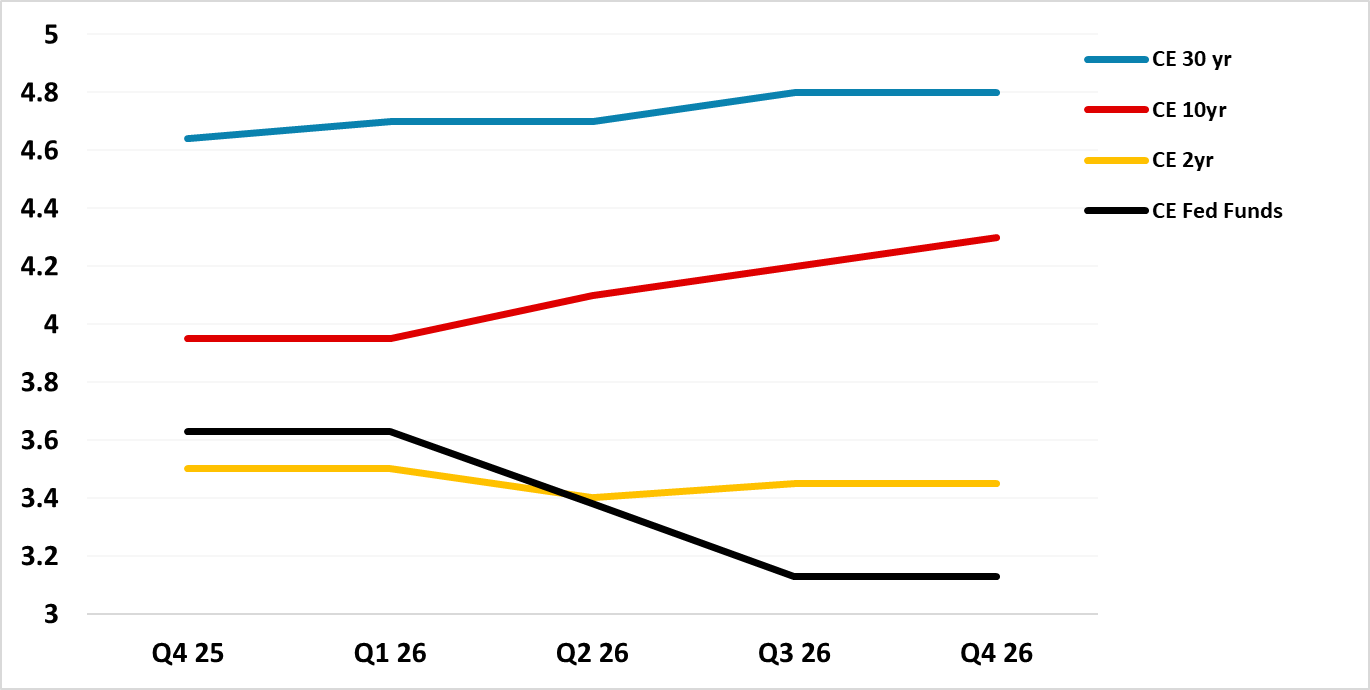 Source: Continuum Economics
In terms of 10yr yields, the bond supply picture has improved with CBO estimate of large tariff revenues in the coming years. Though the supreme court could derail reciprocal tariffs, it is likely that the Trump administration would find a substitute and framework deals have also been agreed with a lot of major countries. This means supreme court rejection is unlikely to radically dent tariff revenue in the long-run, though could compound short-term uncertainty. For now we pencil in a budget deficit of 5.5% of GDP for 2026. The supply situation has also improved with the Fed decision to start increasing the size of the balance sheet in line with nominal GDP, which could mean a passive rise in Treasury holdings by USD25bln pm in 2026. This is in sharp contrast to other G4 government bond markets where QT is still large and means that the net supply to be absorbed by the market is heavier than for U.S. Treasuries (Figure 3). We also suspect that cyclical economic worries will produce a further dip below 4.0% yields in the coming months.
Figure 3: G4 Budget Deficits and Bond Portfolio Change (% of GDP) 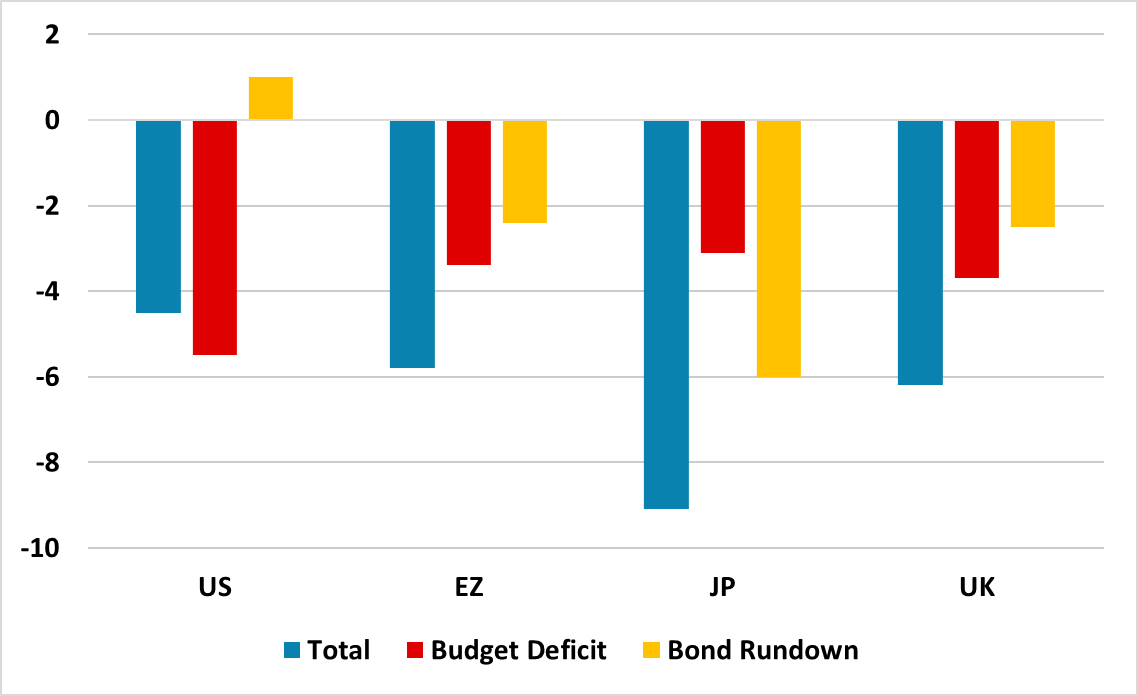 Source: Continuum Economics
However, the 10-2yr yield curve tends to steepen further, as a Fed Fund easing cycle gets to a mature stage. The current yield curve is also not steep by 1990’s standards (Figure 4) and we can see choppy 10yr yields edging back above 4% into 2026 (Figure 3) and 10-2yr yield curve steepening to 80-90bps.
Figure 4: 10-2yr U.S. Treasuries and Fed Funds Inverted (%) 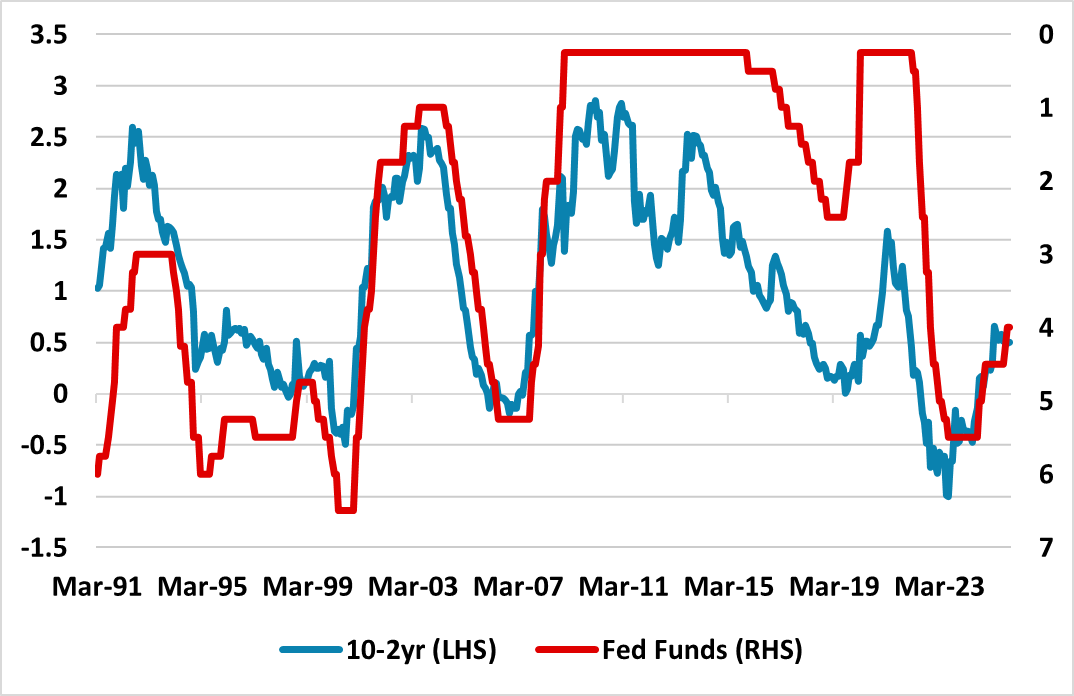 Source: Datastream/Continuum Economics