DM Rates Outlook: 2026 Yield Curve Steepening Before 2027 Flattening
· Multi quarter, we still look for 50bps of further Fed easing by end 2026, which will likely initially bring 2yr yields down to 3.35%. However, once the Fed Funds rate get closer to 3.0-3.25% and the assumed slowdown turns into a soft landing, the 2yr will likely move to a premium versus Fed Funds. We see around a 20-30bps 2yr-Fed Funds spread by end 2026. 10yr yields can dip to 4% on cyclical economic concerns in the coming months, but in H2 2026 are likely to rotate back above 4.25%. 10-2yr will likely steepen to 90-100bps. 2027 will likely see yield curve flattening, as the market worries about 2028 Fed tightening and 2yr yields drift higher.
· In the EZ, financial conditions are tighter than suggested by a 2% ECB depo rate, which will both restrain an EZ economic pick-up and cause further disinflation. We see the ECB delivering two further 25bps cuts to a 1.5% ECB depo rate, which can mean a further decline in 2yr Bund yields. However, H2 will likely see 2yr Bund yields pushing to a 20-30bps premium versus the ECB depo rate. 10yr Bund yields can ratchet up to 3%, with a pick-up in German issuance and ongoing ECB QT. Even so, 10yr Bund yields could be capped in Q4 2026 by concerns that the May 2027 French presidential election will not prompt a move towards fiscal consolidation. This could see more French fiscal pressures in 2027 and worst case a crisis, which could paralyse the ECB!
· While some fiscal stimulus into 2026 is likely from new PM Takaichi, this is unlikely to be aggressive given the government debt trajectory and the need for support from other parties in passing fiscal measures. A return to QE (2nd arrow of Abenomics) is highly unlikely, with the BOJ undertaking ever more aggressive QT that will likely push 10yr JGB yields above 2% in 2026. The supply picture is so bad that a large spike in 10yr JGB yields will likely be seen to 2.5%, but this would likely prompt slower BOJ QT (via a U turn to increase monthly bond buying) rather than a return to QE. We do see further BOJ policy rate hikes to 1.0%, but then a slowdown in CPI and government pressure will likely produce a hold throughout 2027.
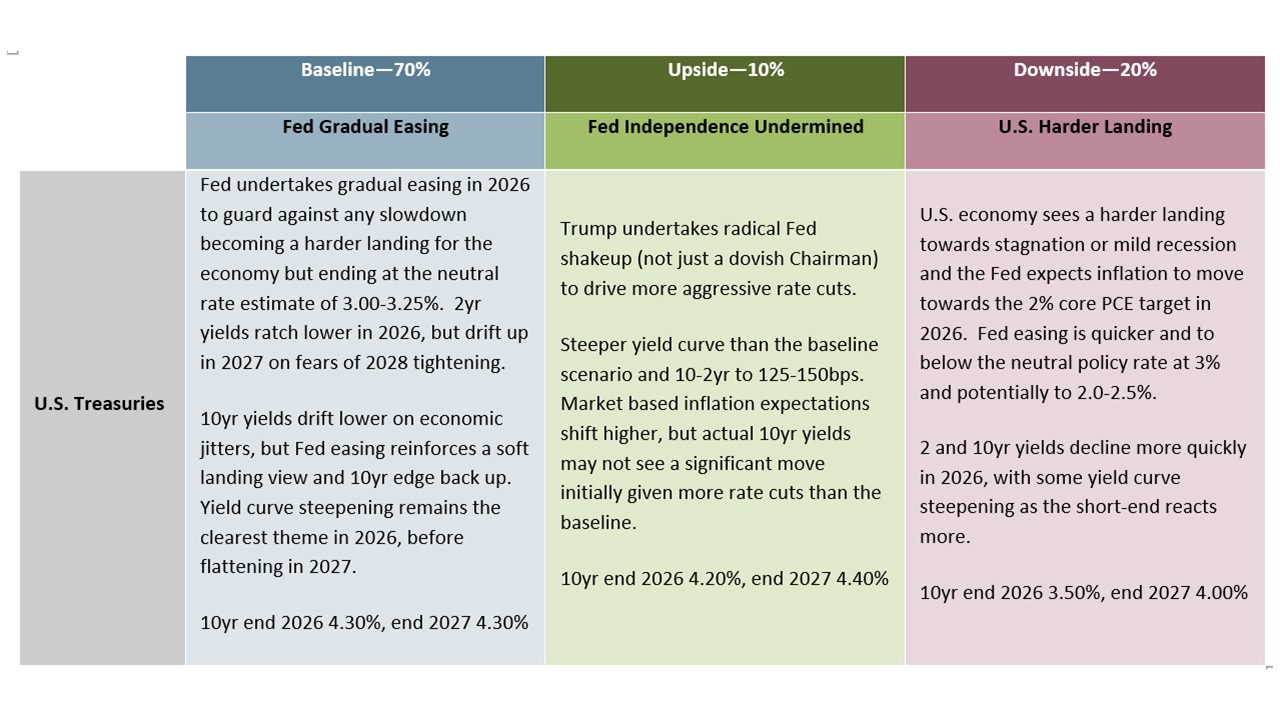
Risks to our views: The U.S. economy sees a harder landing towards mild recession and the Fed expects inflation to move towards the 2% core PCE target in 2026. Fed easing is quicker and potentially to 2.0-2.5%. 2 and 10yr yields decline more quickly in 2025 (Figure 4).
Figure 1: Fed Funds, 2, 10 and 30yr U.S. Treasury Yields Forecasts (%)
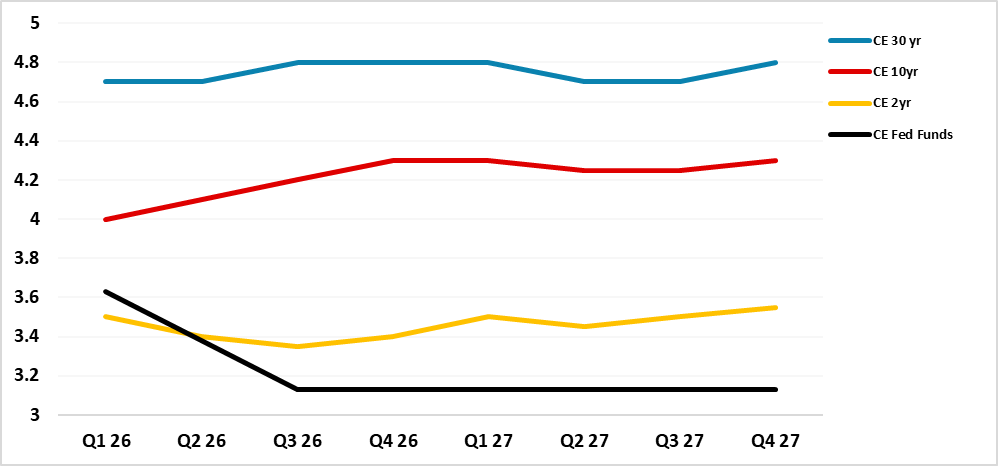
Source: Continuum Economics
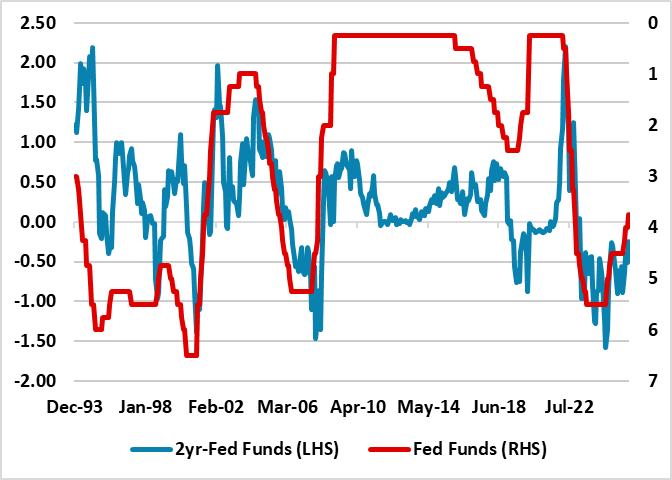
The U.S. Treasury market is in a broader holding pattern. Though the December FOMC (here) delivered the prospect of a Q1 pause, the market still feels that the Fed Funds rate in 2026 will get close to the neutral policy rate with a 3.00-3.25% policy rate still regarded as feasible. Though economists have been pushing up Q3 GDP estimates, the softness in the labor market still exists and the debate is still leaning towards below trend growth into H1 2026. The market rightly remains inclined to the actual tariff rate of around 14% still feeding into slow growth and producing a temporary rise in inflation. Though a high risk exists of the Supreme Court reject part or all of Trump’s reciprocal tariffs, they will likely be partly replaced and not radically change the Fed outlook. Multi quarter we still look for 50bps of further easing by end 2026, which will likely initially bring 2yr yields down to 3.3% (Figure 1). We do not see a new Fed chair (here) being able to get the Fed to ease below a 3.00-3.25% Fed Funds rate on our baseline view of a soft landing and 2026 core PCE being just above target. The Dec 11 reappointment of all district Fed presidents for 5 years (here) means that the majority of the FOMC will likely follow normal rate setting patterns depending on the data. If a hard landing is seen then the Fed could ease to 2.0-2.5% and produce a larger 2yr yield decline. Even so, our previous 30% probability of a hard landing has been reduced to 20%, as economic data is not deteriorating sharply to sustain this probability. However, once the Fed Funds rate gets closer to 3.0-3.25% and the slowdown turns into a soft landing, the market will likely worry that the policy rate is close to bottom and the eventual risk of higher policy rates need to factored into 2yr yields. While we see inflation coming down in H2 2026, it is unlikely to hit the target. We see around a 20-30bps 2yr-Fed Funds spread by end 2026, which is more controlled than the experience at the end of Fed easing cycle in the 1990’s (Figure 2).
Figure 2: 2yr-Fed Funds Spread and Fed Funds Rate Inverted (%)
Source: DataStream/Continuum Economics
In terms of 10yr yields, the bond supply picture has improved with the CBO estimate of large tariff revenues in the coming years. Though the Supreme Court could derail reciprocal tariffs (here), it is likely that the Trump administration would eventually find a partial substitute of extra tariffs while framework deals have also already been agreed with a lot of major countries. This means Supreme Court rejection is unlikely to radically dent tariff revenue in the long-run, though could compound short-term uncertainty. For now we pencil in a budget deficit of 6.0% of GDP for 2026, with the risk of 0.5% extra if the Supreme Court rules against all reciprocal tariffs. The supply situation has also improved with the Fed decision to start increasing the size of its balance sheet in line with nominal GDP, which could mean a passive rise in Treasury holdings by USD25bln per month in 2026. This is in sharp contrast to other G4 government bond markets where QT is still large and means that the net supply to be absorbed by the market is heavier than for U.S. Treasuries (Figure 4).
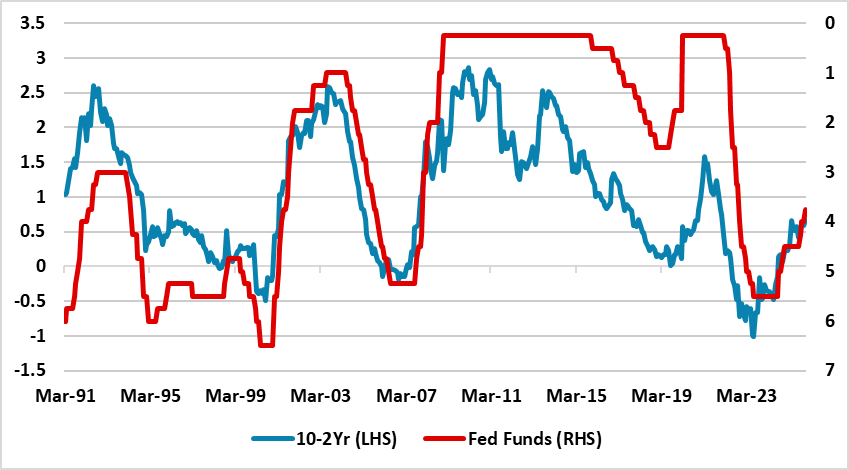
We also suspect that cyclical economic worries will produce a further dip to or slightly below 4.0% yields in the coming months. However, the 10-2yr yield curve tends to steepen further, as a Fed Fund easing cycle gets to a mature stage. The current yield curve is also not steep by 1990’s standards (Figure 3) and we can see choppy 10yr yields edging back above 4.25% into H2 2026 (Figure 1) and 10-2yr yield curve steepening to 90-100bps. Given the size of funding requirement; long-term government debt trajectory and political reluctance to undertake fiscal consolidation, 2% 10yr real yields also feel right.
In terms of 2027, we see the Fed on hold and fighting any market expectations that a fine tune tightening could occur. This should cap 2yr and 10yr yields (Figure 1) and produce a choppy trading year, though with a small drift up in 2yr yields and yield curve flattening. The odds also remain of the Democrats gaining the House of Representatives, which will stop any further fiscal easing in 2027-28.
Figure 3: 10-2yr U.S. Treasury and Fed Funds Inverted (%)
Source: DataStream/Continuum Economics
Figure 4: 2026 Budget Deficit and QT to GDP (%)
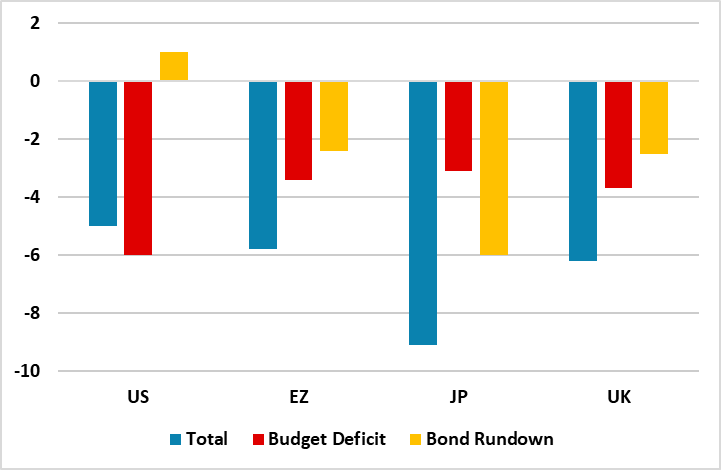
Source: IMF/Continuum Economics
In terms of alternative scenario, we have reduced the risk of a U.S. harder landing from 30% to 20% over the next 12 months (Figure 5), as incoming economic data is not showing a sharp slowdown. It is, however, still the main alternative scenario, as the effects of Trump trade tariffs still feed through. Meanwhile, if the Trump administration implements aggressive change at the Fed (low probability), then it could steepen the 10-2yr yield curve but is less clear in terms of the level of 10yr yields if the Fed extends the easing cycle below 3% (Figure 5).
Figure 5: 10yr U.S. Treasury Scenario Analysis
Source: Continuum Economics
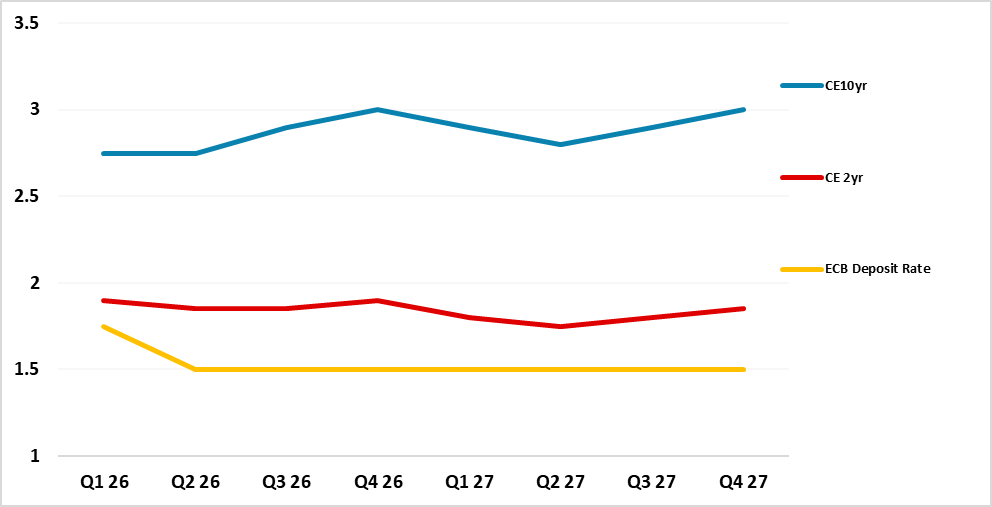
ce: Continuum EconomicsThe outlook for EZ rates in 2026 appears at first blush to be stable ECB policy rates (with no expectations of a further 25bps cut at some stage in 2026) and a gradual pick-up in German defense and infrastructure spending underpinning 10yr Bund yields. However, we feel that the ECB is underestimating the weak monetary transmission of the 2 ppt reduction in official rates. Lending intentions and loan rejection rates, alongside still elevated lending rates mean that financial conditions are tighter than suggested by a 2% ECB depo rate (here). One of the key reasons is that the ECB exit from ultra-easy monetary policy in 2021-22 is still feeding through with a long lag to mean maturing loans face higher rates. This means no pick-up in EZ growth rates in 2026 and more disinflation pressures. Overall, we see the hawks giving way to doves and delivering two further 25bps cuts in the ECB depo rate in H1 2026 to 1.5%. This likely means a further reduction in 2yr Bund yields in H1 2026 (Figure 6).
However, the market will then likely take the view that policy rates have finally bottomed, with some of the hawks likely to voice the view that any such 2026 cuts are insurance. Even so, the majority on the ECB will want to maximize the benefit of the monetary policy stance and ECB communications will likely fight ideas that late 2026 or 2027 could see policy rates moving back to around 2% neutral rates. As we have discussed before, neutral rates are a range (here) rather than a specific-point estimate and the ECB will need a 1.5% policy rate for some time to ensure appropriate overall financial conditions. This can limit the traditional swing of 2yr Bund yields to a positive spread over the ECB depo rate in H2 2026 to around 20-40bps, rather than the 60-140bps seen in 2003-05.
Figure 6: ECB Deposit Rate, 2 and 10yr Germany Forecasts (%)
Source: Continuum Economics
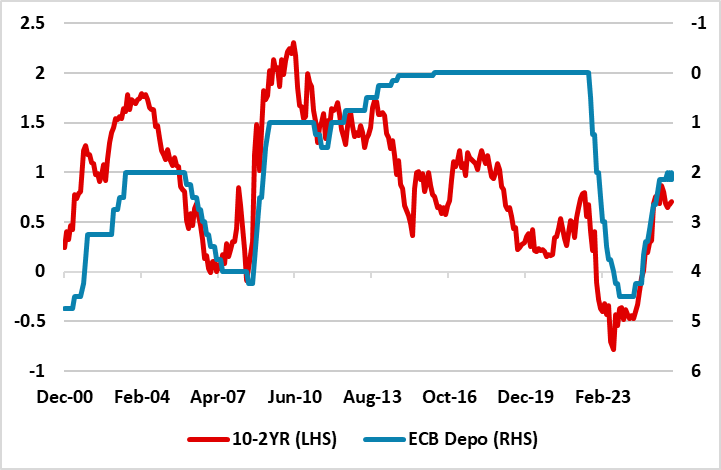
Our 10yr Bund yield forecast is for a modest increase in 10yr yields (Figure 1). The German budget deficit expansion will add to bond supply. Additionally, 10yr real Bund yields still remain low relative to the 1990-08 period and we feel that around 3.0% is more appropriate as a medium-term equilibrium. ECB QT also adds to the net bond issuance that the bond market has to digest. The 10-2yr yield curve can steepen to over 100bps, though this is not as steep as 2003-05 (Figure 7) but then into 2027 will likely flatten somewhat (Figure 6). 2yr yields in 2027 will likely become more worried that the ECB could normalise back to a 2% depo rate in 2028. Additionally, as part of the process of improve financial conditions, we also feel that the ECB will slow APP and PEPP QT in 2026, which will end yield curve steepening.
Figure 7: 10-2yr Germany to ECB Deposit Rate Inverted (%)
Source: Continuum Economics
The 2026 EZ rates forecasts are also influenced by the prospects for 2027. It is worth mentioning that 2027 could be overshadowed by French fiscal and political tensions that could turn into a crisis. The focus is on the May 2027 presidential elections, where the two stage process means that other major parties will likely rally around a candidate (as yet unclear who this will be) to stop a National Rally candidate winning. However, a new president will be faced with parliamentary deadlock and will therefore face a choice of waiting until 2029 when they are due to hold parliamentary elections or go earlier to try to break the deadlock and get a majority for fiscal consolidation. Current opinion polls suggest that the three way split in the electorate remains and this argues against a post presidential election shift towards a government that can undertake the necessary fiscal consolidation. Further credit agency downgrades and foreign selling on French government bonds will likely be the result alongside economic sluggishness (which may only exacerbate fiscal fragility). At a minimum, fiscal tension throughout 2027 and at worst a H2 2027 French fiscal crisis! This can cap 10yr Bund yields in 2027 and as early as Q4 2026. It could also mean a 100bps 10yr France-Germany spread.
This is also a dilemma for the ECB. The ECB would find it difficult to tighten in such circumstances in 2027, while disinflation forces could also occur from the expected jump in global LNG exports in Qatar/U.S. and the 2028 energy tariff rejig (here). ECB President Lagarde would also be reluctant to lead arguments for tightening given her term ends October 2027 and given the importance of France to the EZ. Worse if a French budget crisis occurs then the ECB could be under pressure to use the Transmission Protection Instrument (TPI), which would split the ECB with the hawks concerned that a French government could not guarantee the necessary fiscal consolidation. As a result, the ECB may be reluctant to be too openly critical of individual national budgetary policies as it would make use of the TPI all the more questionable! The 1st step for the ECB in the scenario of a French budget crisis would likely be a further slowdown in APP and PEPP QT. The one positive political point for the ECB in 2027 is that Italy’s PM Meloni will likely be reelected in October 2027 through with a rejigged coalition but still supporting fiscal consolidation.
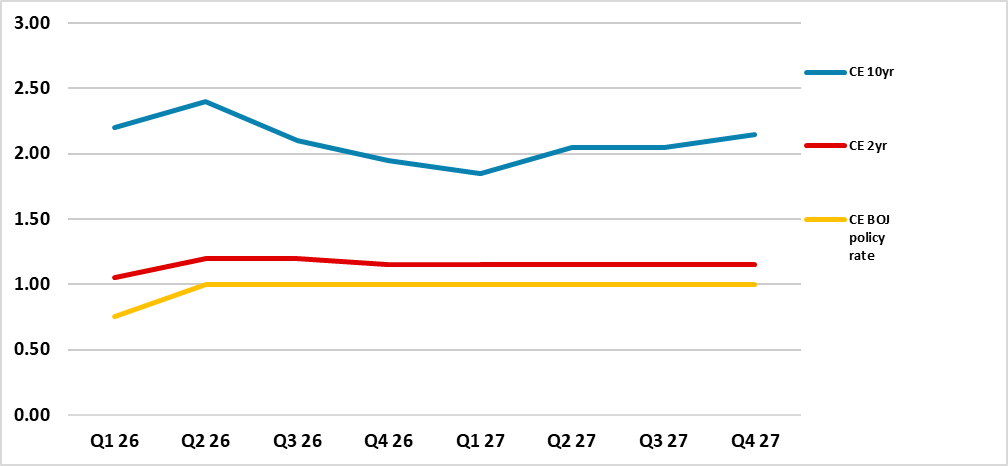
Figure 8: 10, 2yr JGB and BOJ Policy Rate Forecasts (%)
Source: Continuum Economics
In Japan, it is highly unlikely that Abenomics 2nd arrow of aggressive QE will be revisited. In fact the BOJ is the only major central bank that is still increasing the pace of QT, as it winds down bond buying operations into 2027 to mean less partial counterbalance to the end to rollover of maturing JGB’s. We estimate that BOJ QT will likely be close to 6% of GDP in 2026 (Figure 4), which leaves the JGB market facing the heaviest supply situation in the G4. This will likely produce renewed upward pressure on 10yr JGB yields and we still forecast that 10yr yields will push above 2% in early 2026 (Figure 8), due to this supply deluge. Indeed, the supply is so large that 10yr yields could spike to 2.5% and this will likely cause the BOJ to slow the pace of QT by raising the monthly pace of bond purchases rather than reducing it!
Meanwhile, we still feel that the BOJ will likely hike the policy rate further, given core and headline inflation both on current and 2026 BOJ forecasts. We see a 25bps hike at the December 19 BOJ meeting and then one further hike in H1 2026 to 1.0%. However, we feel that CPI will likely undershoot BOJ projections for 2026 inflation, as businesses face resistance from Japan’s households over higher CPI alongside a slowing of wage and unit labor cost growth in 2026 and then eventually CPI. This process would also hurt consumption and provide an extra reason for the BOJ to go on hold throughout 2027. Moreover, the government wants the BOJ to slow down on rate hikes and this could mean a pause to rate hikes at 1%.
Figure 9: 10, 2yr Gilts and BOE Bank Rate Forecasts (%)
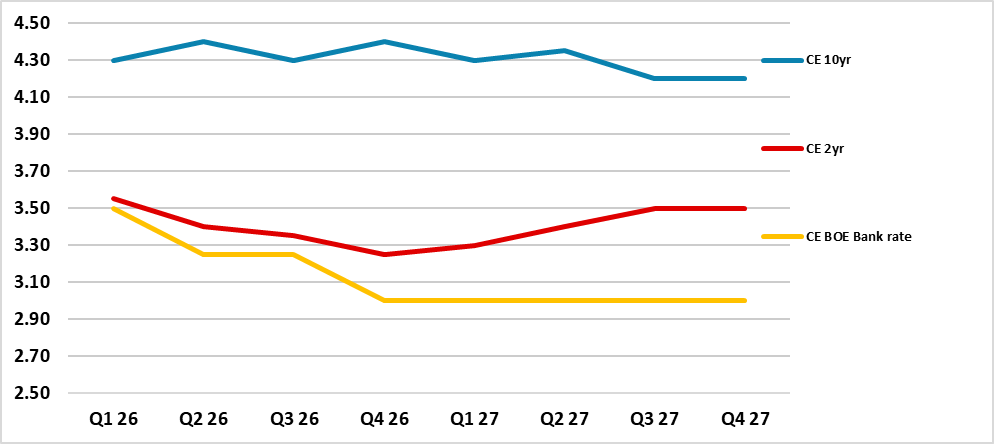
Source: Continuum Economics
In the UK, the main problem facing the Gilt market is supply, which is not just a function of the budget deficit trend. Supply facing the Gilt market is driven by three forces: government public sector borrowing (PSNB); financial and other transactions (PSNB v CGNCR ex Network Rail difference) and BOE QT. Though the government did not materially change the PSNB trajectory in the November budget (here), the other two supply drivers are still large. The CGNCR ex National Rail in the period 25-30 is on average £32 Bln higher than PSNB, largely reflecting sales and redemptions losses on the APF and net outlays on student loans (OBR Nov 2025 Table 6.5). Though BOE QT has slowed from £100bln pa to £70bln from September 2025 it is still over 2% of GDP! We look for a further slowing to around £50bln from September 2026 to avoid tight financial conditions too much – QT is restrictive. We think this will likely be followed in September 2027 by a move to stop active gilt sales i.e. QT around £30bln pa. The DMO is also looking at increasing T bill issuance, given it only 3% of debt compared to 20% for U.S. Treasuries. Thus the supply picture will likely get better in H2 2026 and into 2027, at least relative to that projected in Figure 4.
A UK fiscal crisis in 2027 is unlikely to be driven by supply pressures. However, politics is a swing factor for gilts in 2026 and 2027 ahead of a 2029 general election. A 2029 UK election outcome is too difficult to call at this juncture, as parties support can shift noticeably in the run-up to an election e.g. 1980-82 and 1990-92. However, if Labour does not see a poll recovery in 2026/2027 then pressure will grow to soften the fiscal rules. This could see intense leadership pressure on PM Starmer, but ultimately would be designed to replace Chancellor Reeves. This is an event risk for 2026/27 for the gilt market, though this would likely be a softening of the rules rather than a major fiscal easing (the 2022 Truss crisis haunts UK fiscal policy).
Finally, BOE policy matters for gilts. We feel that the UK labor market is weakening sufficiently (here) to increase confidence in the UK achieving 2% inflation. This will likely lead to a shift in MPC thinking and allow not only a 25bps cut in Dec 2025 but also two further cuts in H1 2026 down to 3.25%. Additionally, though MPC members have different views on where the neutral policy rate is (doves 2.5-3.0%, hawks 3.25-3.75%), we feel UK growth/inflation will be low enough to trigger the MPC majority to deliver a further 25bps cut to 3.0% after a pause by the BOE. We have penciled this in for Q4 2026 (Figure 9), though it could also come in H1 2027 – fyi a 50bps easing arrived in 2003, after the BOE had paused in 2002.
In terms of 2yr, our BOE easing view is more aggressive than the money and bond markets and this will likely lead to a decline in 2yr yields in 2026 (Figure 9). However, 2yr gilt yields will likely push to a positive premium versus the BOE policy rate, both as this traditionally occurs in a mature easing cycle and as a 3.0-3.25% policy rate would likely be seen by the majority of the market as neutral rates. At the end of the 1994, 1996, 1999 and 2001 easing cycles 2yr gilt yields pushed to 100bps over the BOE policy rate. A positive 25bps premium between 2yr and BOE policy rate would be more reasonable now in a steady policy environment, which is what we pencil in for H2 2026. However, fears of 2028 BOE tightening will likely be evident by H2 2027 and this can mean a wider spread between the 2yr and policy rate of 50bps.
Figure 10: 10-2yr and BOE Bank Rate Inverted (%)
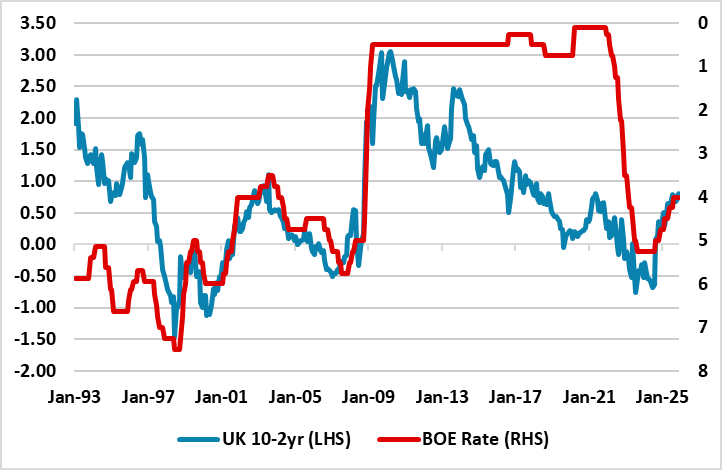
Source: Continuum Economics
10yr gilt yields face a choppy environment in 2026. While more BOE easing than market expectations can help sentiment at the long-end, the supply pressure will remain large before the September 2026 BOE QT decision. Additionally, the 10-2yr Gilt curve is shallow and most of the BOE easing will likely benefit the short-end more and we see the 10-2yr Gilt curve steepening to over 100bps in 2026. This yield curve steepening process should stop in 2027 and a marginal decline in 10yr yields could be seen, helped by further slowing of BOE QT and a sense that the UK can get inflation back sustainably to 2%. Even so, ongoing UK political flux and the concerns that internal Labour politics could mean a rework of the UK fiscal rules will likely mean that 10yr gilt yields find it difficult to fall below 4% consistently.