Markets 2025: A Tale of Two Halves
· For financial markets, 2025 will likely be a game of two halves. US exceptionalism will likely drive US equities to extend outperformance in H1, while the USD rises further as tariffs (threats and actual) escalate. However, 10yr U.S. Treasury yields will likely push higher in H2, which can hurt the U.S. equity market and the USD will likely lose ground in H2 on concerns about the U.S. economy medium term against a backdrop of an overvalued USD. Ex U.S. Equities will likely have a choppy 2025, but India and Brazil look good into 2026. Germany and UK government bond yields can decouple with no rise in 10yr yields, as the ECB and BOE keep easing.
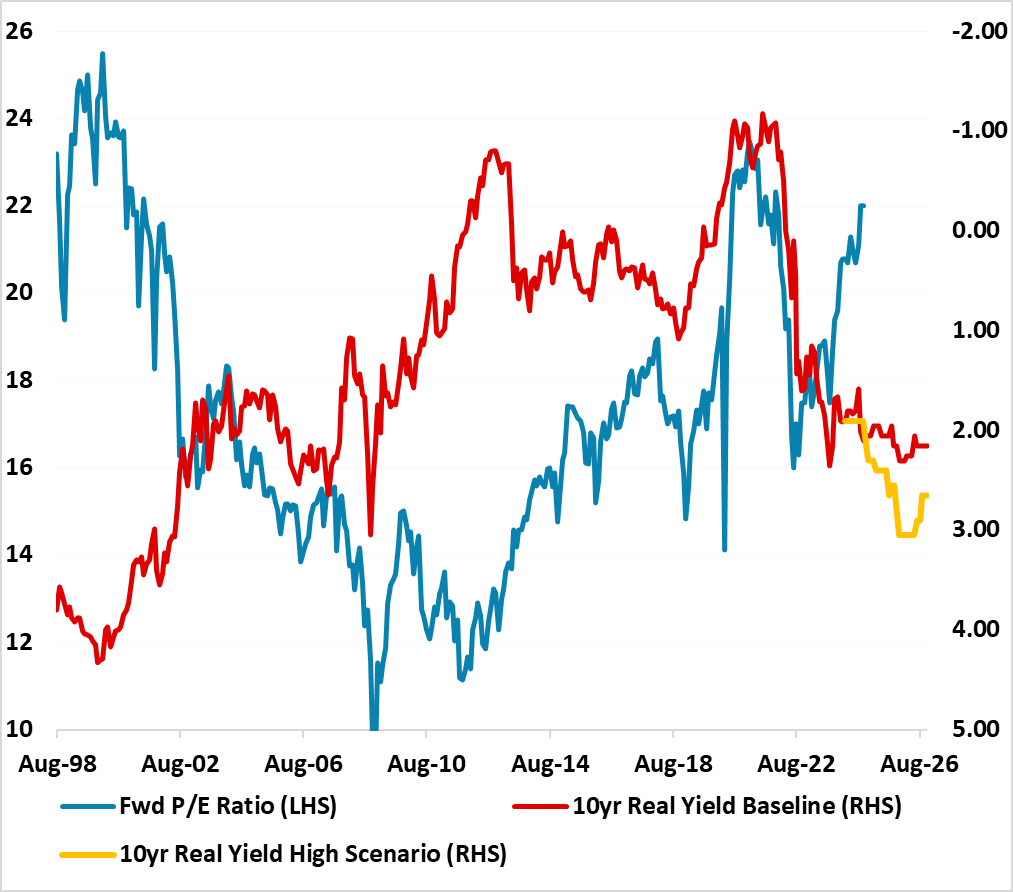
Figure 1: 12mth Fwd S&P500 P/E Ratio and 10yr U.S. Treasury Yield Inverted (Ratio and %)
Source: Continuum Economics with forecasts to end 2025
U.S. Equities have growth momentum, Fed easing, dominant tech and AI sectors, and an incoming Trump administration likely to deliver sizeable tax cuts in 2026 alongside deregulation. The glory days of exceptionalism for U.S. equities will likely extend in Q1 2025 to bring the S&P500 to 6200-6300. The problem is that valuations have now stretched with S&P500 ex magnificent 7 on a forward P/E of 19 and valuations out of line with real bond yields (Figure 1). This means that the good news must keep on coming to sustain the higher market levels, while bad news would leave the U.S. equity market vulnerable to a healthy correction. Bad news can come in the form of escalating trade wars that hurt U.S. and global growth expectations or inflation fears that lead to fears that the Fed could have to stop easing close to 4% or alternatively tighten in 2026. A 3rd alternative is that the economy slows down more than expected in 2025 to reawaken the hard v soft landing debate and hurts corporate earnings expectations – this is less threatening than the first two scenarios or higher inflation, as the market would assume the Fed eases to 2.5% or below.
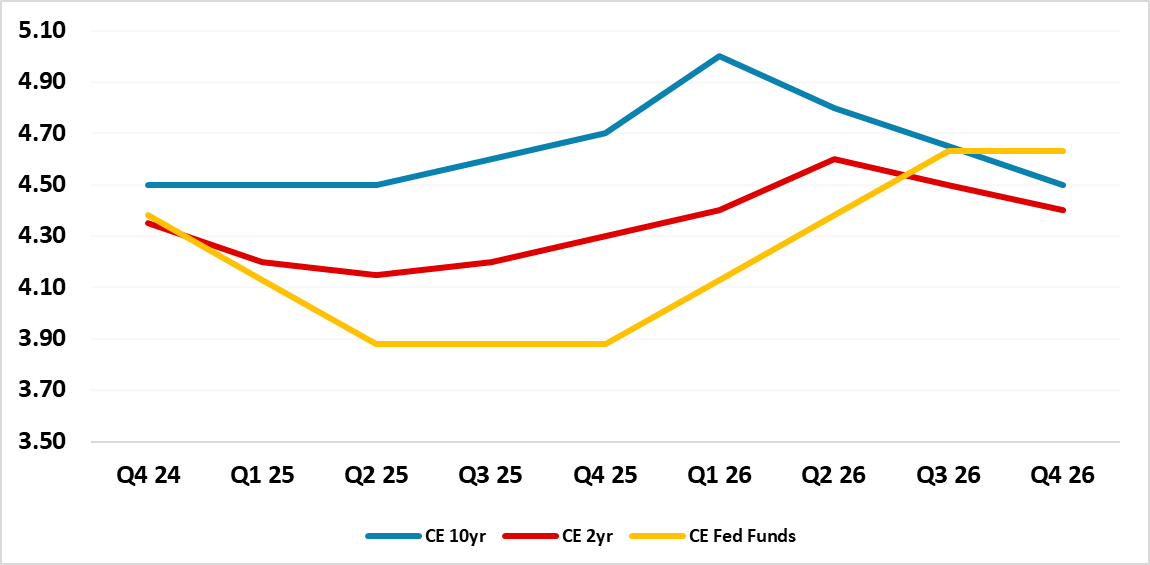
We feel that into Q2 2025 news will become less friendly for the U.S. equity market with an end to Fed easing by June 2025 and fears of 2026 tightening/huge budget deficit and bond supply lifting U.S. Treasury yields across the board (Figure 2). In turn this can stretch equity v bond yield valuation to breaking point (Figure 1). 2025 corporate earnings growth expectations at 15% are also too rich and this could mean a gradual derating process for forward P/E ratio occurring. Additionally, not all the Trump administration tariffs will quickly lead to trade or other concessions and this will reopen concerns about a stagflation hit to U.S. equities. We would see the S&P500 at 6000 for end 2025.
2026 is more threatening for the U.S. equity market, as huge funding pressures from an 8-9% of GDP budget deficit will still push 10yr Treasury yields higher. We also see 100bps of tightening from the Fed, see our U.S. Outlook here. Thus, we see the S&P500 at 5700 for end 2026. This is like 2022. If 10yr U.S. Treasury yields spike above 5% in 2025 then a deeper correction could be seen in H2 2025.
Figure 2: Fed Funds, 2 and 10yr U.S. Treasury Yields Forecasts (%)
Source: Continuum Economics
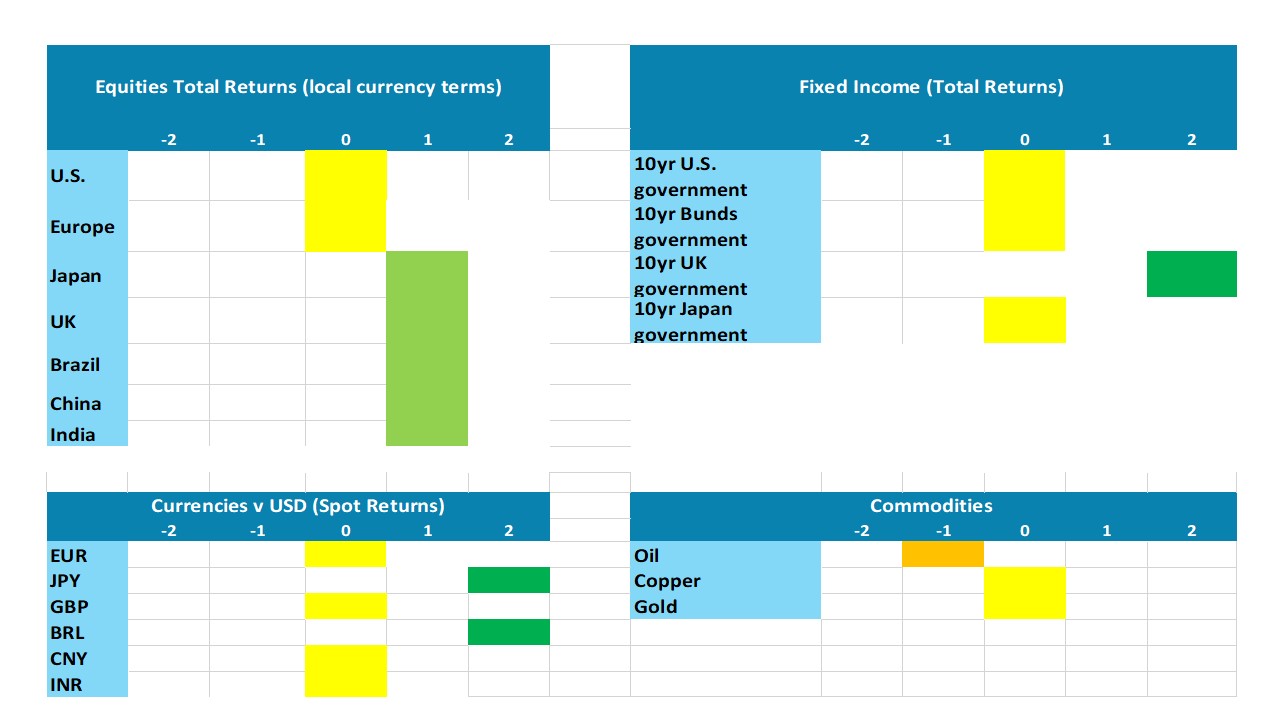
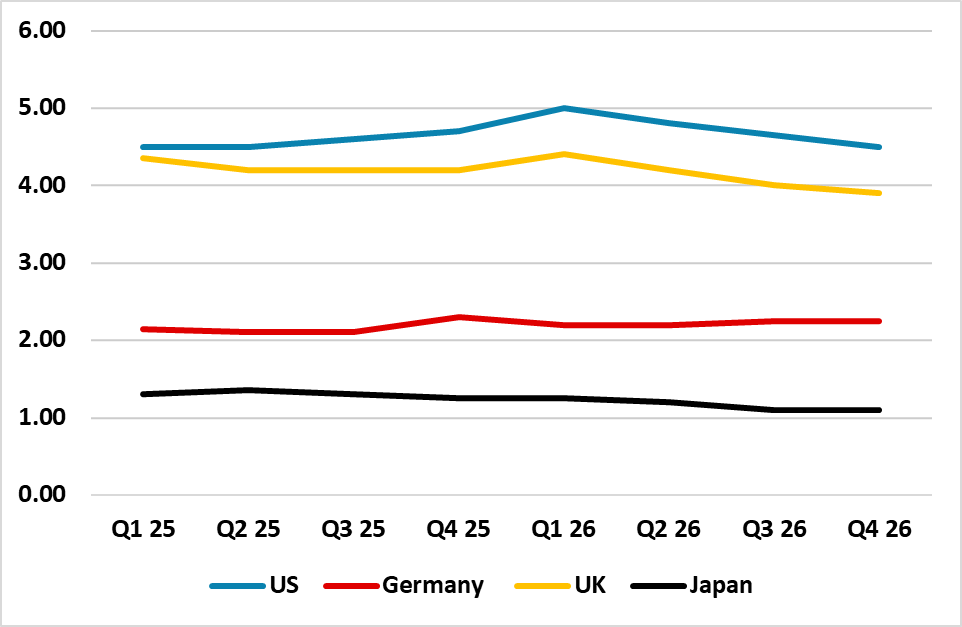
Outside the U.S., some scope exists for other equity markets to outperform the U.S. in 2025 (here), though this is likely to come in H2 2025 as U.S. equities underperform (Figure 3). This is selective, with EZ equities caught between the positives (ECB rate cuts, likely Ukraine war ceasefire and cheap valuations v bonds) and negatives (only slow recovery, French political vacuum, debt issues and likely select tariffs from the U.S.). Domestic UK equities can outperform the U.S., as we forecast a decline in bond yields (Figure 4) with 125bps of BOE cuts (here) and Japan equities also helped by a structural corporate reform and BOJ rate hikes stopping at +0.5% -- see Japan Outlook (here).
In EM, we see 30% tariffs being introduced against China by the Trump administration versus the current 20% average, which will likely sour China equity sentiment in H1 and produce a Yuan depreciation to around 7.65 on USDCNY. In turn, this can hurt sentiment towards EM assets in H1 (here). However, H2 will likely see divergence across EM, as Latam currencies rebound from already low levels. Additionally, Brazil fiscal fears appear overblown (here) and Mexico will likely work with President elect Trump on immigration and a revised USMCA trade deal. The Yuan should also see a partial recovery with a U.S./China revised trade deal in H2 2025, which should help wider EM sentiment.
India, Indonesia and to a degree S Africa will likely attract FDI and equity flows. We see Brazil and India equities outperforming the U.S. late 2025 and through 2026, with Brazil helped by a switch to an easing cycle and India by continued healthy long-term corporate earnings momentum and less overstretched valuations (here).
In terms of total FX returns for 2025, the Brazilian Real (BRL) and Mexican Peso (MXN) should be the standouts, given the wide interest rate differentials versus the U.S. Asia total returns will be more difficult given interest rate spreads versus the U.S. and we see only a partial EM Asia currency rebound in H2 2025. EM Europe is divergent, as the TRY will still be falling on a spot basis but at a slower pace than the interest rate differentials against the USD (here).
Figure 3: Asset Allocation for the Next 12 Months
Source: Continuum Economics Note: Asset views in absolute total returns from levels on December 19 2024 (e.g., 0 = -5 to +5%, +1 = 5-10%, +2 = 10% plus).
Figure 4: 10yr U.S./Germany/UK/Japan Government Bond Yields Forecasts (%)
Source: Continuum Economics
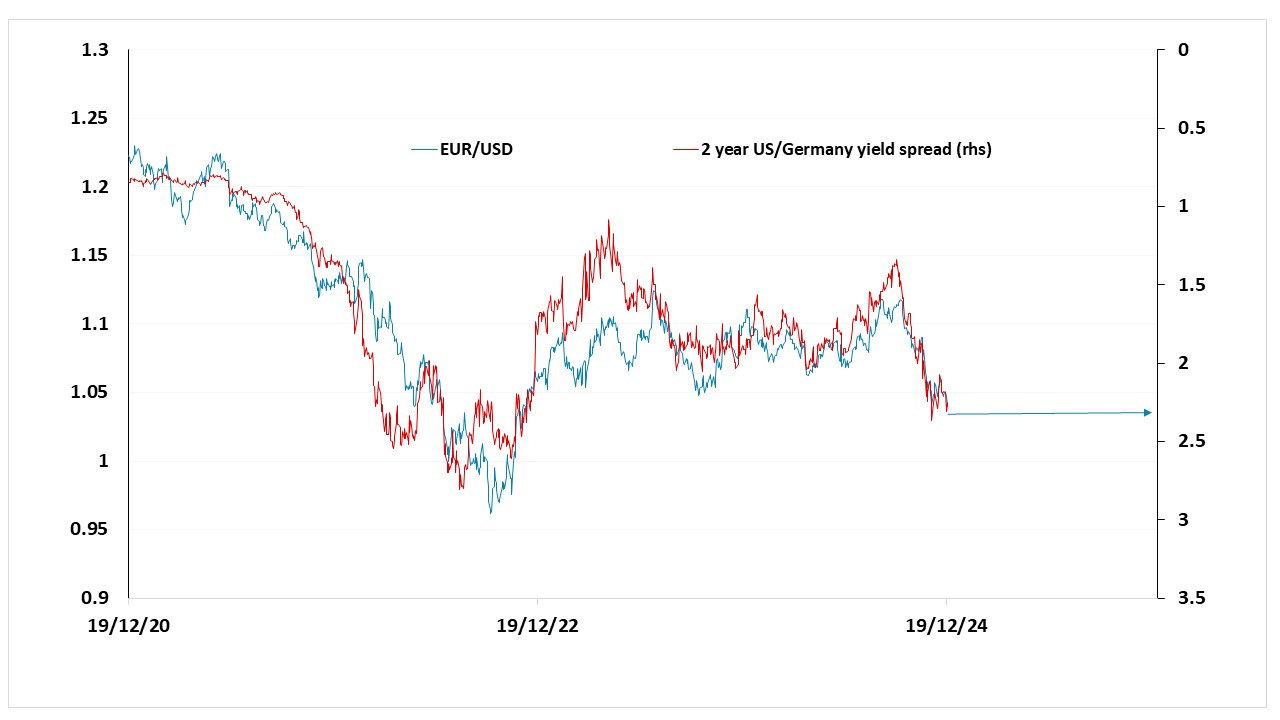
EUR/USD has stuck close to the 2-year yield spread, but
While there has sometimes been some impact from equity market correlations, EUR/USD has generally correlated very strongly with movements in the 2-year US/Germany yield spread in recent years (Figure 5). We expect this to remain broadly stable over the coming year, suggesting there is also likely to be little movement in EUR/USD. Nevertheless, we slightly favor the EUR upside in H2 2025 because of its initial low valuation and the fact that the market is already pricing aggressive ECB easing and much less aggressive Fed easing.
Of course, we may see the market break away from the yield spread correlation. After the first Trump election win in 2016, we saw a period of USD strength related to expectations of easier fiscal policy, but the USD declined through much of 2017 and early 2018 even though yield spreads moved strongly in the USD’s favor from mid-2017. Part of this reflected concern that Trump was not able to deliver on his pro-growth policies due to opposition in Congress, while more straightforwardly Trump’s preference for a weaker USD also contributed to USD weakness. Our DMFX Outlook is (here).
Figure 5: EUR/USD and the 2-year US/Germany yield spread
Source: Datastream, CE
