DM Rates Outlook: Policy and Spread Divergence
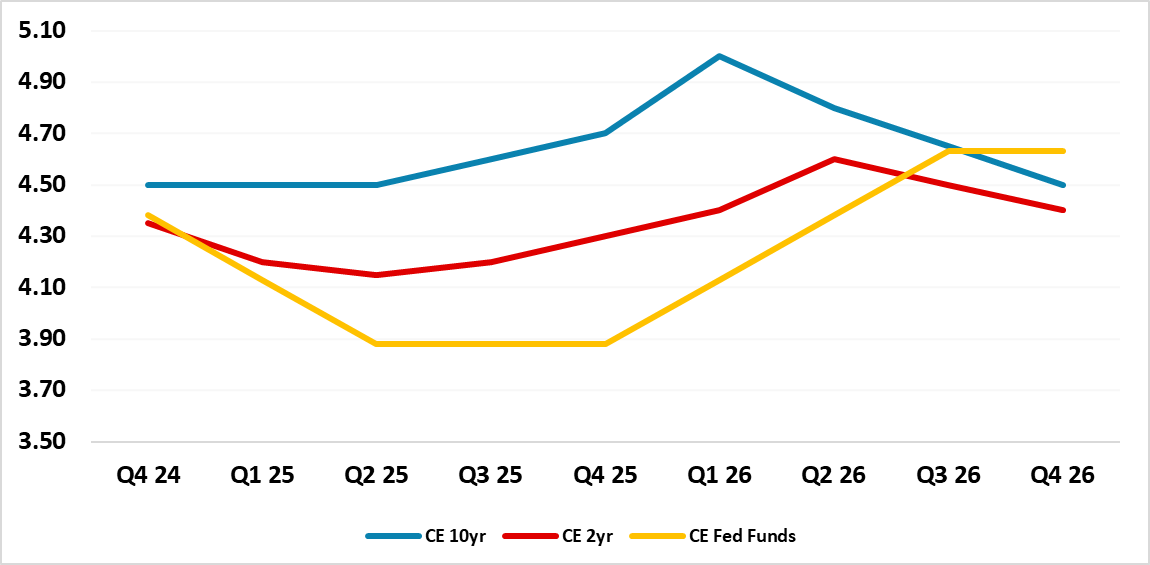
• 2yr U.S. Treasury yields can decline initially as the Fed finishes easing (Figure 1), but as the sense grows that the rate cut cycle is stopping, we see the 2yr swinging to a small premium versus the Fed Funds rate – as the market debates the risks of a future tightening cycle. For 10yr yields, we see consolidation H1 followed by consistently rising yields in H2 2025 and H1 2026 to 5%, as the Trump administration enacts aggressive tax cuts and this produces a surge in issuance due to an 8-9% of GDP budget deficit. H1 2025 yield curve steepening, followed by 2026 yield curve flattening.
• Consistent ECB policy easing can help German yields to decouple from the U.S. and fall marginally in H1 2025. However, 10yr real yields are low and the ECB will likely face a small rather than large inflation undershoots, which will make a large decline below 2% yields unlikely. France’s wide budget deficit may not be fixed by the parliamentary election in July 2025 and this will likely see the 10yr spread rising above 100bps. An investor crisis could see a spike to 150bps, before the ECB triggers TPI to calm spreads.
• Elsewhere, BOJ interest rate normalization will likely be modest in H1 2025, as inflation remains sufficiently elevated for the BOJ to further reduce the degree of accommodation. We see a 10bps and 15bps hikes in H1 2025 to bring the BOJ policy rate to 0.5%, which will help lift 2yr yields and 10yr yields across the curve. Then BOJ will pause and not hike further, which can see yields drift down in 2026.
Risks to our views: 10yr U.S. yields could rise less if the Trump administration tax package largely consists of the renewal of the lapsing 2017 tax cuts to keep the budget deficit around 6% of GDP and tariff increases are modest and quickly lead to trade concessions. A 2026 modest 50bps Fed rate cuts are also in this scenario rather than 2026 tightening. This could see 10yr yields fall marginally below 4% by end 2025. The other alternative is that 8-9% budget deficits cause investors to demand higher 10yr real yields than in our baseline that helps to push 10yr yields to 5.50-5.75%
Figure 1: Fed Funds, 2 and 10yr U.S. Treasury Yields Forecasts (%)
Source: Continuum Economics
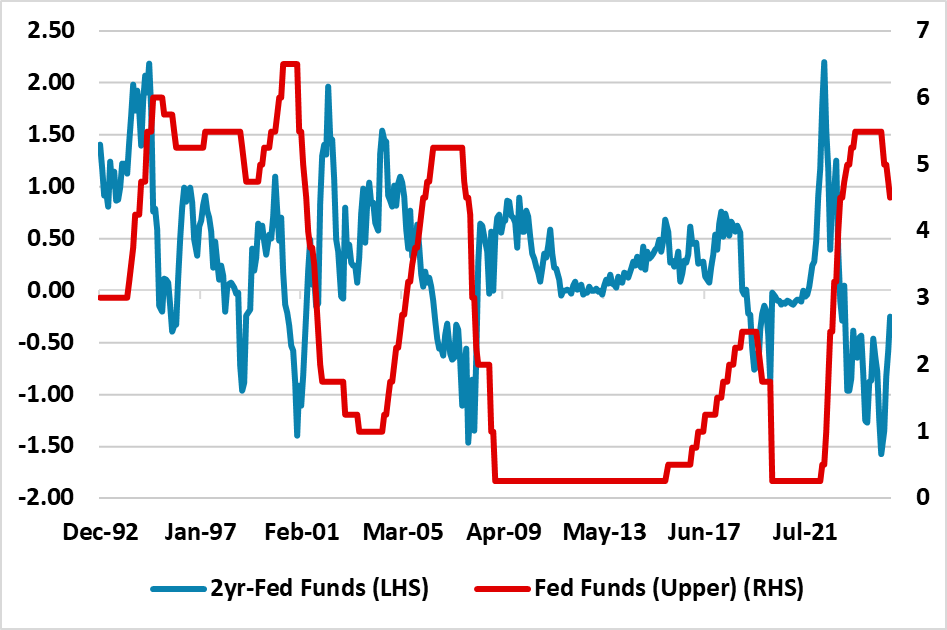
The December FOMC meeting leaves the impression that the pace of Fed easing will now slow and that the terminal (not the neutral rate) will likely be higher than previously thought in the early autumn. Our view is for two quarterly 25bps cuts to a 3.75-4.00% Fed Funds (here). This can allow 2yr U.S. Treasury yields to marginally decline (Figure 1), but as the sense grows that the rate cut cycle is stopping, we see 2yr yields swinging to a small premium versus the Fed Funds rate. This is a consistent pattern at a mature stage of previous easing cycles (Figure 2), as the market shifts to wondering whether the next cycle could be tightening or a pause and more easing. Our view is that the underlying momentum of the economy means that tax cuts and tariffs (most likely against China in H1 2025, but less certain in timing and magnitude for other countries) will push up inflation into 2026 and cause the Fed to tighten moderately by 75bps in 2026. 2yr yields will start to rise consistently through 2026 to reflect this tightening (Figure 1), though by late 2026 we feel that speculation will be turning to a 2027 easing cycle!
Figure 2: Fed Funds Rate and 2yr-Fed Funds Spread (%)
Source: DataStream/Continuum Economics
For 10yr U.S. Treasury yields, we are most concerned about aggressive tax cuts that will likely boost the budget deficit to 8-9% of GDP in 2026 and require very heavy issuance from the U.S. Treasury. This will require yield concession and in H2 can start to push 10yr yields consistently higher and peak upward pressure will likely come in H1 2026 (Figure 1). Fed tightening in H1 2026 could also initially put upward pressure on 10yr yields, but then the moderate scale of tightening; the Fed’s willingness to push against inflation and high nominal and real yields will likely be enough to produce a yield peak and then a modest decline in 10yr yields in H2 2026.
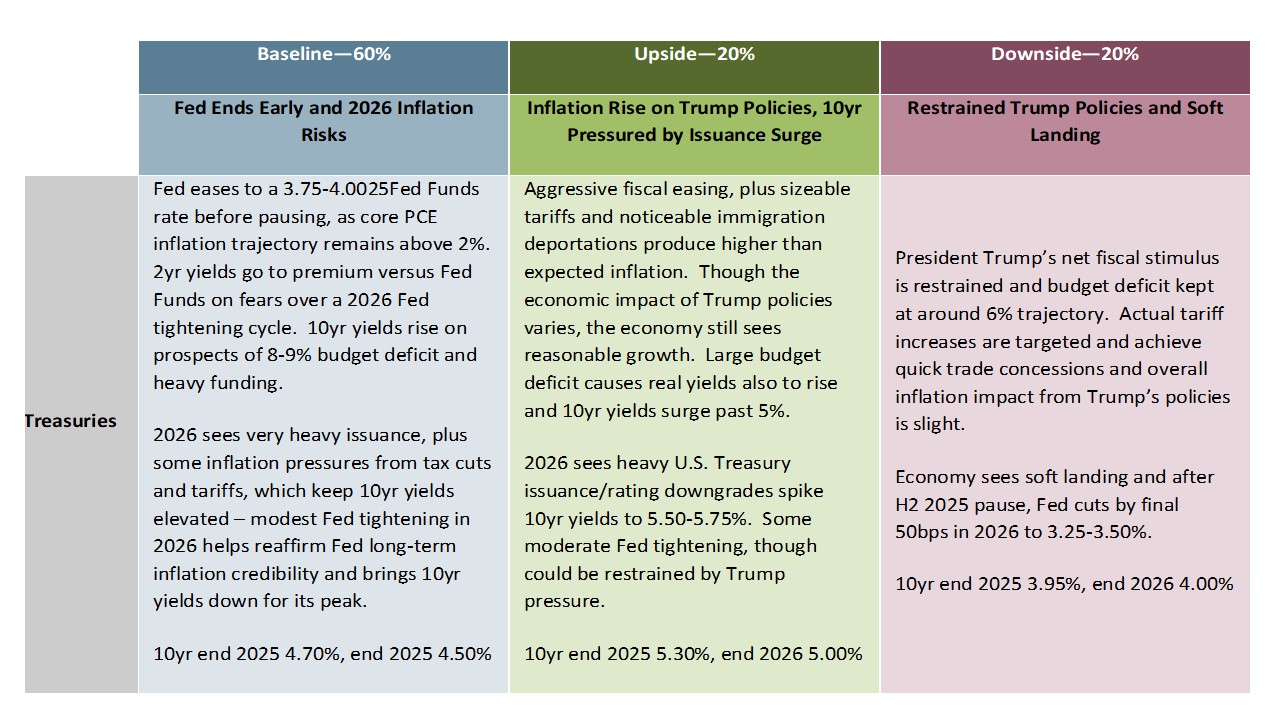
The alternative scenarios in Figure 3 are symmetric. 10yr U.S. yields could rise less if the Trump administration tax package largely consists of the renewal of the lapsing 2017 tax cuts to keep the budget deficit around 6% of GDP and tariff increases are modest and quickly lead to trade concessions. Modest 50bps Fed rate cuts are also in this scenario rather than 2026 tightening. This could see 10yr yields fall marginally below 4% by end 2025. The other alternative is that 8-9% budget deficits cause investors to demand higher 10yr real yields than in our baseline that helps to push 10yr yields to 5.30% by end 2025. This scenario could also see higher than expected inflation if tariffs and deportations are aggressive.
Figure 3: 10yr U.S. Treasury Scenario Analysis
Source: Continuum Economics
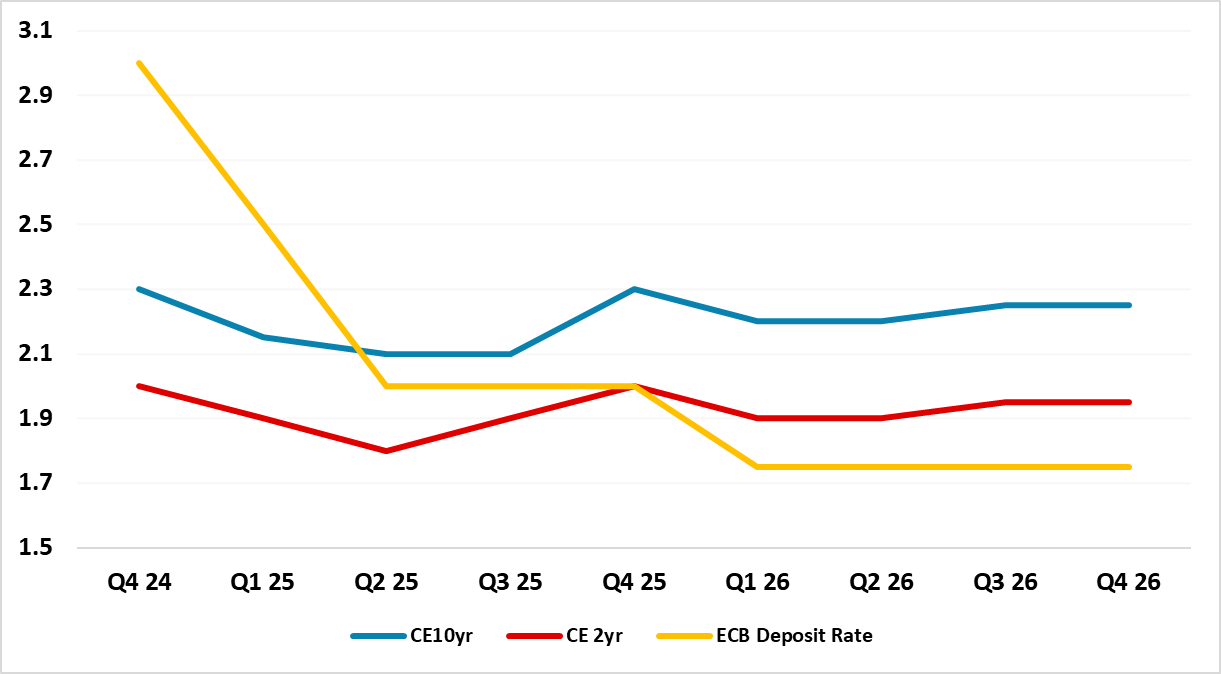
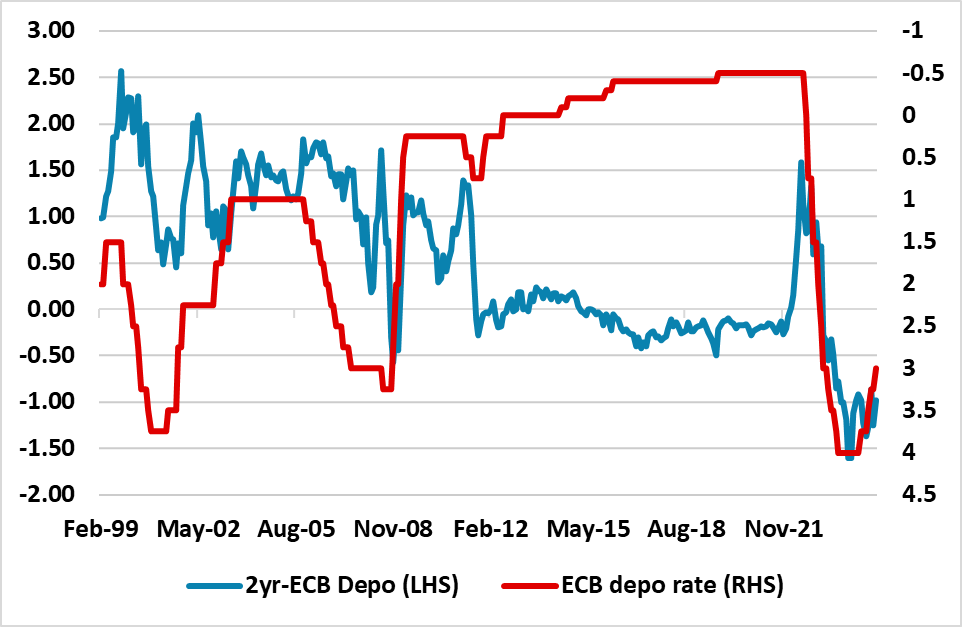
ECB policy easing will be consistent in H1 after the 25bps cut in December (here) and reaffirm the idea that easing will go to a 2% ECB policy rate or just below. However, the ECB is reluctant to provide clear guidance on the terminal policy rate in this cycle, with ECB Lane and Schnabel also differing on what is the neutral policy. The ECB hawks will also likely slow or pause the easing process as the ECB deposit rate gets to 2%. 2yr German yields can still fall further below 2%, as a trade war with the U.S. is highly likely and French budget woes will not be fixed (here) and this can raise concerns about a stalled EZ economic recovery or double dip into stagnation. However, the lack of ECB consensus to go substantially below 2% on the depo rate suggests that 2yr yields will likely end 2025 at 2.00% (Figure 4). It is also noticeable that at the end of 2001-03 easing cycle that 2yr Germany moved to a yield premium versus the ECB depo rate (Figure 5), as the market accepted that the easing cycle was mature and that policy stance would become more symmetric rather than policy easing.
Figure 4: ECB Deposit Rate, 2 and 10yr Germany Forecasts (%)
Source: Continuum Economics
Figure 5: 2yr Germany to ECB Deposit Rate (%)
Source: Continuum Economics
10yr Bund yields can fall below 2% on a temporary basis, especially if France’s budget deficit crisis pushes the spread consistently through 100bps. Nevertheless, a small real yield is still required, given yields in other major markets – a relaxation in German debt brake is likely after the February election, but is likely to be modest and not really impact Bunds. Thus we see 10yr German yields at 2.30% end 2025, due to the spillover of higher U.S. yields.
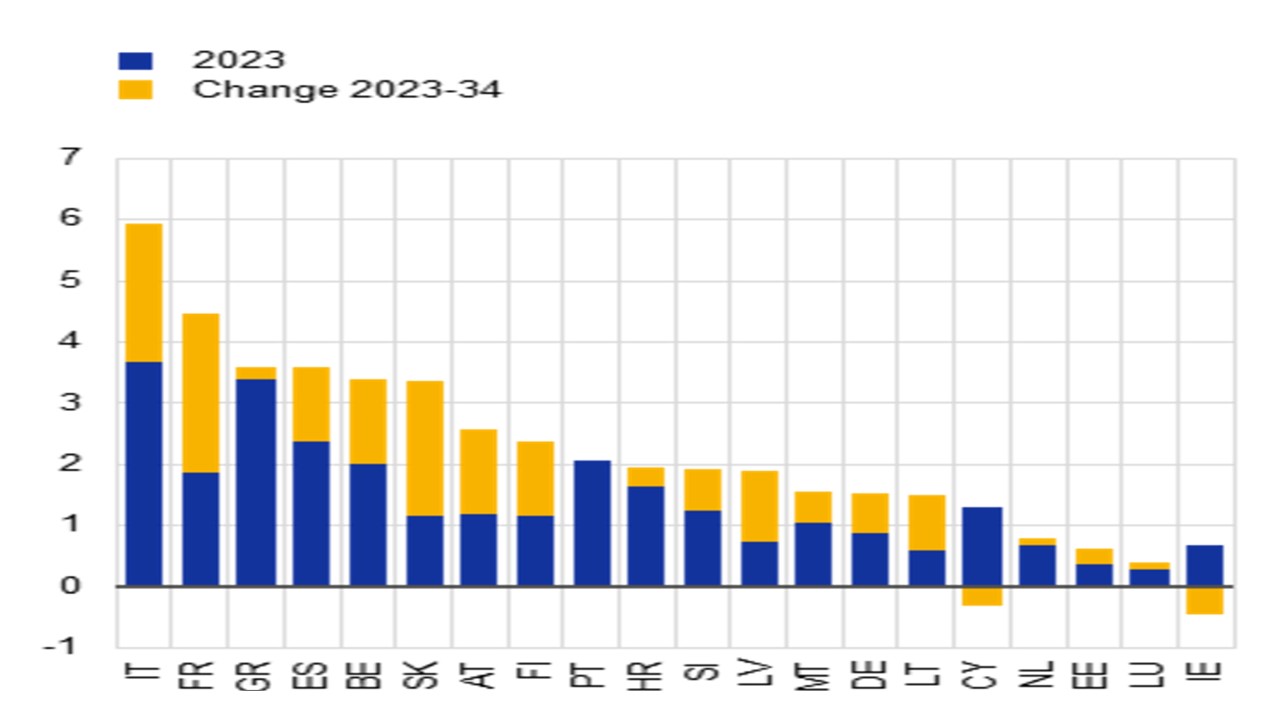
We are concerned that the French political crisis will not be resolved quickly and it is uncertain whether a H2 2025 parliamentary election would produce a government that could introduce sizeable fiscal consolidation. This leaves France with large budget deficits/heavy issuance, but non-residents still holding a huge 52% of national debt and reluctant to add to existing holdings. The long-term trend for France is also getting ugly, with the ECB warning that interest payments are set to increase steadily to over 4% (Figure 6). Rating agency downgrades are also a risk and the 10yr spread is destined to move above 100bps and in a crisis could spike to 150bps. Though France would not meet the strict conditions for ECB TPI, we do feel that the ECB would likely buy French government bonds if a spike occurs to 150bps to help the French and EZ monetary transmission mechanism. Political pressure would also be high on the ECB to act, given that Trump tariffs threats on the EU are highly likely in H1 2025 and the U.S. scaling back support for Ukraine. The ECB could also consider a temporary pause to APP or PEPP QT in a crisis.
Italy’s primary budget deficit trajectory looks better than France, while the market still likes the Meloni government. However, rising French yields would likely push Italian yields up somewhat as well and the 10yr BTP-Bund spread will likely move to 140 in 2025 on our baseline of 110-110bps for France 10yr spread versus Bunds.
Figure 6: Projected Interest Payments on Government Debt 2023-34 (% of GDP)
Source: ECB Financial Stability Report Nov 2024
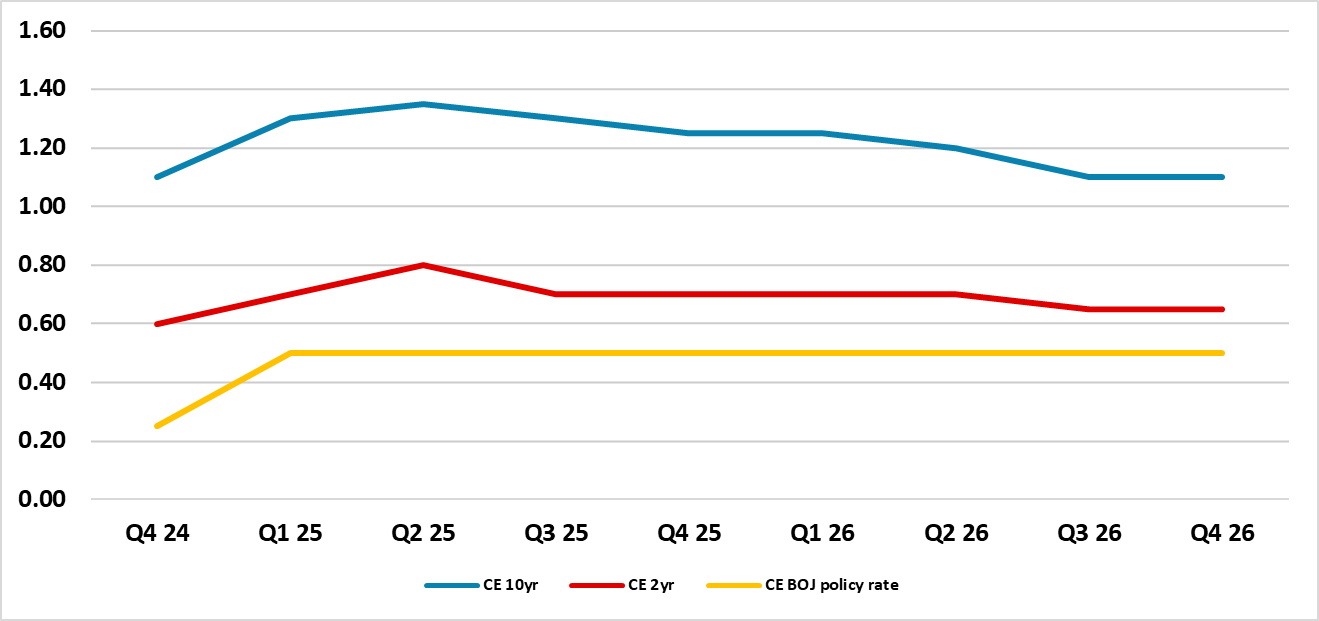
BOJ interest rate normalization will likely be sustained in H1 2025, as inflation remains sufficiently elevated for the BOJ to further reduce the degree of accommodation. We see a 10bps and 15bps hikes in H1 2025 to bring the BOJ policy rate to 0.5%, which will help lift 2yr yields and 10yr yields across the curve (Figure 7). 10yr yields are also now at a noticeable discount to 20yr yields. However, Japanese consumers are reluctant to fully accept higher inflation, which risks a slowdown on consumption and the economy and makes it more difficult for 2025 wage inflation to be higher than 2024. Multi-year, we see inflation slipping back to 1% and GDP growth to 0.75-1% and this long-term backdrop argues for an end to policy normalization at 0.5% and no BOJ QT. This can see 10yr yields declining modestly in 2026, as this peak becomes ingrained.
Figure 7: 2, 10yr JGB and BOJ Policy Rate Forecasts (%)
Source: Continuum Economics
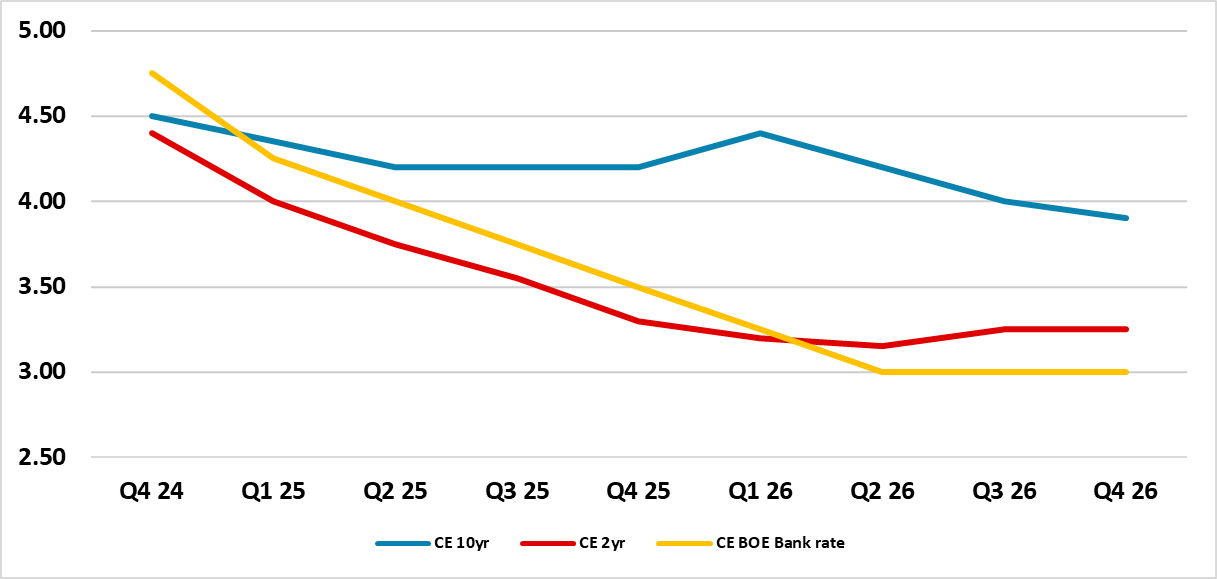
The BOE are too upbeat on economic momentum into 2025 and inflation pressures. As lagged monetary policy tightening comes through to restrain the recovery it will likely mean that the BOE become more activist in 2025 rate cuts, though some of the hawks will still fight the pace of easing. This can see a cumulative 125bps of BOE rate cuts in 2025, which can allow a consistent decline in 2yr yields (Figure 8). 10yr Gilt yields face a tug of war between high U.S. Treasury yields (above) and BOE policy rate going below the Fed Funds rate. In 2018, the 10yr Gilt yield went to a 175bps discount versus 10yr U.S. Treasuries when we had a clear divergence in monetary policy (here). Additionally, UK fiscal policy consolidation is credible, while the U.S. is heading for 8-9% budget deficits. This can see 10yr gilt yields going to a clear discount versus 10yr Treasuries in 2025-26, with gilt yields steady in 2025 and U.S. yields rising and in 2026 10yr gilt yields falling on further BOE easing when the Fed is tightening (Figure 8). However, the BOE is undertaking QT and only likely to slow moderately in September 2025 and thus we would see a maximum discount of around 60-70bps in 2026 versus 10yr U.S. Treasuries.
Figure 8: BOE Bank Rate, 2 and 10yr UK Forecasts (%)
Source: Continuum Economics