U.S. Asset Inflows After April’s Trump Tariffs
· Net foreign portfolio inflows have not been hurt by Trump’s April tariff drama, with the AI and tech boom attracting new equity inflows. Flows could become more volatile with a U.S. equity bear market or recession, but these are modest risk alternative scenarios rather than high risk. The USD has declined in 2025 however due to the huge size of the current account deficit, though the USD decline should be modest in 2026.
Figure 1: Net Flows Into U.S. for 12mth to Sep 2025 (USD Blns)
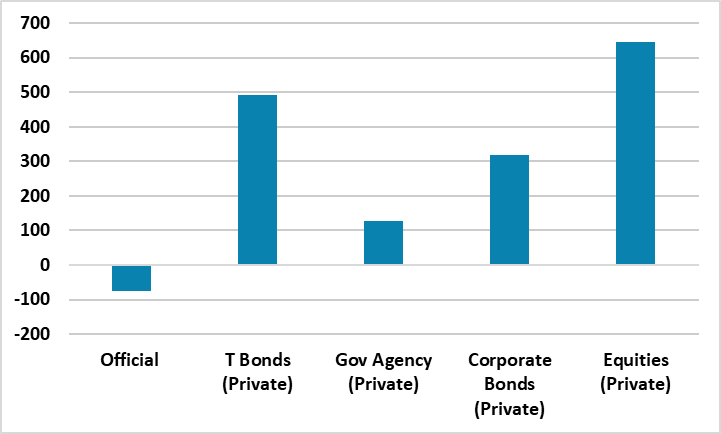
Source: BEA/Continuum Economics.
The combined August and September U.S. Treasury TICS data shows that private sector net inflows continue at a strong pace over the two months (though with the normal caveat with the TICS data and country of origin). Equities net inflow from foreigners totaled USD207.7bln. Over the last 12 months (Figure 1), private foreign buying on U.S. equities has been strong, with private sector U.S. Treasuries also seeing healthy net inflows. The details from end March to end September suggests that foreign investors have not become more adverse to U.S. assets after Trump high stake April tariff drama. U.S. equities are being helped by the AI/tech boom and elsewhere the solid long-term corporate earnings story. U.S. Treasuries private sector inflows likely reflect the 2% real yield across the curve in the U.S. going into 2025 and anticipation of more Fed easing. Though official net outflows were USD74.9bln (mainly Treasuries and Agencies), this is small in comparison to the total private sector net inflows from foreigners. China sold USD50.7bln of U.S. Treasuries March to September 2025 as their reserve diversification continues.
U.S. investors have also not decided to dramatically increase purchases of foreign assets. Though the 12mth total of foreign equities at USD139.7bln is up on the same period to Sep 2024, foreign bond buying slowed over the last 12 months to Sep 25 to USD180.9bln.
This occurred in the face of April Trump trade policy uncertainty and suggests that global investors are reluctant to slow or stop inflows unless major bad news is seen. This is especially for the equity market, as foreign holdings of U.S. equities totaled USD21.3trn in Sep 2025 versus USD7.8trn for U.S. Treasuries. Major bad news could be a hard landing for the U.S., but we have recently decreased the probability of this scenario to 20% in the next 12 months. Alternatively, a major adverse AI event or the Trump administration to significantly tight AI regulation. However, these are tail risk scenario. The Supreme Court rejecting Trump’s reciprocal tariffs is high probability (here), but likely moderate bad news as the Trump administration would likely use other tariff options and also try to codify existing agreed framework deals quickly.
While we do see a correction in U.S. equities and a flat performance through end 2026 (here), but this is unlikely to be a big hit to new foreign investor inflows. If Trump dramatically undermines Fed credibility and raises long-term inflation expectations with changes to the Fed, then this could slow U.S. Treasury net inflows. However, Trump has been distracted in recent months and also his approval rating has declined due to a sense among voters that the administration is not dealing with the cost of living crisis. We will get a new Fed chair and Washington based governor in 2026, but this is unlikely to dramatically change policy decision or key targets like core PCE at 2%.
The healthy inflows have not resulted in a higher USD in 2025 however. The U.S. current account deficit is likely to be around USD1200bln in 2025, while net foreign and U.S. security flows have been USD1190bln in the 12mth to September 2025 according to the TICS data. Anecdotal reports have also suggested that foreign investors in U.S. securities have also been more active in hedging U.S. bond and equity risk in 2025 than 2024, which has been a factor weakening the USD. The October IMF GSFR (Figure 2) noted that Optimal Volatility Minimizing FX Hedge Ratio had increased.
Figure 2: Optimal Volatility Minimizing FX Hedge Ratio (%)

Source: IMF GFSR October 2025
Foreign investors are likely to have focused on the high value of the USD more, after April Trump related drama and this could have prompted more FX hedging. For 2026, the USD still remains overvalued on a real effective exchange rate basis (Figure 3). We look for a modest USD decline against most DM currencies in 2026, as we do not currently see a major adverse event hitting the U.S. Even so, we still see USDJPY going to 140 by end 2026 (here). If a bear market were to occur in U.S. equities it could mean more of a USD decline than our baseline, both as U.S. equities inflows from foreigners would slow and the market would pencil in sub 3% Fed Funds rate.
Figure 3: USD Real Effective Exchange Rate (%)
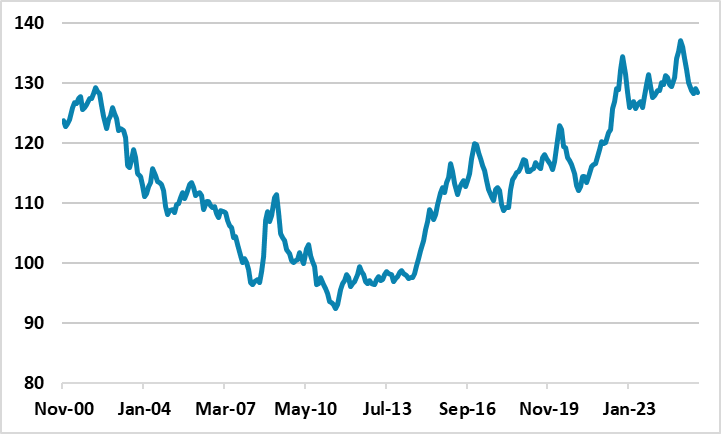
Source: Datastream/Continuum Economics
I,Mike Gallagher, the Director of Research declare that the views expressed herein are mine and are clear, fair and not misleading at the time of publication. They have not been influenced by any relationship, either a personal relationship of mine or a relationship of the firm, to any entity described or referred to herein nor to any client of Continuum Economics nor has any inducement been received in relation to those views. I further declare that in the preparation and publication of this report I have at all times followed all relevant Continuum Economics compliance protocols including those reasonably seeking to prevent the receipt or misuse of material non-public information.