DM Rates Outlook: Mixed Policy Rate and Yield Paths
· The multi quarter outlook for DM rates depends on the length of the Iran war Our baseline is that it will be a 4-8 week war (here) and a 3-4 quarter retracement of oil prices back to pre-war levels – longer from Europe and Asian gas prices. We forecast WTI down to USD80-85 by June; USD65-70 end 2026 and USD60 by Q3 2027. For the U.S., slowing consumption will then likely help deliver a Q3 25bps cut from the Fed and a Q4 move and lower 2yr yields, though 2yr yields will move to a positive spread versus Fed Funds as occurs at the late stage of a Fed easing cycle. With choppy 10yr yields, this can see one last yield curve steepening phase, before slow yield curve flattening in 2027.
· For Bunds, we feel that fears of tightening will be enough to hurt growth and add to existing core disinflation and this will stop the ECB from actual tightening. Indeed, by late 2026 a soft economic recovery will see 2027 inflation prospects below target and prompt a final 25bps ECB cut to 1.75%. This can produce some final yield curve steepening, as supply pressures keep 10yr Bund yields close to 3.0%. However, 2027 will likely see yield curve steepening finished, as the market focuses on ECB tightening risks into 2028.
· For 10yr JGB yields, the BOJ is the only major central bank that is still increasing the pace of QT, and we estimate that BOJ QT will likely be close to 6% of GDP in 2026. This will likely produce renewed upward yield pressure for longer maturities and we still forecast that 10yr yields could spike to 2.5% and this will likely cause the BOJ to slow the pace of QT. 1st step could come in June 2026, when the BOJ will likely slow or stop the shrinkage on monthly bond buying. This can slow the rise in 10yr yields, but only an increase in bond buying is likely to bring 10yr yields back down to the 2.00-2.25% area. 2YR yields should stabilize, as the BOJ hikes to 1.0% in Q2 2026 and then goes on hold.
Risks to our views: The Iran war lasts 2-6 months and keeps oil and gas prices very elevated, which boosts headline inflation and threatens some 2nd round effects. This would likely stop the Fed from easing further initially. However, if the shock caused a recession, then the Fed would likely cut policy rates to 2% or lower, which would see 2yr yields drop but sharp yield curve steepening. For the ECB, a long war and very elevated energy prices could cause around a 50bps tightening, but very weak growth and core disinflation then causes around 75bps of easing in 2027.
Figure 1: Fed Funds, 2, 10 and 30yr U.S. Treasury Yields Forecasts (%)
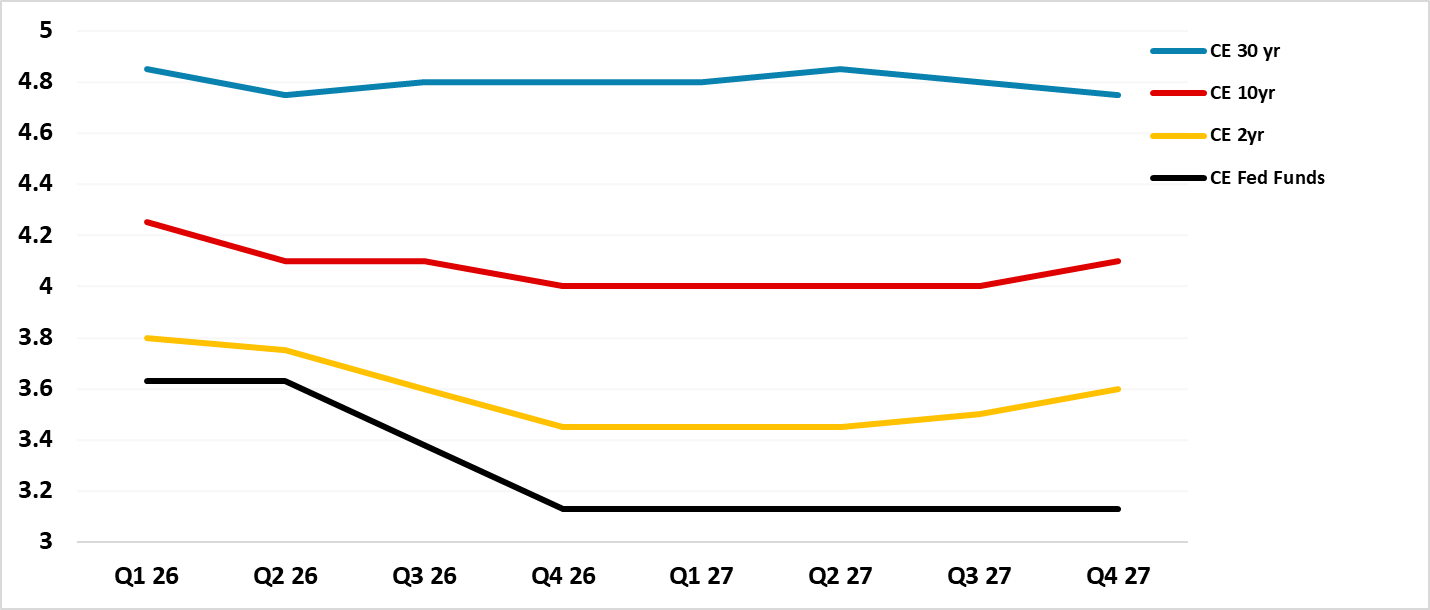
Source: Continuum Economics
The U.S. Treasury market prolonged steepening has partially reversed, as 2yr yields pushed up as easing hopes have been tempered due to the Iran war. Our baseline is that the war lasts for 4-8 weeks and does not cause 2nd round effects (here), but that the economy slows down H2 2026 as consumption has outstripped wage and income growth and fiscal policy is insufficient to lift growth – AI business investment should ensure this is a soft landing.
Kevin Warsh will likely be confirmed as Fed chair and he will pressure for two rate cuts to be delivered, but he is restrained by the majority of voting FOMC voting members being orthodox. Warsh will have to persuade Fed voters to be more forward looking, but also accept his argument that AI will boost U.S. productivity and will be disinflationary (see our recent article here). This could build an argument for a further cut if the economy softens, though FOMC voters will want to see more evidence on the impact of AI on the economy before reconsidering neutral rate views. This can see one 25bps cut delivered in Q3 and a further move in Q4 – the latter is a close call, as some FOMC voters could resist. This could also see 2yr down to 3.45% by end 2026, given that the market normally sees a clear swing to a premium of 2yr versus Fed Funds rate in the mature stage of an easing cycle (Figure 2). We see around a 20-30bps 2yr-Fed Funds spread by H1 2027, which is more controlled than the experience at the end of Fed easing cycle in the 1990’s (Figure 2).
Figure 2: 2yr-Fed Funds Spread and Fed Funds Rate Inverted (%)
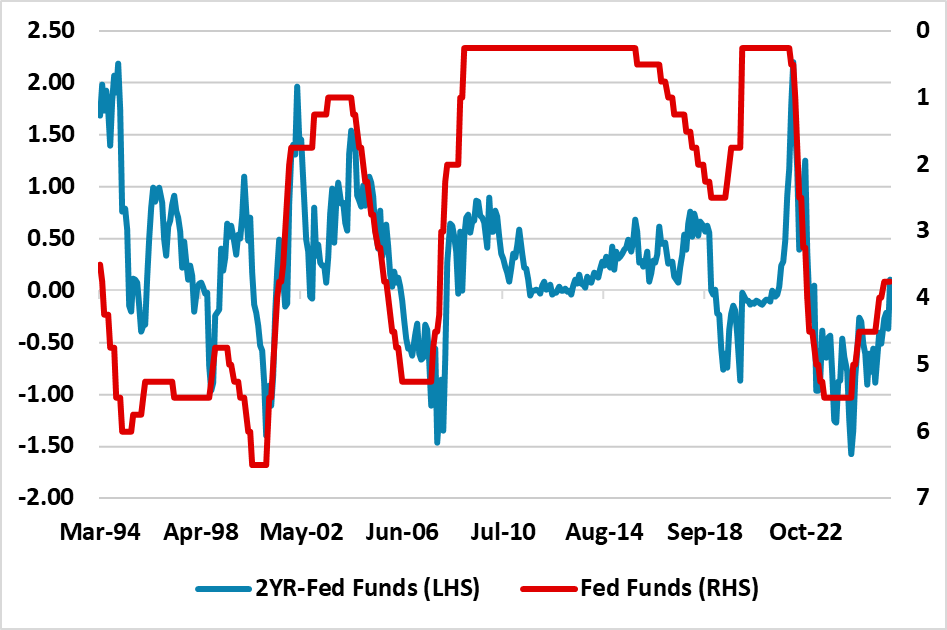
Source: DataStream/Continuum Economics
In terms of 10yr yields, the 2026 budget deficit will likely be 6.0%, with the supply picture helped by Fed buying in line with nominal GDP (Warsh will find it difficult to get consensus on shrinking the Fed’s balance sheet (here), but he is not on board with Trump’s fiscal dominance desires).
We also suspect that cyclical economic worries will produce a further yield dip after the Iran war has ended. Additionally, AI disruption is not just a question of winners and losers in the equity market, but some job losses and fear of more job cuts in the future could mean that AI disruption prompts questions over the long-term strength of income/employment and consumption growth (here). However, the 10-2yr yield curve tends to steepen further, as a Fed Funds easing cycle gets to a mature stage. The current yield curve is also not steep by 1990’s standards (Figure 3) and we can see choppy 10yr yields into H2 2026 (Figure 1) and 10-2yr yield curve steepening to 55-60bps. Given the size of funding requirement; long-term government debt trajectory and political reluctance to undertake fiscal consolidation, 2% 10yr real yields also feel right.
Figure 3: 10-2yr U.S. Treasury and Fed Funds Inverted (%)
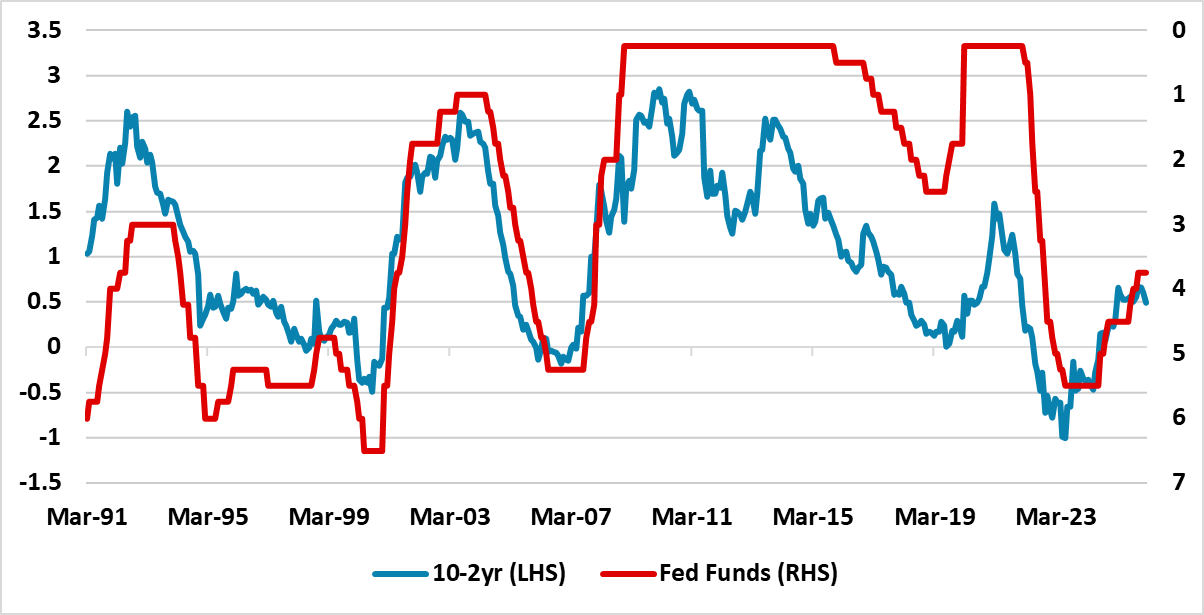
Source: DataStream/Continuum Economics
In terms of 2027, we see the Fed on hold and fighting any market expectations that a fine tune tightening could occur. This should cap 2yr and 10yr yields (Figure 1) and produce a choppy trading year, though with a small drift up in 2yr yields and yield curve flattening. The odds also remain of the Democrats gaining the House of Representatives, with the Senate now a close call, which will stop any further fiscal easing in 2027-28.
In terms of alternative scenarios, the risks are split between a multi-month Iran war that could risk 2nd round inflation effects and stop Fed easing (Figure 4), or a consumption slowdown that produces a domestic harder landing and more Fed rate cuts.
Figure 4: 10yr U.S. Treasury Scenario Analysis
| Baseline—65% | Upside—30% | Downside—5% | |
| Multi Week Iran War Then Gradual Fed Easing | Multi Month Iran War | U.S. Driven Harder Landing | |
| U.S. Treasuries | Fed undertakes 50bps of gradual easing in Q3/Q4 2026, as monthly inflation comes back down after a 4-8 week Iran war has ended. 2yr yields ratchet lower in 2026, but drift up in 2027 on fears of 2028 tightening. Yield curve steepening followed by flattening in 2027. 10yr choppy and range-bound yields due to Fed easing versus still large supply from a 6% budget deficit. 10yr end 2026 4.00%, end 2027 4.10% | Iran War last months rather than weeks, which then leads to WTI oil prices towards USD120-180 before coming down to still elevated levels. Headline CPI boost is large leaving a risk of 2nd round effects. Fed cannot cut rates initially, but would also find it difficult to tighten without persistent core PCE rise. However, if the shock caused a recession, then the Fed would cut policy rates to 2% or lower, which would see 2yr yields drop but sharp yield curve steepening. 10yr end 2026 4.35%, end 2027 3.90% | U.S. economy sees a domestic driven harder landing towards very slow growth, as consumption slows more than expected (weak income growth or AI job disruption) and prompting some disinflation. This scenario also assumes only a 4-8 week Iran war and a fall in energy prices in H2 2026. Fed easing is quicker and potentially to 2.5%. 2 and 10yr yields decline more quickly in H2 2026, with some yield curve steepening as the short-end reacts more. 10yr end 2026 3.70%, end 2027 3.90% |
Source: Continuum Economics
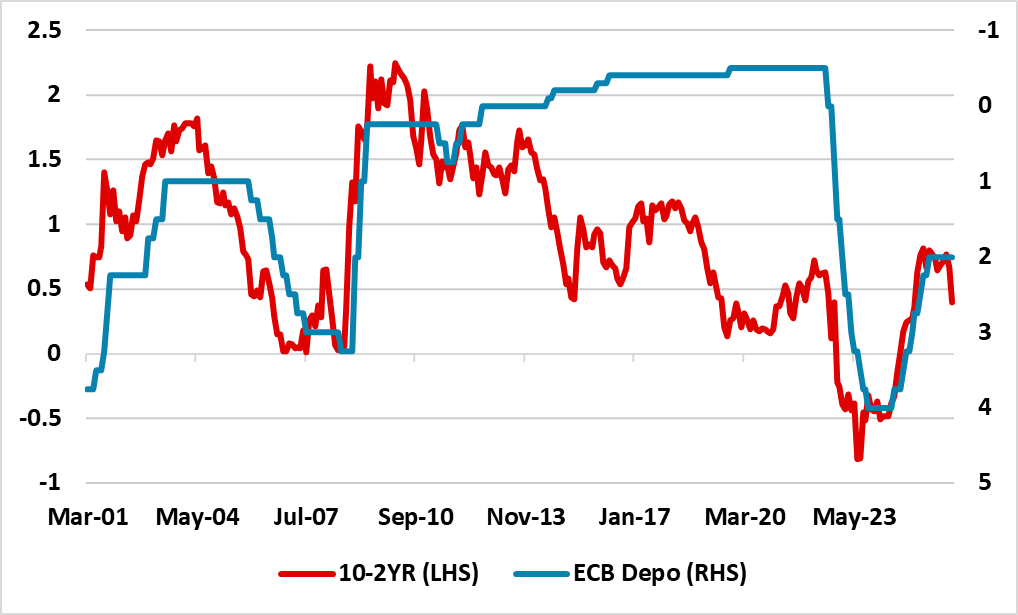
For Bunds, the Iran war has prompted speculation that the ECB could hike later in 2026 to guard against 2nd inflation effects. However, the March ECB meeting communications (here) were cautious rather than preparing for tightening, as a March-April energy spike will likely only have a temporary impact and the ECB will eventually look through the boost to headline inflation. The upward shift in bond yields and lending rates means the market is already tightening financial conditions without an ECB move. For the ECB council to agree an insurance rate hike will likely be difficult and would likely require a multi-month war and very elevated energy prices.
Meanwhile, bank lending intentions and loan rejection rates, alongside still elevated lending rates mean that financial conditions are tighter than suggested by a 2% ECB depo rate. One of the key reasons is that the ECB exit from ultra-easy monetary policy in 2021-22 is still feeding through with a long lag to mean maturing loans face higher rates. Indeed, we still feel that the risk remains for growth momentum to disappoint and as oil and gas prices come down in H2 2026, that the ECB policy debate pivots back to an easing bias or an insurance cut in Q4 2026. We feel it will be a difficult debate, but on balance we look for one 25bps cut to 1.75% given that wage inflation suggests core inflation remains controlled. This likely means a reduction in 2yr Bund yields in H2 2026, given that the market is currently discounting tightening (Figure 5).
However, the market will then likely take the view that policy rates have finally bottomed, with some of the hawks likely to voice the view that any such 2026 cut is insurance. Even so, the majority on the ECB will want to maximize the benefit of the monetary policy stance and ECB communications will likely fight ideas that H1 2027 could see tightening. This can limit the traditional swing of 2yr Bund yields to a positive spread over the ECB depo rate in H2 2026/H1 2027 to around 20-40bps, rather than the 60-140bps seen in 2003-05 (Figure 5).
Figure 5: ECB Deposit Rate, 2 and 10yr Germany Forecasts (%)
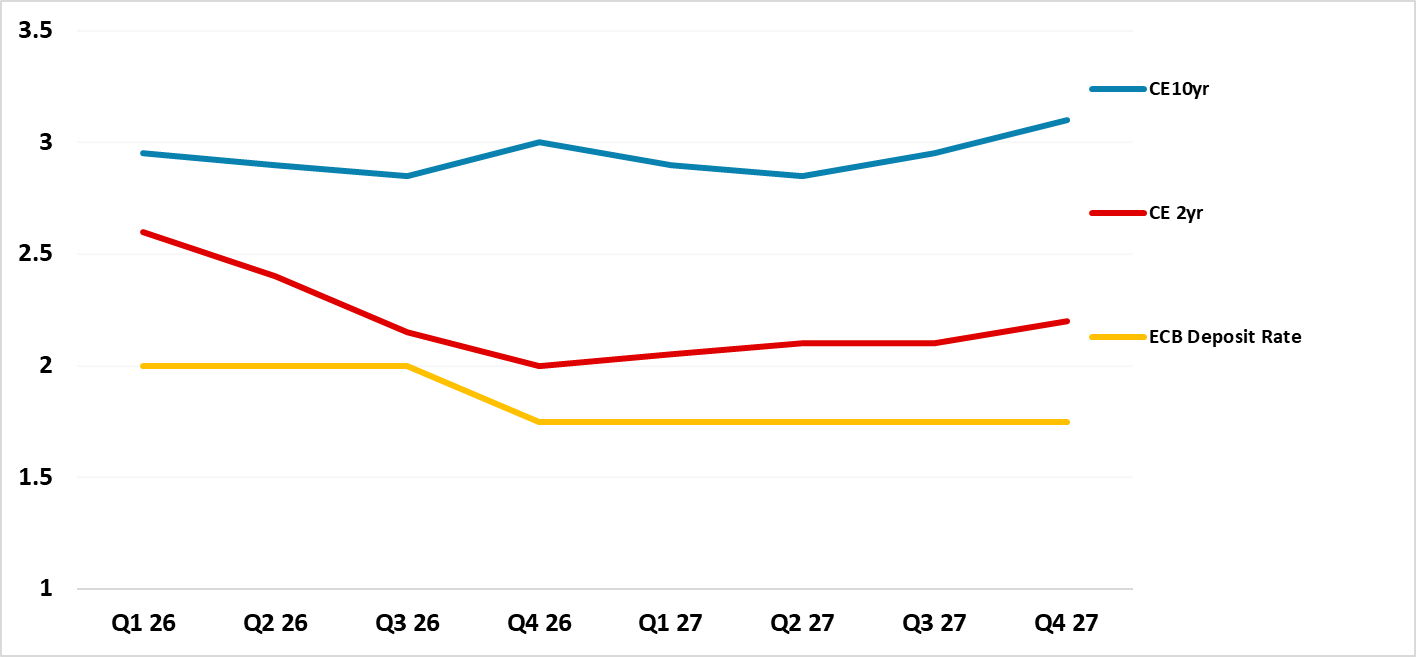
Source: Continuum Economics
Our 10yr Bund yield forecast is for a modest increase in 10yr yields (Figure 5). The German budget deficit expansion will add to bond supply. Additionally, 10yr real Bund yields still remain low relative to the 1990-08 period and we feel that around 3.0% is more appropriate as a medium-term equilibrium. ECB QT also adds to the net bond issuance that the bond market has to digest. The 10-2yr yield curve can steepen to 7-90bps by end 2026, though this is not as steep as 2003-05 (Figure 6) but then into 2027 will likely flatten somewhat. Additionally, as part of the process of improving financial conditions, we also feel that the ECB will slow APP and PEPP QT in 2026 or 2027, which will curtail yield curve steepening.
Figure 6: 10-2yr Germany to ECB Deposit Rate Inverted (%)
Source: Continuum Economics
It is worth mentioning that 2027 could be overshadowed by French fiscal and political tensions. The focus is on the May 2027 presidential elections, where the two stage process means that other major parties will likely rally around a candidate (as yet unclear who this will be) to stop a National Rally candidate winning. However, a new president will be faced with parliamentary deadlock and will therefore face a choice of waiting until 2029 when they are due to hold parliamentary elections or go earlier to try to break the deadlock and get a majority for fiscal consolidation. Current opinion polls suggest that the three way split in the electorate remains and this argues against a post presidential election shift towards fiscal consolidation by any government. Further credit agency downgrades and foreign selling on French government bonds will likely be the result alongside economic sluggishness. At a minimum, fiscal tension throughout 2027 and at worst a H2 2027 French fiscal crisis! It could also mean an 80bps 10yr France-Germany spread. Elsewhere, Italy’s PM Meloni will likely be re-elected in October 2027 through with a rejigged coalition but still supporting fiscal consolidation.
Figure 7: 10-2yr JGB to BOJ Policy Rate Inverted (%)
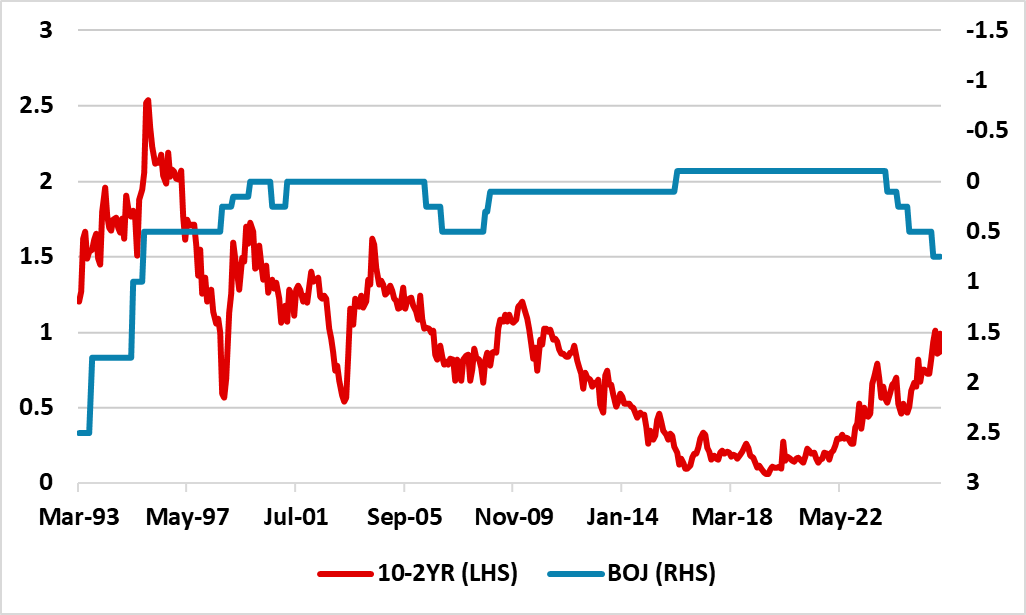
Source: Datastream/Continuum Economics
Figure 8: 10, 2yr JGB and BOJ Policy Rate Forecasts (%)
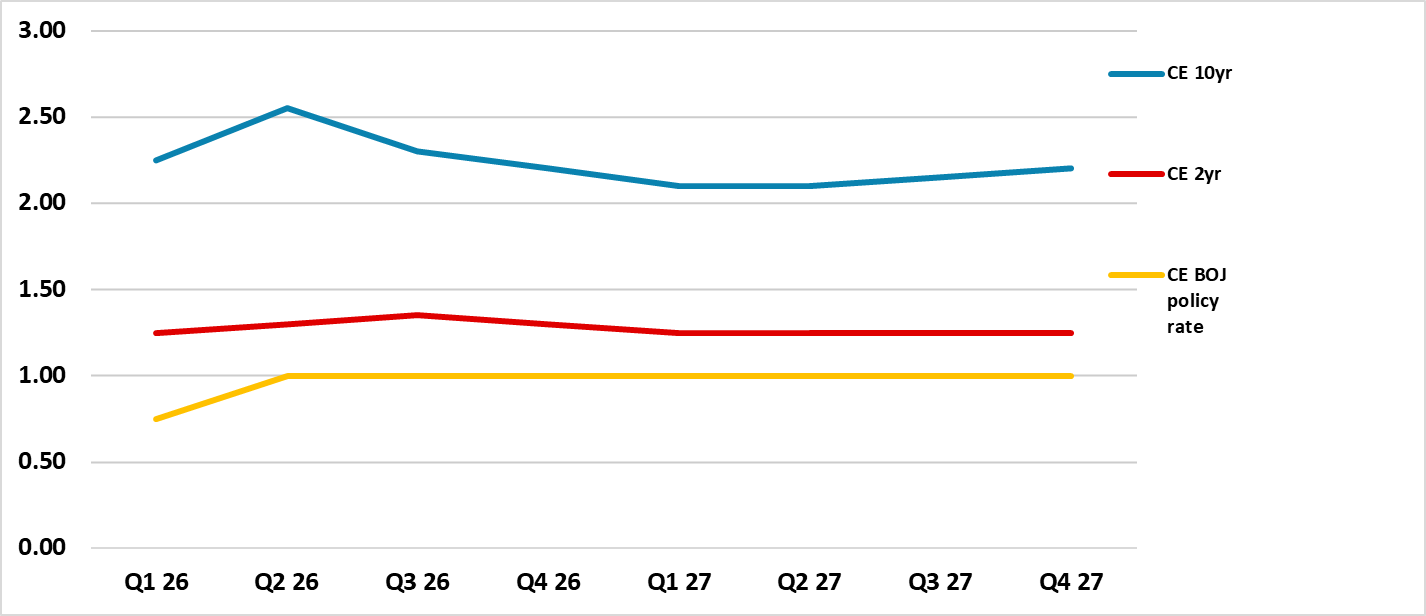
Source: Continuum Economics
In Japan, the Iran war will likely boost 2026 CPI inflation and provide a further reason for a BOJ hike. However, it is the underlying inflation behavior that matters most with higher wage inflation leading to higher CPI multi-year. Our sense is that wage settlements are enough to provide the BOJ with confidence to hike in Q2 and we still feel that April is the most likely date for a hike. Though PM Takaichi appears reluctant to see further BOJ hikes, we feel that the BOJ will want to undertake an additional normalization move. One option is 10bps and 15bps in two steps to see if the oil and gas price shock have any adverse real sector effects. However, on balance we feel that the BOJ will likely go for one 25bps hike and then signal a pause for the rest of 2026 and this could cap 2yr spread over the BOJ policy rate (Figure 8). Though the BOJ could want to normalize further in 2027, we feel that inflation will slow with energy prices coming back down and wage/price setting behavior not establishing inflation around 2% due to wary consumers. Thus we see no change in the BOJ policy rate in 2027 and this can see 2yr yields becalmed.
For 10yr yields, the BOJ is the only major central bank that is still increasing the pace of QT, and we estimate that BOJ QT will likely be close to 6% of GDP in 2026. This will likely produce renewed upward yield pressure for longer maturities and we still forecast that 10yr yields could spike to 2.5% and this will likely cause the BOJ to slow the pace of QT by raising the monthly pace of bond purchases rather than reducing it! 1st step could come in June 2026, when the BOJ will likely slow or stop the shrinkage on monthly bond buying. This can slow the rise in 10yr yields, but only an increase in bond buying is likely to bring 10yr yields back down to the 2.00-2.25% area.
Figure 9: 10, 2yr Gilts and BOE Bank Rate Forecasts (%)
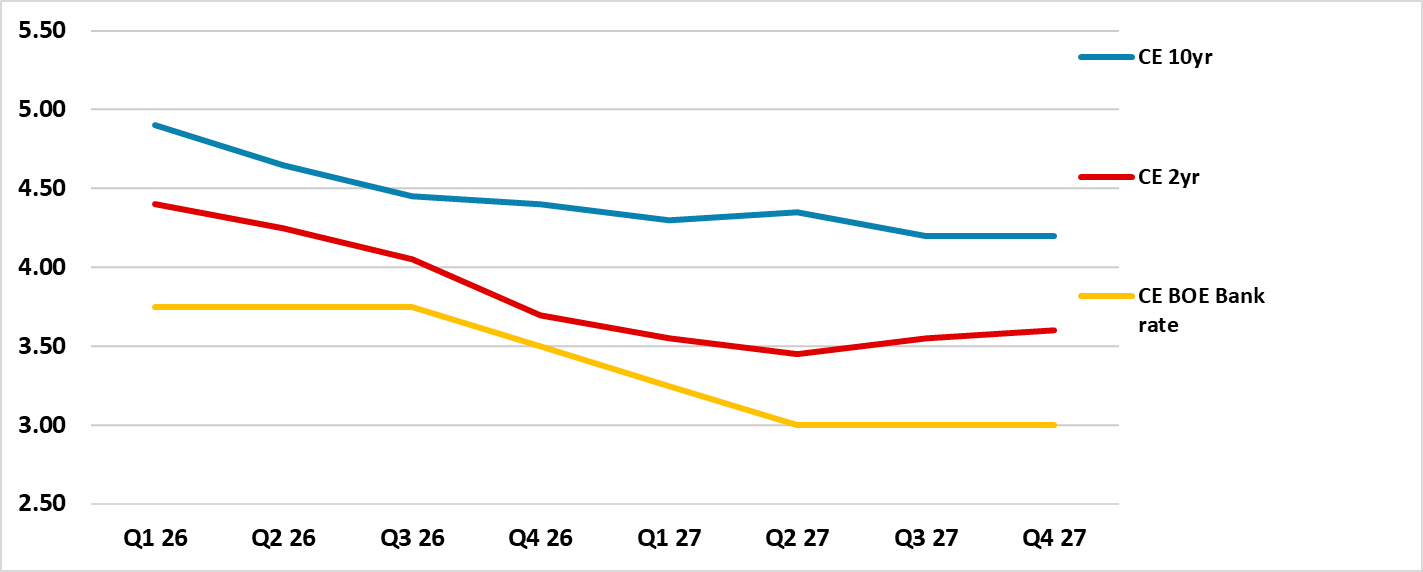
Source: Continuum Economics
For Gilts, the focus for the next couple of months will be the feedthrough of higher oil and gas prices in the UK, which has clearly delayed easing but the BOE adopted a symmetric neutral policy (here); tightening if 2nd round effects are clear, but easing if disinflation occurs with a slack economy and labor market. Gilts have only heard the tightening risks, which we do not see occurring due to labor market slack and also as financial conditions have tightened with the huge shift in short-end yield and mortgage rates. The BOE need to see the duration of the war, plus the multi month trajectory of oil and gas prices coming back down, which argues for nervous unchanged rates through mid-year. Even so, our central scenario (here) remains for a 4-8 week war and a partial retracement of energy prices. This could allow the doves on the MPC to revisit the soft UK economy and weak labor market, with the latter arguing against any real 2nd round inflation effects. Indeed, we can see this delivering the next 25bps rate cut in Q4 followed by further slowing easing in 2027. A BOE consensus to raise rates would only likely occur in the scenario of a 2-6 month war that then really threatened 2nd round inflation effects, which is a 30% risk.
In terms of 2yr, our BOE view is very divergent from the money and bond markets and this will likely lead to a stepped decline in 2yr yields in 2026 as the market tempers tightening fears and turns more neutral (Figure 9). In 2027, 2yr gilt yields will likely push to a positive premium versus the BOE policy rate, as policy easing gets mature. At the end of the 1994, 1996, 1999 and 2001 easing cycles 2yr gilt yields pushed to 100bps over the BOE policy rate. A positive 25-50bps premium between 2yr and BOE policy rate would be more reasonable now.
For 10yr gilt yields, QT is still 2% of GDP. We look for a further slowing to around £50bln from September 2026 to avoid tight financial conditions too much and then £30bln from September 2027 – while also increasing low T bill issuance. However, politics is a swing factor for gilts in 2026 and 2027 ahead of a 2029 general election, with a high risk that PM Starmer or Chancellor Reeves could be replaced. This would likely lead to a softening of the fiscal rules rather than a major fiscal easing but could temporarily boost 10yr yields (here).
Figure 10: 10-2yr and BOE Bank Rate Inverted (%)
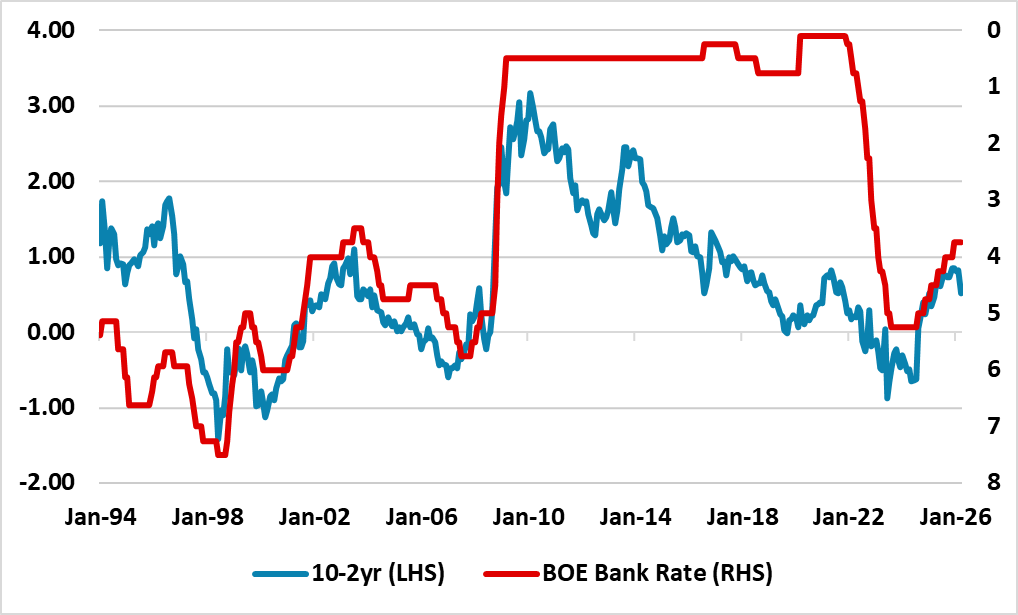
Source: Continuum Economics
10yr gilt yields face a choppy environment in 2026. While our significantly different BOE view versus market expectations argue for a strategic multi quarter decline in yields, UK politics suggests a continued modest risk premium versus U.S. Treasuries. Additionally, the 10-2yr Gilt curve is not steep by historical standards for the level of BOE policy rates (Figure 10) and an easing of BOE tightening fears will likely be mainly seen at the short-end.