EM Government Debt: BRICS Divergence
Brazil and South Africa suffer from debt servicing costs outstripping nominal GDP, which will remain a concern unless a consistent primary budget surplus is seen – though S Africa enjoys a much longer than average term to maturity than Brazil. India and Indonesia, in contrast, enjoy nominal GDP outstripping debt servicing, which helps multi-year fiscal consolidation. China also has low debt servicing costs helped by pressure on creditors by China authorities and fears of deflation, but China authorities are restrained by the large amount of debt to central/local government/LGFV and SOE that now exceeds 200% of GDP.
Brazil debt market is seeing surging yields on debt sustainability and inflation concerns, while S Africa yields fell noticeably mid-year. What are the fiscal metrics showing across major BRICS countries?
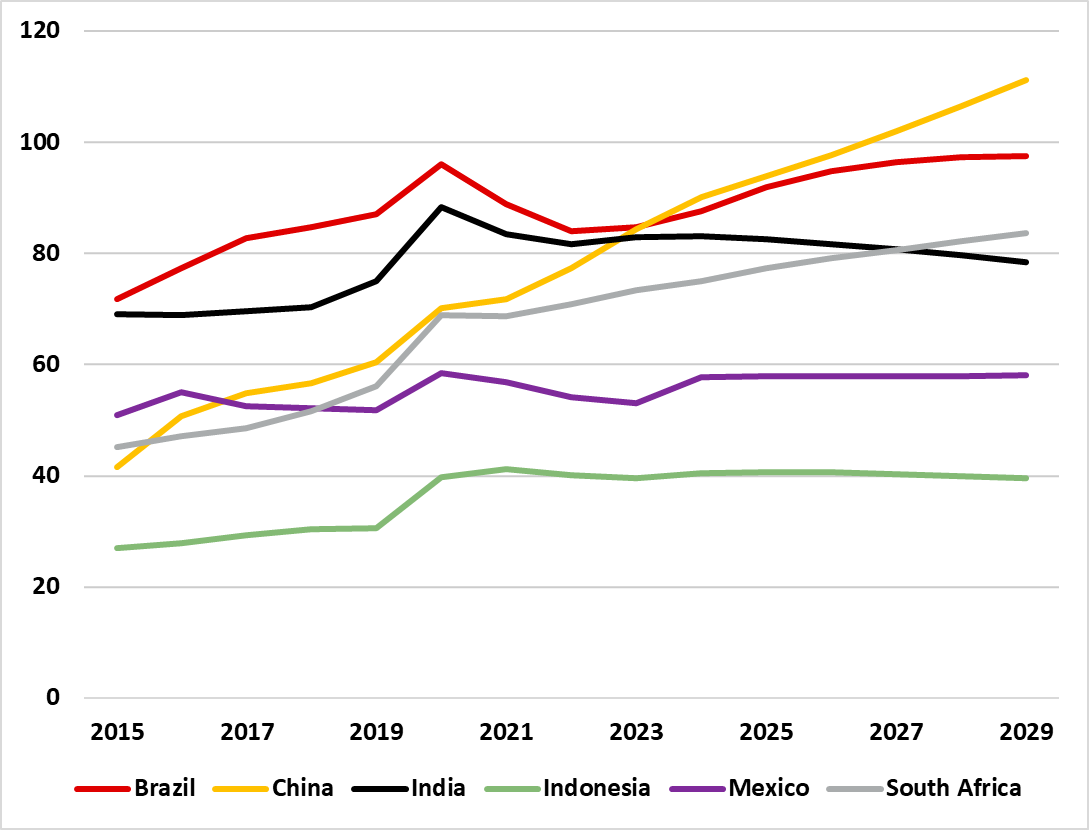
Figure 1: General Government Gross Debt to GDP (%)

Source: IMF/Continuum Economics
At one level government debt/GDP trends tell a story for major EM countries. Brazil is above the EM average and expected to rise close to 100% of GDP later in decade. In contrast, high nominal GDP growth in India helps to allow the government debt/GDP ratio to fall. Figure 1 shows these for general government gross debt using IMF data for comparison purposes, which differs from official government debt targets modestly or significantly depending on what’s included. What do an array of fiscal indicators tell us?
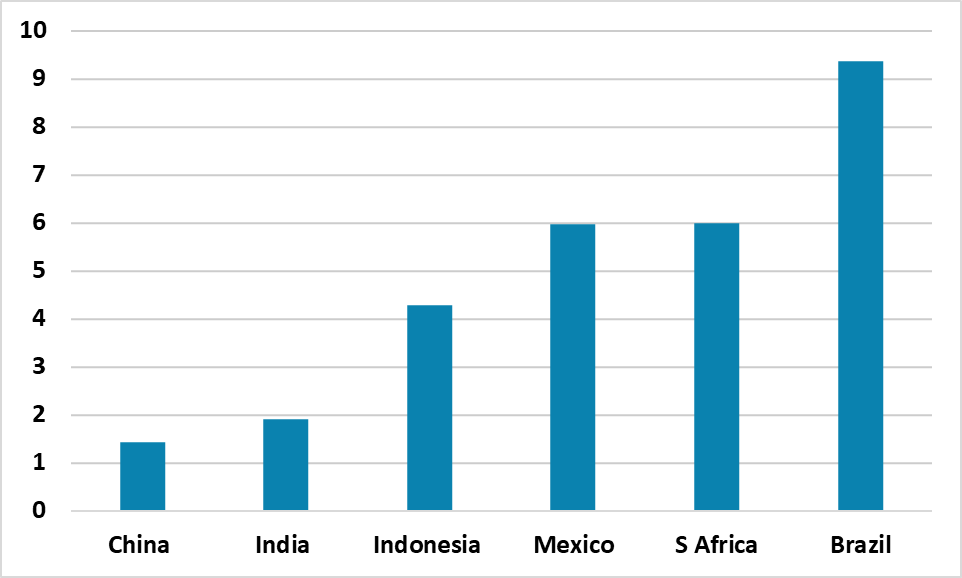
Figure 2 shows a cross section of indicators. For 2025 and 2026 though, India’s debt outlook will be balancing act between fiscal consolidation and growth imperatives. But India is helped by interest payments being well below nominal GDP, which helps the government debt dynamics despite a general government deficit at 6-7% of GDP for the rest of the decade. India also benefits from having low foreign ownership, which will likely rise with its size and inclusion in certain bond indices. Finally, India still has scope to broaden the tax base as it moves to a middle-income country, which allows the policy optionality to reduce the budget deficit long-term. Indonesia benefits from the same positive issues, though is more dependent on non-residents and thus liable to volatility on any sudden stop of flows to EM’s. Mexico has a lower general government debt/GDP and trajectory (Figure 1) than the average for big EM countries. However, Mexico suffers from interest payments exceeding nominal GDP, as Mexico traditionally pays a high real yields (Figure 3) for the market to hold its debt comfortably.
Figure 2: Reasonable Fiscal Situation (%)
Reasonable | Net Government Debt/GDP 2024 (%) | Change in Government Debt 2015-24 (%) | Budget Deficit/GDP 2024 (%) | Non-Resident Holdings of debt (% of total) | Average term to maturity 2024 (years) | Projected Interest Rate to Growth Differential 2024-29 (%) | Government revenue/GDP (%) |
G20 Emerging | 75.8 | 32.0 | -6.4 | 9.7 | 7.1 | -3.1 | 27.0 |
Indonesia | 40.5 | 13.5 | -2.7 | 34.4 | 7.5 | -1.6 | 14.3 |
Mexico | 57.7 | 6.8 | -5.9 | 23.3 | 6.9 | 2.3 | 24.2 |
India | 75.0 | 14.0 | -7.8 | 4.6 | 7.5 | -3.2 | 21.3 |
Source: IMF/Continuum Economics
Figure 3: Real 10yr Yields Using 2025 CE Inflation Forecast (%)

Source: Bloomberg/Continuum Economics
Some countries fiscal metrics are worrying (Figure 4). Brazil sees interest payments outstripping nominal GDP, which means pressure to run a primary surplus that is politically difficult. Brazil also suffers from having a shorter than average term to maturity, which means large scale gross redemptions each year that can cause intermittent funding squeeze and an excess real yield. Finally, Brazil is already highly taxed by EM standards and swinging to a budget surplus requires politically painful expenditure cuts as well. One positive for Brazil is that most of its debt is in local currency, facilitating its rollover. S Africa also suffers from interest payment outstripping nominal GDP growth and putting pressure on the government to run a small primary budget surplus. However, S Africa long average term to maturity and reasonable exposure to non-residents mean that the real yield premia can be reduced if politics is stable and business friendly, which is what has happened in the aftermath of the coalition formation in 2024 despite some disagreements between ANC and DA like recent controversial education bill that passed into law late December. It could be more difficult to reduce real yields from current levels however in 2025.
Figure 4: Worrying Fiscal Situation (%)
Worrying | Net Government Debt/GDP 2024 (%) | Change in Government Debt 2015-24 (%) | Budget Deficit/GDP 2024 (%) | Non-Resident Holdings of debt (% of total) | Average term to maturity 2024 (years) | Projected Interest Rate to Growth Differential 2024-29 (%) | Government revenue/GDP (%) |
Brazil | 87.6 | 15.8 | -6.9 | 10.8 | 5.5 | 3.1 | 39.3 |
South Africa | 75.0 | 29.8 | -6.2 | 23.2 | 10.7 | 1.6 | 27.0 |
China | 90.1 | 48.6 | -7.4 | 2.6 | 6.2 | -3.7 | 26.4 |
Source: IMF/Continuum Economics
China 10yr real government bond yields (Figure 1) is the lowest of this grouping we have reviewed, which could partially reflect fears that low positive inflation could turn into Japan-style persistent small declines in inflation – which also boosts safe haven demand and reduces real yields. China general government debt dynamics are not to be ignored however. The official government debt/GDP is projected to be 60% in 2024, but the IMF main measure includes 2/3 of the LGFV debt and is projected at 90.1% -- the IMF augmented government debt/GDP trajectory is projected at 124% in 2024 and includes all LFGV debt and other general government funds. SOE debt to GDP is then a further 88% of GDP (here). Total government and SOE’s are thus 212% of GDP on the widest possible measure in 2024.
The big story in China is that through time the official measure will move towards the IMF main measure, as LGFV debt is converted into local authority debt – a Yuan6trn 3-year debt swap is underway (here). With non-residents a small player in China debt (Figure 4), China creditors (banks/insurance companies) system ensures that the solution is that debt gets rolled over, on the guidance of China’s authorities. Market based pricing is also not fully in place in China with LGFV debt trading on an implicit government guarantee as well as credit agency ratings. This ensures that the debt servicing cost are lower than other EM’s. The losers include China households (the ultimate creditor) with low deposit and other financial returns. However, China general government deficit is projected to increase to 8% of GDP in the coming years and this means that the main IMF measure of general government debt is projected to rise from 90% of GDP to 111% by 2029. While China authorities control over creditors and debtors avoid high real yields and worse debt dynamics, the fiscal actions of the authorities have been restrained by concern that the total government/corporate/household debt to GDP has risen dramatically since 2007 (here) and now exceeds the U.S./EZ. We do see Yuan3-5trn of true fiscal stimulus in 2025, but China long-term government debt dynamics restrain further action.