China and Japan Debt Compared
China housing crisis will likely mean that household debt/GDP flat lines in the coming years like Japan after 1990 and be a headwind for consumption. Meanwhile, the downturn in residential construction is already greater than that experienced by Japan after 1990 and in itself will be remain a structural headwind for China GDP. Though China corporate debt/GDP ratio is higher than Japan in 1990, China LGFV debt is 50% of GDP and in the worst case will be swapped for local and central government debt. China government debt/GDP will likely grow sharply in the rest of the decade due to some nationalisation of LGFV debt and as China intermittently use fiscal policy stimulus.
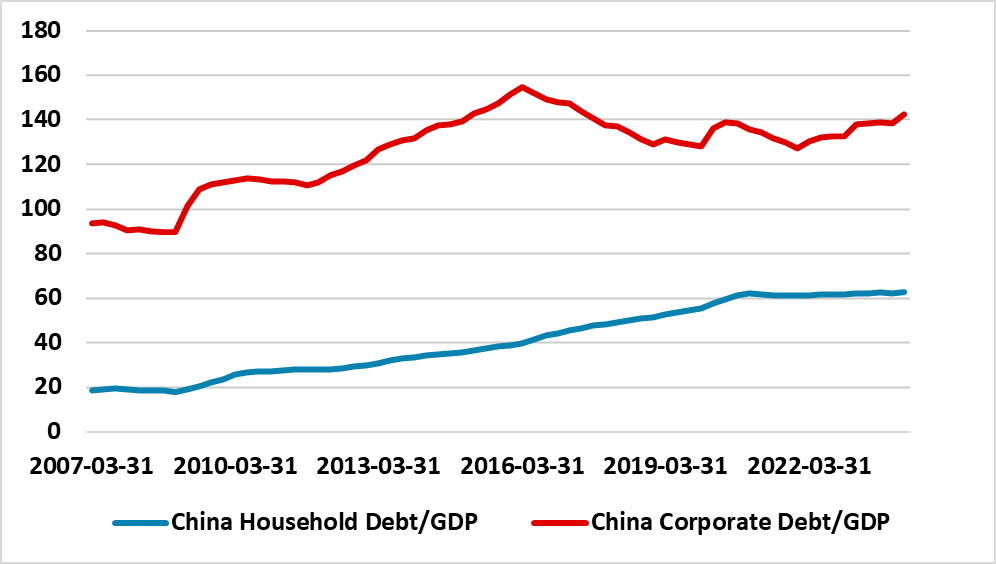
Figure 1: Japan (top) and China Household and Corporate Debt/GDP (lower) (%) 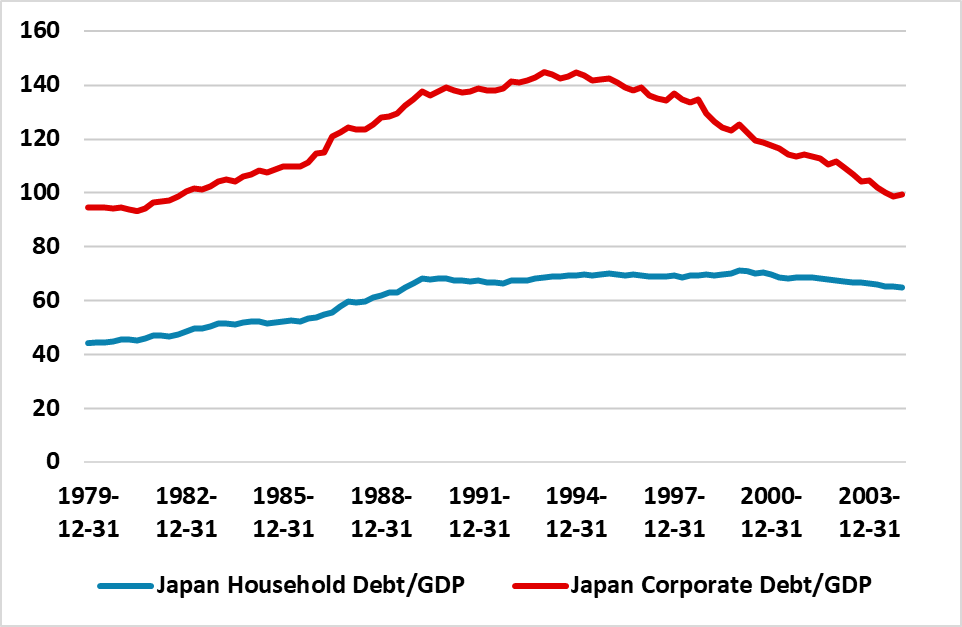
Source: BIS/Continuum Economics
Our starting point for comparing China now and Japan in 1990 is using household and corporate debt to GDP (Figure 1), which is similar for households but corporate debt/GDP is higher in China now than Japan in 1990. For Japan this also captures the debt build up during the boom years but then the debt reduction during the bust years. Japan balance sheet recession in the 1990’s has prompted questions whether parts of China’s economy will suffer the same fate in the next 5-10 years. China household debt/GDP rise is now similar to the levels seen in Japan in 1990, but since China’s consumption is a smaller part of GDP the debt burden is greater in China. Additionally, Japan nominal per capita GDP was USD25800 in 1990 versus China at USD12700 in 2022.
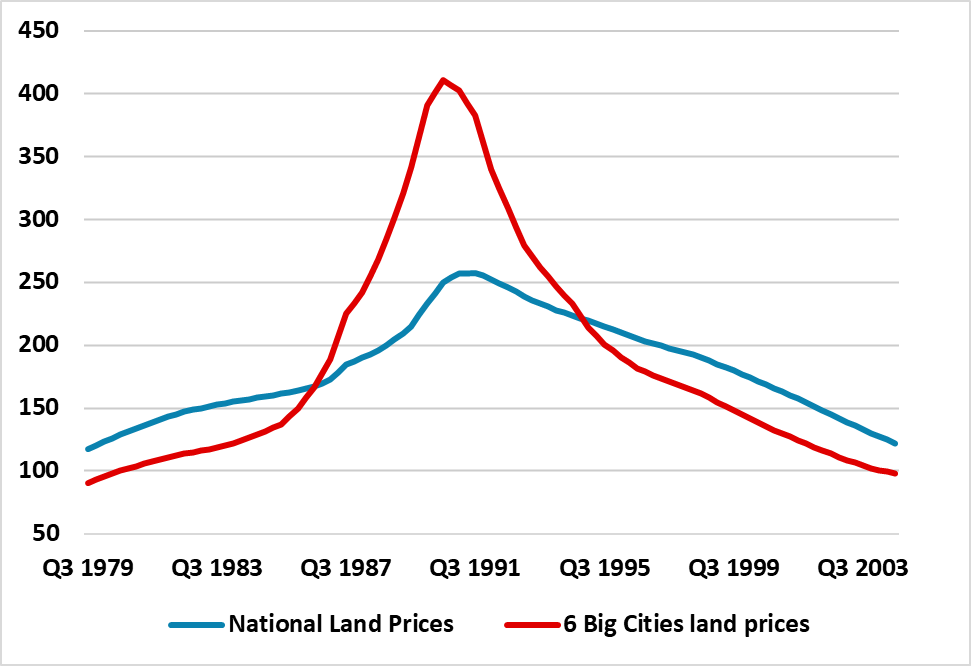
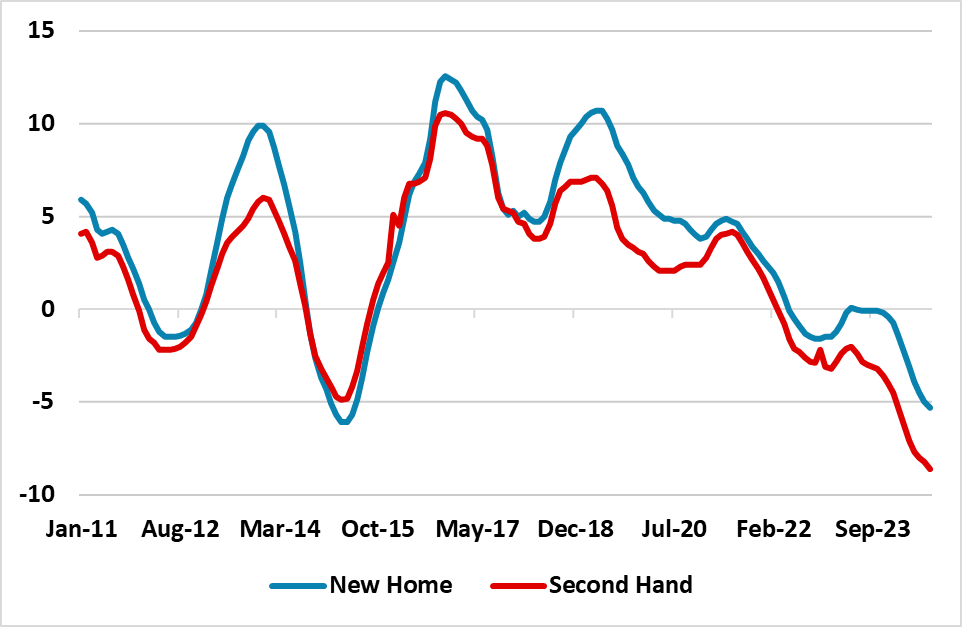
For China’s household debt prospects one of the key questions is house price prospects. So far official China NBS data has only shown a moderate decline in house prices from the 2021/22 peak of the property market (Figure 2), compared to the bust in Japan after 1990. However, anecdotal reports suggest circa 15-20% decline in second home prices in major China cities since the peak, while China authorities are also restricting price flexibility in new homes. In China this mean that households know that prices have still further to decline and this has restricted property transactions. Even so, Japan property price levels got to extremes in 1990. Overall, our assessment is that China national house prices will likely fall around 30-35% peak to trough multi-year (here), which will still be a big shock to household wealth and consumption growth (here) in China. This could mean that household debt/GDP at best moves sideways at current levels, with the risk it could decrease and deleveraging prove a hangover for consumption.
Figure 2: Japan Land Prices (top chart) and China New and Second Hand Home Prices (lower chart, %)
Source: Datastream/Continuum Economics
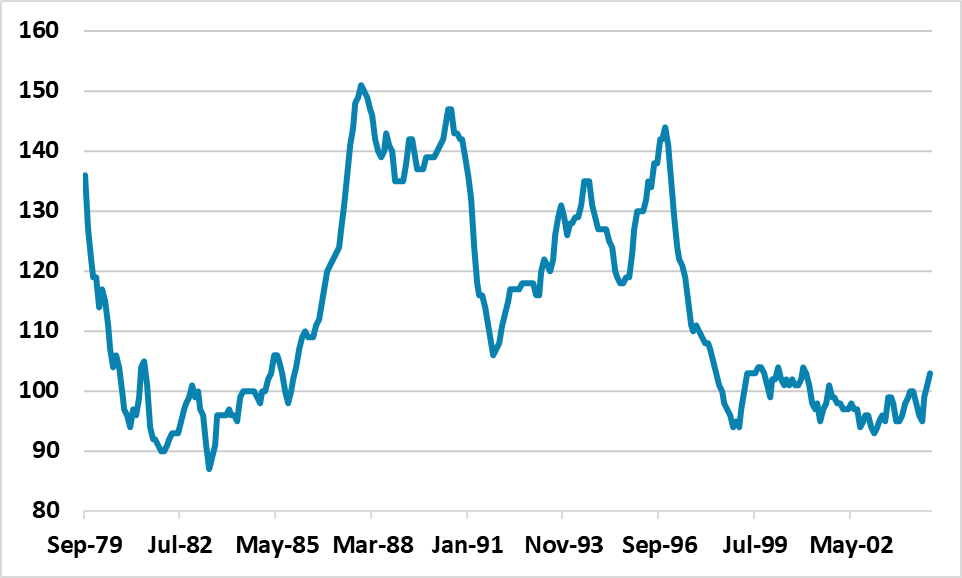
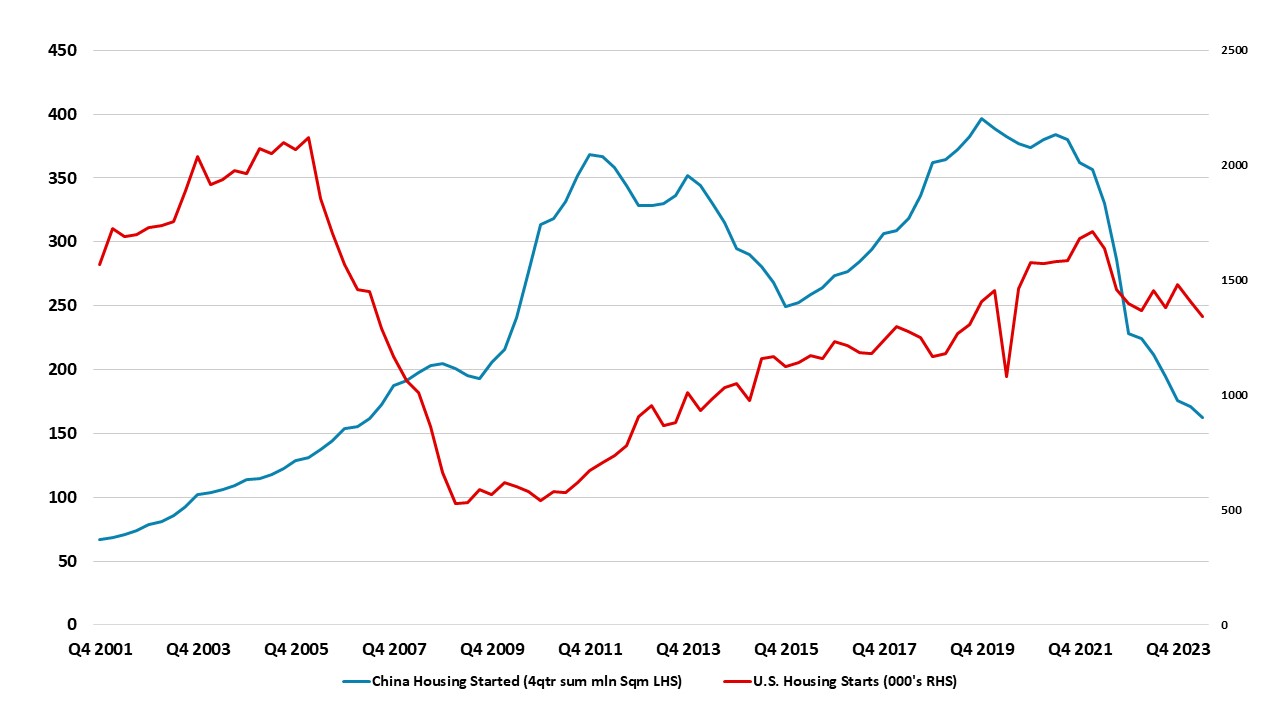
The residential construction outlook looks worse in China than Japan however (Figure 3). Residential investment in Japan fell after the 1990 peak, but then recovered. In contrast, the percentage drop in residential investment is already larger than Japan and does not appear to have yet reached bottom. Completed unsold houses and apartments would likely require a Yuan3-4trn purchase by central government to clear the estimated 5mln inventory, but the government has only allocated Yuan300bln. Uncompleted residential property is estimated to be much larger and official action are not large enough to absorb the adverse effects on construction. We maintain the view that residential investment will likely remain a drag on GDP for the next 3-5 years and a structural headwind to growth. Additionally, China construction property bust also has an impact on the overhang of corporate debt/GDP, both in terms of property developers and also local government financing vehicles (LGFV’s).
Figure 3: Japan Housing Starts (top chart) and China Housing started (lower chart)
Source: Continuum Economics
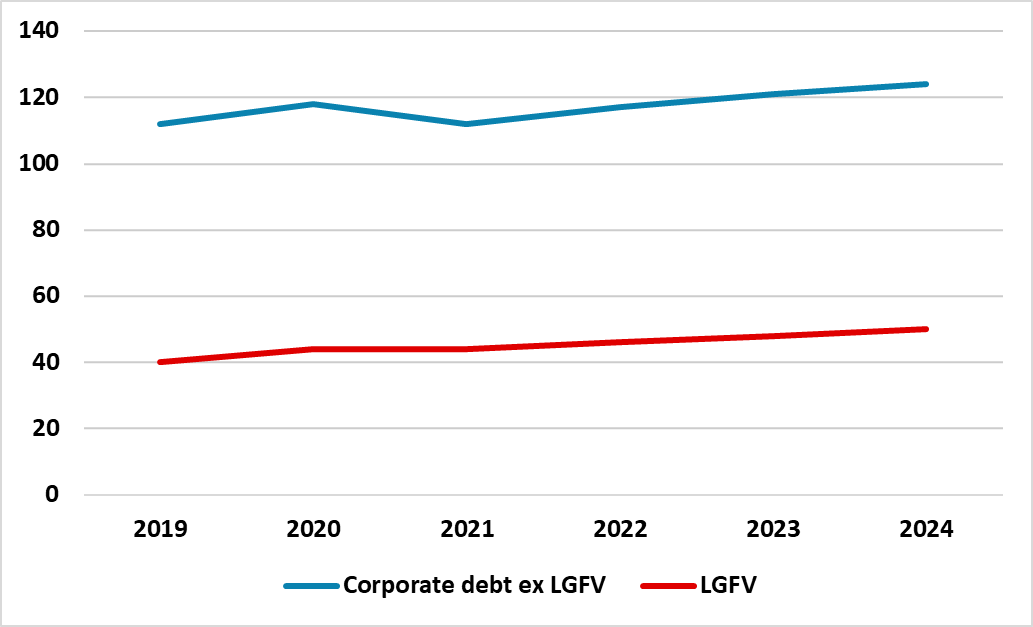
Debt to property developers has become distressed, as delays in completion and sales plus falling new home prices/reluctance of homeowners to pay large deposits have squeezed cash flow and profits. Government help (including the PBOC pledged supplementary lending) has helped to extend or transform debt, while local government takeover of projects and developers are helping to reduce debt default. However, the decline in property transactions is hitting local government tax revenue (included as general government debt) and also LGFV’s (classified as corporate debt). LGFV debt is estimated by the IMF to be 50% of GDP (Figure 4), while estimates of property developer’s debt have been around 12-13%.
Some LGFV’s have slowed investment spending, due to the squeeze of revenues and to try to manage existing debt loads. This is an economic hit to the economy, which has partially counterbalanced central government spending in 2023/24 to boost infrastructure spending and flood defenses – two separate Yuan 1trn programs. However, China authorities will not allow widespread failure of LGFV’s as it would send shockwaves through the economic and financial system. China has already announced a Yuan1trn LGFV debt swap for local authority government bonds in 2023 (here), while the nationalization of LGFV debt was much greater in 2015 when a Yuan12trn debt swap occurred. LGFV’s effects will mainly be economic, but some of the debt will also move to the official government balance sheet.
Figure 4: China LGFV debt to GDP (%)
Source: IMF/Continuum Economics
Corporate debt excluding LGFV’s and property developers is still high, but includes state owned enterprises (SOE’s) that tend to see their debt rolled over and secure new funds from the banking system as required – state owned banks and heavily influenced banking system. The SOE and LGFV dimensions means that corporate debt in China is unlikely to see the sharp fall that occurred in Japan after 1990 (Figure 1). However, we will still see reduced economic activity from property developers and LGFV’s. Additionally, private sector businesses have divergent trends currently between favored (e.g. high tech and renewables) and others (including those that have suffered regulation and corruption crackdowns). China data points to restrained private sector investment also due to the less friendly business environment than the boom years of 1990-2019. In turn this is also restraining wage and employment growth and acts as a restraint on consumption in a negative feedback loop.
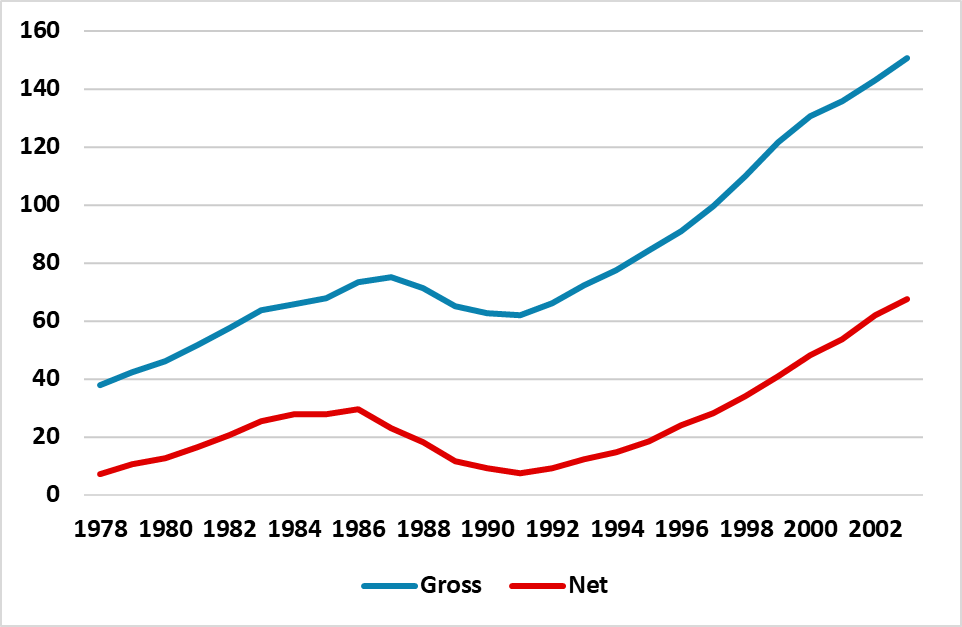
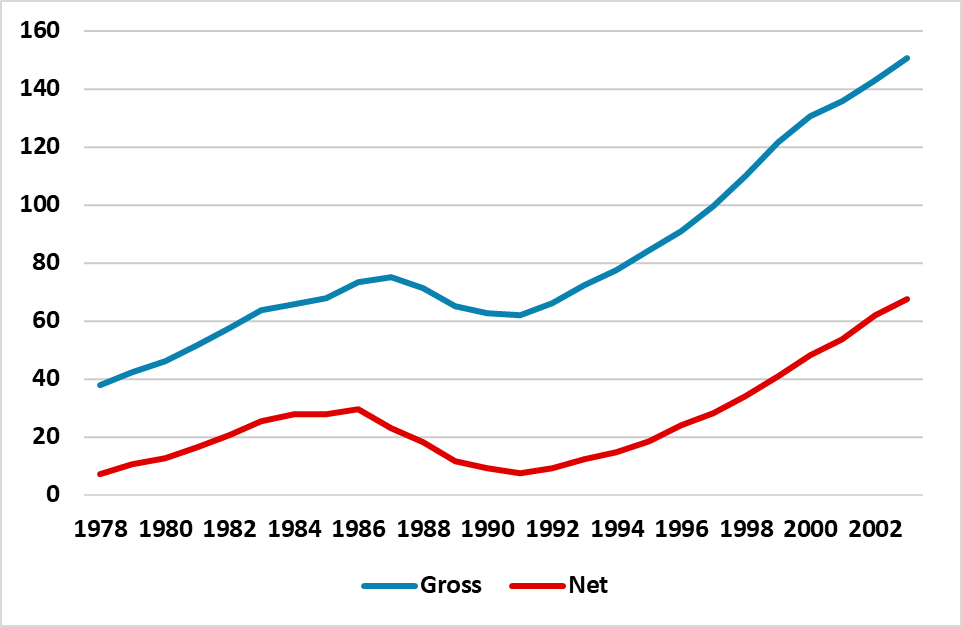
In Japan, the general government debt/GDP ratio rose sharply from 62% in 1990 to offset the deleveraging by the corporate sector and the stalling of household debt/GDP during the 1990’s (Figure 5). This helped to provide a safety net for the economy, but did not stop growth being anemic compared to the 1980’s as boom swung to bust. Japan government spending was helped by the dominance of Japanese institutions as creditors and also the low net government debt/GDP at the time due to large financial assets of the government.
China official measure of government debt is 61% of GDP in 2024. However, this excludes LGFV debt of 50% of GDP and general government funds (GGF) of 14% (from IMF article IV Aug 2024 (here)). The IMF central estimate including 2/3 of LGFV and excluding GGF is 90% of GDP in 2024 (Figure 5), which is a worse starting point than for the Japanese government in 1990 – the IMF augmented measure with all LGFV and GGF debt is higher still at 124% of GDP. China authorities have differed over government debt measures with the IMF for many years, but their behavior reflects an understanding that the true government debt/GDP ratio is higher than the official MOF measure due to LGFV and GGF debt. China authorities are also worried about the total non-financial (household/corporate and government) debt/GDP ratio at 312% in 2024, which is higher than the U.S. or EZ. Fiscal policy easing during the COVID period was active rather than the aggressive manner seen in 2008/09 and 2023/24 fiscal policy measures have been targeted and measured in size. China fiscal space appears restrained, unless a hard landing is seen in the economy (here) that could threaten political instability. China authorities are also reluctant to consider large scale QE to indirectly allow more government debt issuance and expand fiscal space. The package of monetary policy measures on September 24 (here) will likely be followed by new fiscal easing in the Yuan 1-2trn area, which will help Q4 2024 and H1 2025 GDP but would not be game changing size for the economy. This is a safety net, but does not stop the process of China moving to a slower trend growth and we maintain the forecast of 4.0% for 2025 GDP growth (here).
Figure 5: Japan (top chart) and China Gross Government Debt/GDP (lower chart) (%)
Source: IMF/Continuum Economics
Overall, China housing crisis will likely mean that household debt/GDP flat lines in the coming years like Japan after 1990 and be a headwind for consumption. Meanwhile, the downturn in residential construction is already greater than that experienced by Japan after 1990 and in itself will be remain a structural headwind for China GDP. Though China corporate debt/GDP ratio is higher than Japan in 1990, China LGFV debt is 50% of GDP and in the worst case will be swapped for local and central government debt. China government debt/GDP will likely grow sharply in the rest of the decade due to some nationalisation of LGFV debt and as China intermittently use fiscal policy stimulus.