China Corporate Debt Deleveraging
Private companies ex property developers have seen a small pay down of debt, but the largest remaining portion of non-financial debt ex LGFV is central and local SOE’s. They have low profitability and have shown few signs of increased leverage. This leaves the onus on fiscal policy.
Reports suggests that the LGFV debt swap for local and central government bonds could be Yuan6trn through end 2027, but what is happening to other non-property developer corporate debt?
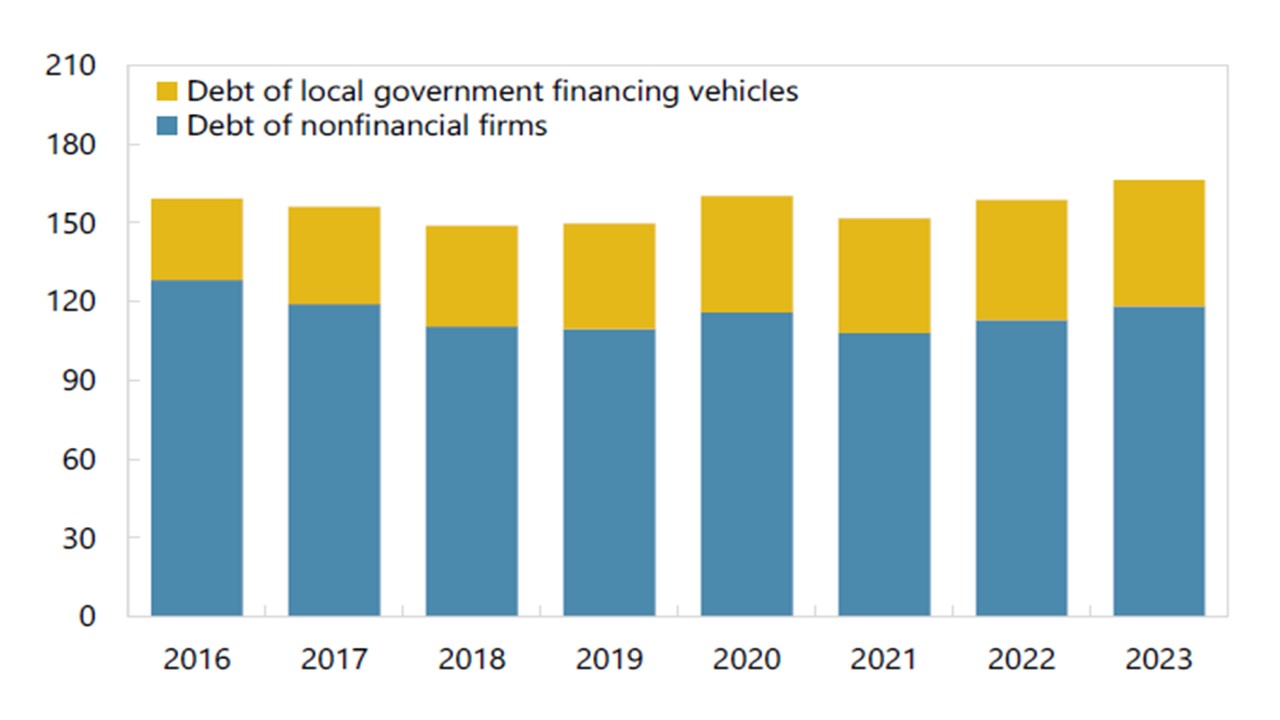
Figure 1: LGFV and Non-Financial Corporate Debt/GDP (% of GDP)
Source: IMF Selected Issues Aug 2024 (here)
LGFV debt has attracted a lot of attention, with estimates that it is 50% of GDP (here). Though it is counted in corporate debt, the implicit government guarantee become real from time to time. Reports suggest that the government is looking at Yuan6trn LGFV debt for local and central government debt until end 2027. This is designed to refinance the debt more easily; at cheaper rates and longer maturities and hence smoothing problems for weaker LGFV’s. It is questionable whether it will lead to much extra borrowing and stimulus from LGFV in the coming years, given official concern that some are overextended. What is happening to other non-financial corporate debt?
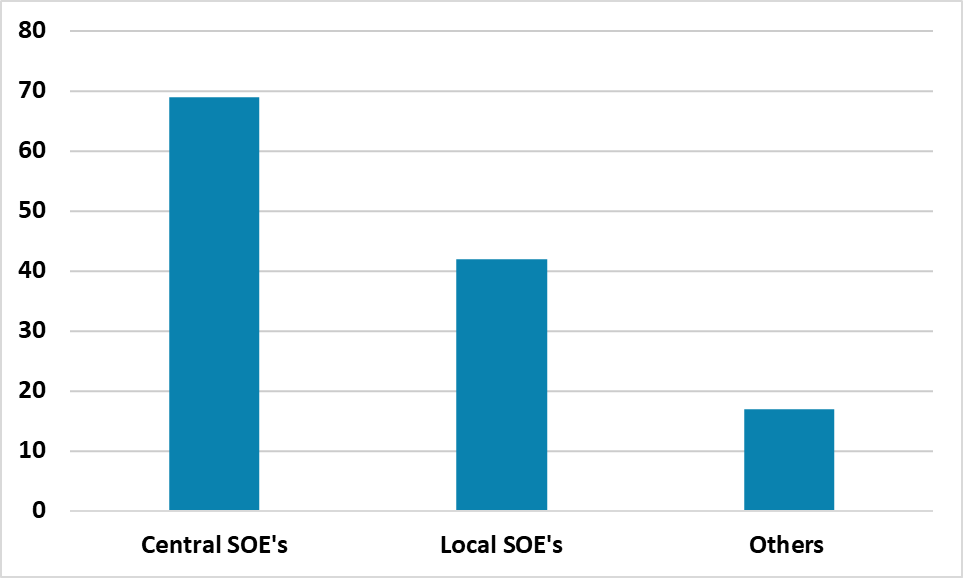
IMF granular data in the select issues report for Article IV in August (here), highlights that central and local SOE’s (Figure 2) have maintained leverage but not added to it but other private corporates have reduced leverage. Now a lot of this is property developers, but excluding private ex property developers the IMF suggest only 13% of firms reducing leverage. However, optimism among private businesses ex property developers is subdued, as business momentum has slowed compared to the 1990-2019 period and regulation and government intervention has become more noticeable. High tech private companies are in a better place than others due to government support and influence, but SOE’s will need to ramp up borrowing if it is too translate into higher investment. Even so, central and local SOE’s have higher debt/assets than private companies and low profitability (circa 2% return on assets), which means that SOE’s have not been naturally increasing leverage in the last few years. It could require government direction for this to occur. This puts the onus back on central and local government extra spending, where we will get more details late October (here).
Figure 2: Central/Local SOE and Private Non-Financial Debt (Yuan Trns)

Source: Datastream/Continuum Economics
