Equities: Still a Rocky Road in 2026
· Any deal between the U.S. and Iran would still be seen as a positive win in equities, as it would raise hopes that it could be followed by a multi-year settlement that could include more Iran oil and gas into the global energy markets and lower energy prices. No deal is also feasible, which would mean a partial reopening of the Straits of Hormuz and this would be neutral to mildly negative impact on equities. The odds of the war restarting are now low. Equities also have to deal with the reality of earnings growth for 2026, which we feel will likely be trimmed by the energy price shock but also physical shortages in certain oil products. Central banks have also turned from being a positive to neutral or mild negative for 2026.
· Overall, we stick with 7200 for end 2026 on the S&P500 as outlined in the March Outlook (here), which could be gradual or could still involve a 2nd correction in 2026 (if the softening of U.S. consumption surprises on the downside). Tech looks better than non tech. Elsewhere, EZ/Japan and China will find it difficult to see outperformance versus the U.S. Our favorite markets are Brazil and India on a 6-18 months timeline, with the next 6 months likely to be choppier.
April has seen a rebound in global equity market with hopes of prolonged ceasefire for the Iran war. What are the prospects for the remainder of 2026?
Figure 1: Key Energy Futures Prices (31/12/25 =100)
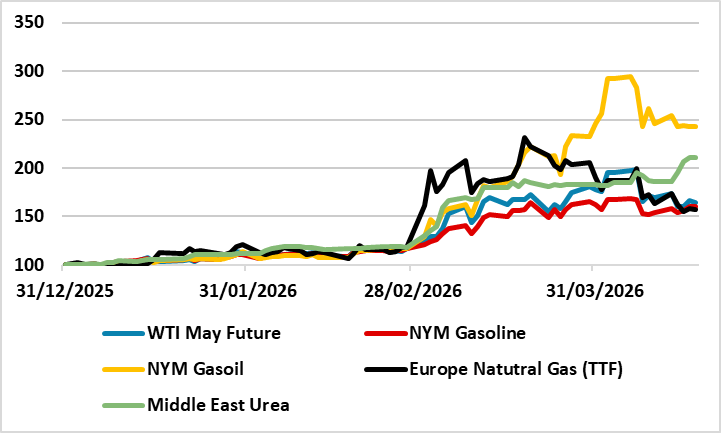
Source: Bloomberg/Continuum Economics.
With the U.S. pressuring Israel into a 10 day ceasefire in the Lebanon and talks ongoing between the U.S. and Iran, riskier financial markets have rebounded from the turmoil caused by the Iran war in March. We have long argued that the U.S. and Iran did not want a long war and a 2 week ceasefire could easily be extended, as both sides are reluctant to restart the war. However, reaching a comprehensive peace deal will be difficult and our baseline has been an end to hostilities and an understanding on reopening the Straits of Hormuz – which could be partially initially and may involve some tolls to Iran! The odds of the war restarting are now low. Equity markets forward looking nature means that the leaning is in this direction in terms of the strategic view, but will this drive equity markets still higher?
Any deal between the U.S. and Iran would still be seen as a positive win in equities, as it would raise hopes that it could be followed by a multi-year settlement that could include more Iran oil and gas into the global energy markets and lower energy prices. However, equities also have to deal with the reality of earnings growth for 2026, which has so far not seen a major reset (Figure 2). Corporate earnings will face a headwind from the Iran war in price terms through higher energy prices (Figure 1), which will have a direct P/L impact as the global consumer is modest rather than booming and will likely push back against cost increases. It is also worth mentioning that U.S. consumers sentiment are already been hit by the surge in gasoline and diesel prices, which has been less elsewhere as either taxes are a bigger portion (e.g. Europe) or subsidies are restraining feedthrough (e.g. EM Asia). We have noted that U.S. consumption growth is likely to slowdown in 2026 to the softer profile of wage increases and this could led to some softening of the U.S. economy and domestic U.S. earnings.
Secondly, physical shortages will start to appear across oil products (e.g. diesel/jet fuel) in the coming months, as inventories are run down to critical levels and products from Gulf refineries takes time to rebuild production and exports (e.g. Kuwait refinery suffered damage). This is already causing a premium of spot to future energy prices. In some sub sector this could disrupt/stop economic supply chain and activity and causes physical cost shocks to companies that are not apparent looking at energy futures prices alone. However, a certain amount of energy demand destruction is already occurring with Asia switching from LNG to coal power stations and easing the natural gas shock to much less than the Ukraine war natural gas crisis for Europe.
Figure 2: I/B/E/S 12mth Forward Earnings Growth (%)
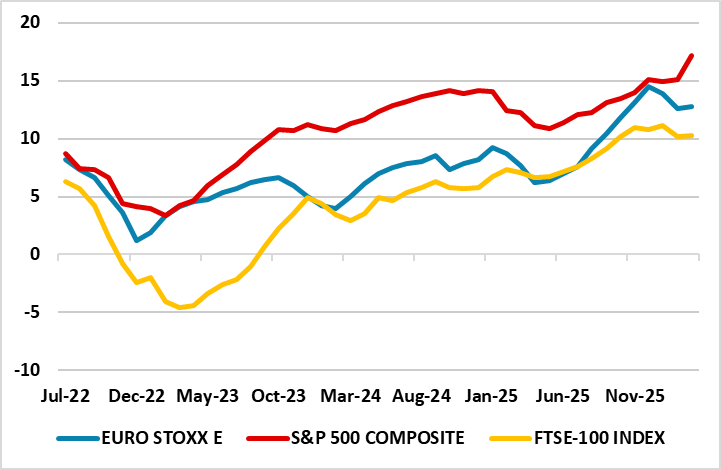
Source: Datastream/ Continuum Economics
Valuations in most major equity markets (Figure 3) are close to 10yr average except the U.S. and India, which is supportive but requires the Straits of Hormuz to reopen and corporate earnings not to be downgraded to help drive equity market substantively higher from current levels. The U.S. equity market is overvalued in fwd P/E terms and also versus real 10yr bond yields (Figure 4). However, our concern is with the non tech sector valuations, as the communication and information technology (S&P500) is a low 21.1 v 20.9 for the S&P500. Tech could see a positive valuation upgrade on more AI innovation/Nvidia Blackwell and Rubin chip rollout, but non tech could be hurt by a U.S. consumer that is suffering outside the top 20% in income and wealth terms.
Figure 3: 12mth Fwd Price/Earnings Ratios (%)
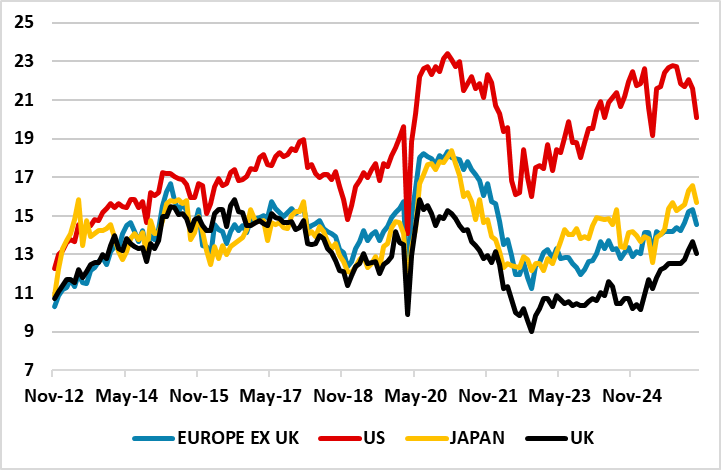
Source: Datastream/Continuum Economics.
Figure 4: 12mth Fwd S&P500 P/E Ratio and 10yr Real U.S. Treasury Yield Inverted (Ratio and %)
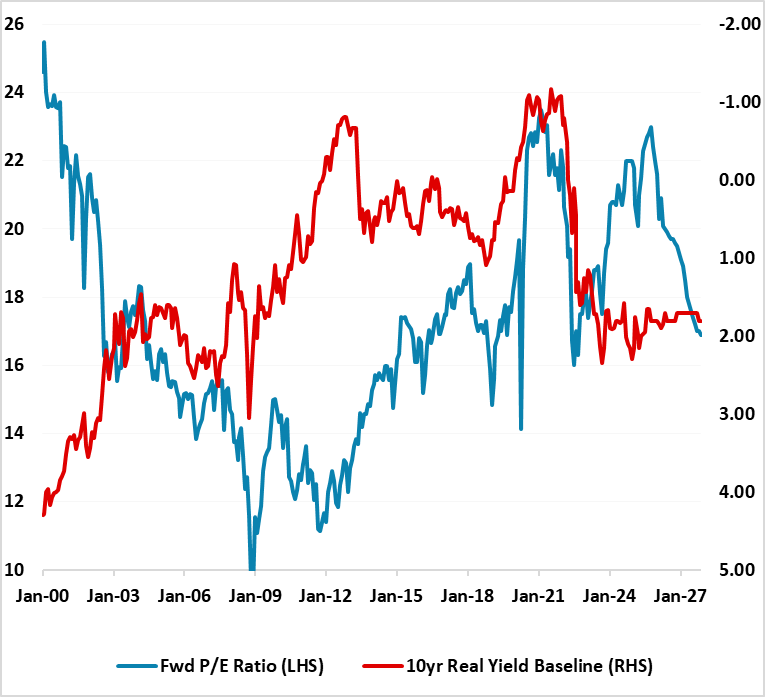
Source: Continuum Economics with forecasts to end 2027 for 10yr real bond yields and fwd P/E ratio
Overall, we stick with 7200 for end 2026 on the S&P500 as outlined in the March Outlook (here), which could be gradual or could still involve a 2nd correction in 2026 (if the softening of U.S. consumption surprises on the downside). The Fed is also a swing factor, with the April 29 FOMC meeting likely to see the Fed signal steady rates for now and a bias to look through 1st round inflation effects. However, it could be difficult for the Fed to deliver rate cuts in 2026 and a risk exist of them being pushed back to 2027 – a delayed positive for U.S. equities.
In terms of other major equity markets, the ECB is considering a rate hike as a signal against 2nd round effects. However, 2026 European natural gas prices are now over 10% below the ECB baseline in March 19, while the labor market/global supply/consumer picture are all different from 2022 (here). Our forecast is for no hike in 2026. An actual ECB hike would be a headwind to EZ equities in 2026, while we feel GDP growth will disappoint (March EZ outlook here) and so EZ equities could be choppy from current levels.
China equities have rebounded with other equity markets and are cheap versus China government bonds, but not equity only valuations. The biggest headwinds are that corporate earnings estimate for 2026 still appear too optimistic. China monthly data (here) is showing that consumption remains modest/residential property investment negative and private business hiring and investment is soft. Non tech corporate earnings growth estimates will likely be revised down, which will be a headwind to the market. China tech is doing interesting applications, but cannot buy Nvidia Blackwell and Rubin chips that rewidens the gaps in the AI race with the U.S. China can outperform the U.S. by 2.5% in the remainder of 2026, but no more.
Best prospects remain for Brazil and India as we outlined in the March Outlook equities article (here) for different reasons. For Brazil, given the relationship between 10yr yields and the fwd P/E ratio, a further rerating will likely be evident over the next 18 months. However, the BCB easing will likely remain modest, while the bond market will also remain concerned about fiscal policy ahead of an expected close presidential election in October 2026. Additionally, earnings growth has been trimmed as ultra-tight monetary policy feeds into economic slowdown and earnings rebound looks like a 2027 rather than 2026 story. We can see no outperformance versus U.S. equities for the remainder 2026 if Lula wins the presidential election, but 5-10% if Flavio Bolsonaro wins – all a Q4 story. Late 2026 and 2027 should then be better, with consistent BCB easing helping to bring down yields and allowing a fall in fwd earnings yields that sees the price/earnings ratio moving above 12. 10-15% 2027 outperformance versus the U.S. should be on the cards.
India’s equities had a bad March on Rupee weakness and Iran war energy shock. We expect the latter to reverse through the remainder of 2026 on our Iran war baseline, but a modest rebound is only likely in H2 2026 – a 2-6 month war is a 30% alternative scenario and could cause a further 10% index decline given India’s energy dependency. Market valuation is less overstretched but still above multi-year fair value measures, while India’s equity to bond yield spread is now modestly unfavorable. Concerns are also growing that India’s IT services sector could become a net AI loser. However, solid 15% 2026 corporate earnings growth expectations should help the P/E derate further, but also allow enough for a H2 2026 rally and we see scope to outperform U.S. equities by 5% by end 2026. 2027 should be better for India’s equities in absolute terms, as corporate earnings feed more into market levels and less into multiple deratings, and we see 10-15% outperformance versus the U.S.