Equities Outlook: Navigating Cyclical and Structural Forces
· For global equities, our baseline (here) is for a 4-8 week Iran war, with WTI down to USD80-85 by June; USD65-70 end 2026 by June and USD60 by Q3 2027. A fragile situation will mean it will take until 2027 for energy prices to return to pre-war levels. On a multi-quarter basis this would mean only temporary economic effects and a refocus on underlying cyclical and structural forces.
· In the U.S. we see a 10% correction in H1 2026 driven by the Iran war and consumption slowing due to lower (real) wage growth, which could find a bottom at 6000. This should be followed by a H2 2026 rebound on Fed easing that brings the S&P500 to 7200 by year-end 2026. Core tech equities could return to support the market later in the year, especially as the rollout of Nvidia Blackwell and Rubin chips accelerate AI again. In terms of 2027, U.S. job losses from AI could be more noticeable and cause a fear factor among consumers that dents consumption and growth. The economic cycle will also be more mature. This risks a new deeper correction in the overvalued U.S. equity market. We see the S&P500 at 7000 by the end of 2027.
· For EZ equities, a clear new catalyst is needed for significant outperformance versus the U.S., and a further 25bps ECB cut is unlikely to be enough now that the market is slightly overvalued – though we do not see the ECB actually hiking. UK equities will remain restrained by fiscal consolidation and volatile UK politics, though BOE rate hike fears are likely overdone given the weak labor market, and easing will arrive into 2027. Finally, Japanese equities are too still optimistic on new reflation policies in 2026, but corporate reform and higher return on equity can drive modest outperformance versus the U.S. in 2027.
· In EM equities, 2026 can see China struggling to outperform the U.S., as non-tech sectors face the cyclical challenge of modest consumption and the ongoing residential property bust. Indian underperformance should end in H2 2026 as good corporate earnings growth will partially feed into the market level with the fwd P/E ratio less overvalued. Finally, Brazilian equities will likely not outperform the U.S. in the remainder of 2026, as valuations have run ahead of bond yield declines. Slow BCB easing and fiscal uncertainty before the October 2026 presidential election will restrain the market. 2027 will be a better year for Brazil.
· Risks to our views: A 2-6 month Iran war would prompt a stagflationary hit to U.S. equities via pressure on corporate earnings/valuations and the Fed not being able to cut. This could produce a deeper correction to 5500. This is a 30% risk scenario. However, genuine fears of a mild recession would be needed for larger multiple deratings and more prolonged selloff . Other global equity markets would likely sell off broadly in line with the U.S. equity market in this alternative scenario.
Figure 1: 12mth Fwd S&P500 P/E Ratio and 10yr Real U.S. Treasury Yield Inverted (Ratio and %)
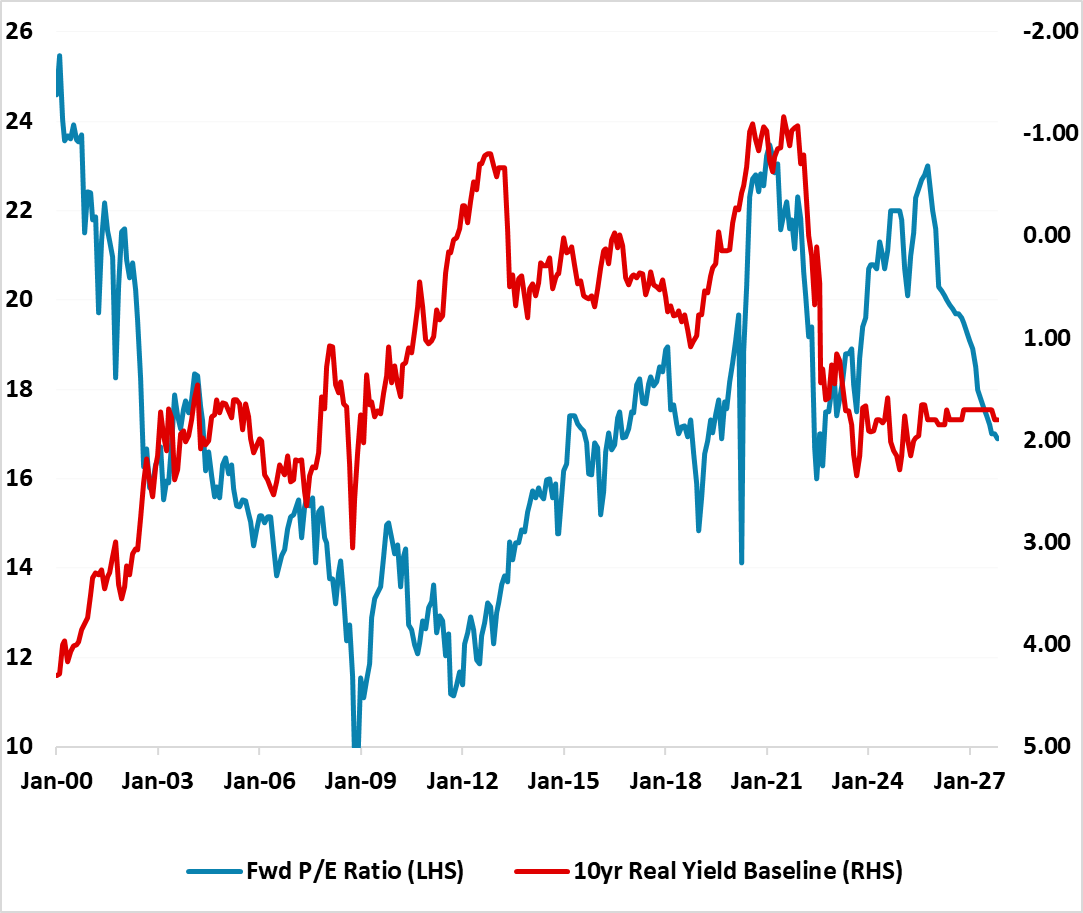
Source: Continuum Economics with forecasts to end 2027 for 10yr real bond yields and fwd P/E ratio.
The U.S. equity market has traded weaker in Q1 2026 and key forces for the rest of 2026 and 2027 are:
· Iran war. Our baseline (here) is for a 4-8 week war, USD80-85 by June; USD65-70 end 2026 by June and USD60 by Q32027. This would mean only temporary economic effects, though we now see this delaying Fed easing until Q3 2026. H1 2026 corrective pressures from the Iran war would then be less evident.
· Soft Landing. Economic data has been good in H2 2025 and the market expects this picture to be sustained in 2026. However, aggregate whole economy wage growth has been slow, due to low immigration and employment growth. We see consumption slowing in 2026, which can cause some economic concerns. Even so, the U.S. economy can muddle through on an AI Capex boom and balance sheet strength of middle to upper income U.S. households. In 2026, this could all be an excuse for a further modest correction, but nothing greater. We are more nervous about 2027, as the economic cycle will be more mature, mid-term elections will then likely stop any further fiscal stimulation and the Fed will likely have ended easing.
· AI/Tech wave remains but winners and losers. AI semiconductor and hyperscalers are in a modest corrective phase, while the market is also focused on AI losers like software services. However, the AI investment boom continues to be largely financed by cashflow and moderate bond issuance ex Open AI/Oracle, while AI application revenue continues to boom. What is happening is a valuation reset for big tech, and a further 10% could be enough to get fwd P/E ratios for IT and Communications down to levels that have previously attracted real money flows. To get a deeper correction in these sectors would require a significant slowing in exponential AI applications revenue growth, much tighter regulation or a major AI accident (e.g. major cyberattack) - none of which are moderate or high probability in 2026. Core tech could return to support the market later in the year, especially as the rollout of Nvidia Rubin and Groq based LPU chips accelerate AI again. The broader AI story will likely lift productivity and U.S. GDP and produce wider benefits in the next 1-10 years, with the key uncertainty whether this will be modest or moderate (here). Open AI certainly has stretched finances, but this may come more to a head in 2027/28 when the rate/credit cycle starts to turn rather than in 2026. For 2026, the AI economic and investment wave can still prompt an adverse impact on AI losers in the U.S. economy and cause a derating of select companies that are vulnerable to AI displacement. An interrelated issue is whether AI leads to modest net job losses or large losses, which Fed officials are starting to focus on (here). In the worst case, it could widen perceptions of a K shaped economy, but also undermine future U.S. government income tax revenue prospects if heavy job losses are seen and strain fiscal finances. We see this being a 2027-29 story rather than 2026.
· Buybacks. If the economy sees a soft landing then buybacks can be counted on to continue at an aggressive pace. A harder landing would likely slow buybacks and amplify a correction, but this is only a 20% probability risk.
We are still concerned the U.S. equity market is still overvalued on a broad array of equity valuation measures and also against 10yr real bond yields (Figure 1). If the economy sees a soft landing then 2% real yields are likely to remain in place, which places a strain on the equity market. Meanwhile, peak valuations do not last years but rather months and quarters. 2022 sky high valuations were noticeable from January 2021 to April 2022 before major P/E de-rating occurred. Extremely elevated valuations (CAPE P/E over 40) existed January 1999 to September 2020, before valuations cracked and caused a bear market. A prolonged Iran war would be a major catalyst, but we attach a 30% probability to this alternative scenario that could knock the S&P500 down to 5500-6000.
Our baseline for 2026, we feel is for a 5-10% correction driven by the Iran war and consumption slowing to lower wage growth, before a H2 2026 rebound on Fed easing that brings the S&P500 to 7200 by the end of 2026.
In terms of 2027, job losses from AI could be more noticeable and cause a fear factor among consumers that dent consumption and growth. The economic cycle will be more mature. This risks a new deeper correction in the overvalued U.S. equity market. We then see a recovery to 7000 by year-end 2027.
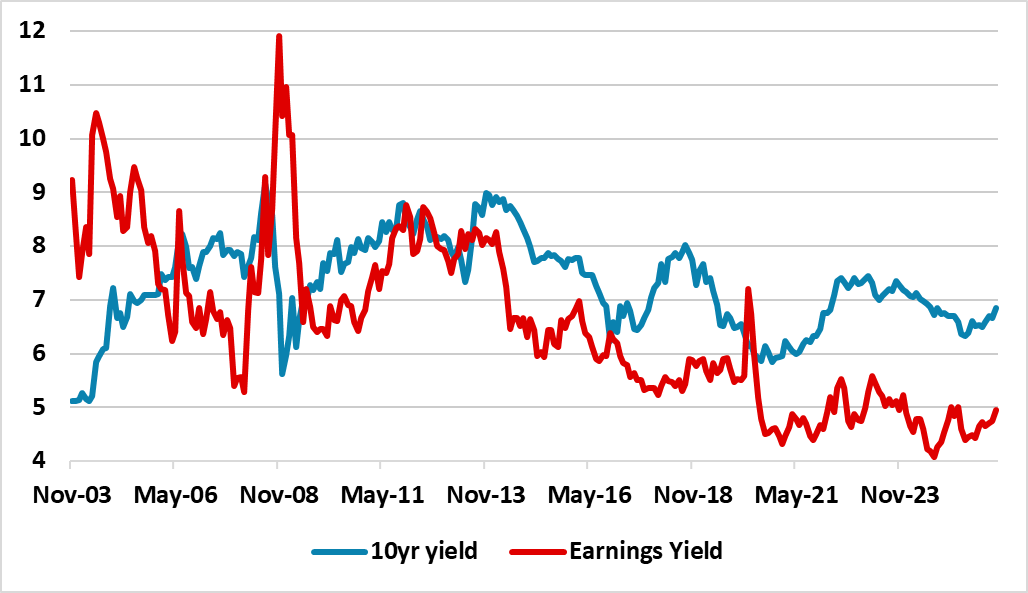
Figure 2: Germany/UK 12mth Earnings Yield minus 10yr Real Government Bond Yield (using 10yr breakeven inflation)
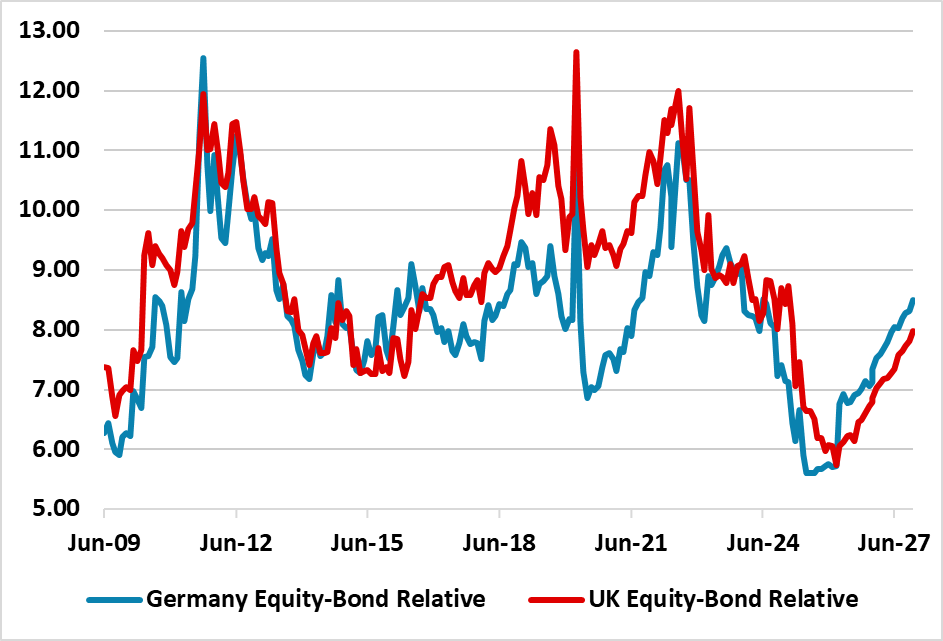
Source: Continuum Economics. Continuum Economics projections until end-2027 using 10yr breakeven inflation and Bund/Gilt yield forecasts.
EZ equities have retraced with the Iran war given its energy import dependency, but a 4-8 week war should provide some energy price relief in H2 relief and only temporary economic effects (the alternative of a 2-6 month Iran war would deepen the correction in EZ equities, especially if further damage were seen to Qatar LNG facilities). This can allow a refocus on the fundamentals in H2. EZ has seen the worst of Trump tariffs, as he becomes more constrained by the Supreme Court and voters cost of living concerns – we also see an eventual negotiated settlement on Greenland (here). However, corporate earnings have been trimmed on the margin, which reflects only a modest economic recovery. Though Germany is being helped by a cyclical recovery and extra fiscal spending on defense and infrastructure, France restrained by an adverse budget deficit and political splits – Italy is also fiscally restrained by multi-year fiscal consolidation needs. Spain is a bright spot, but is past its cyclical peak.
Equity-bond valuation for EZ equities are better than the U.S., but Germany is now tight relative to post GFC history (Figure 2) and the 12mth fwd P/E ratio is now just back to fair value. We do not see the ECB hiking due to economic slack and already tight financial conditions. Though we look for one further 25bps cut from the ECB in Q4 2026, this is not enough in itself to see EZ equities clearly outperforming. Finally, any Ukraine peace deal will likely not arrive until into 2027, while the EZ/EU remain reluctant to get addicted to cheaper Russian gas again. This all means that EZ equities do not have a clear new positive story to further outperform U.S. equities in the next 9 months, apart from portfolio diversification away from the U.S. We see no renewed outperformance versus the U.S. in 2026. 2027 will likely see ongoing EZ economic recovery which can help EZ equities mildly outperform the U.S, as we are negative on the U.S. Even so, the French fiscal mess will likely come into sharper focus as the May 2027 presidential election looms, but the prospect is that the equally important parliamentary election may not occur before 2029.
Figure 3: Japan 12mth Earnings Yield and 10yr Nominal Government Bond Yield (%)
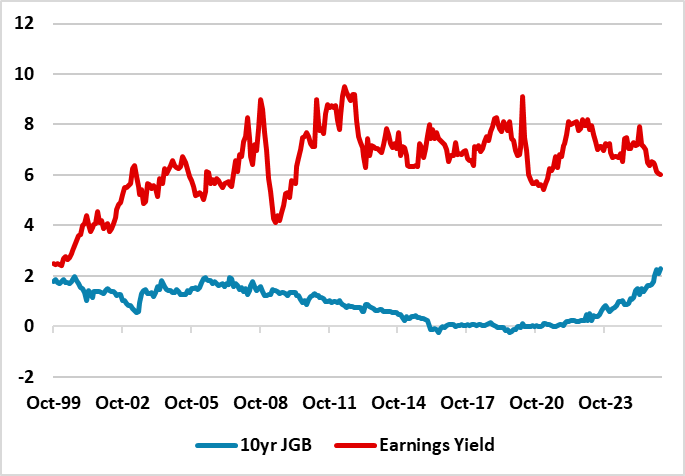
Source: Datastream/Continuum Economics. UK real yield uses RPI instead of CPI.
Japan’s equities had a great couple of months helped by Takaichi achieving a majority in the 2nd election before the Iran war prompted profit-taking. However, with optimism that corporate reforms will boost returns on equity and NISA savings boom, this has still left the market slightly overvalued. 2026 corporate earnings growth estimates have started to be trimmed, as 2-3% nominal GDP growth restrains actual earnings. Additionally, though we only see one further 25bps BOJ hike in 2026, we do not see the BOJ QT acceleration stopping until an accident occurs in the JGB market from the huge supply pressures. This could happen by mid-2026, which would likely see a BOJ partial U turn on QT and a pause in further BOJ policy rate hikes. This could mean that the remainder of 2026 sees volatile trading and underperforms the U.S. However, 5% outperformance can be seen in 2027, with a weaker U.S. equity market and a steady BOJ leading to a refocus on still favorable equity-bond yield relatives (Figure 3). A sharp rebound in the extremely undervalued JPY could, however, hurt the market for multiple months. A 2-6 month war in our alternative scenario would mean a deeper correction in the coming months.
Re UK equities, the FTSE 100 has held up better than the U.S. so far in 2026, helped by commodity optimism. Though the Iran war has stopped BOE easing hopes, we do not see the BOE hiking due to a weak labor market. Additionally, our baseline is for a 4-8 week war and inflation fears to reverse in H2. This can help UK equities, though the market looks overdone on commodities as a driver. Additionally, UK mid-term political turbulence will likely reach new heights after the May local and Scottish elections, with a real risk of a softening of the UK fiscal rules (here). This could mean mild underperformance versus the U.S. in 2026. 2027 can see the UK outperforming by around 5%, but by the market standing still and the U.S. equity market going down.
Overall, other DM equity markets will likely not outperform U.S. equities in 2026 and 2027, as less stretched valuations are offset by domestic economic and fiscal issues.
Emerging Markets
China’s equity market needs a new catalyst, but the March NPC fiscal stimulation was modest rather than aggressive (here) and the Iran war hurting GDP momentum and prompting a modest correction. Combined with a reluctance to ease monetary policy for fear of hurting bank margins, the stimulus is providing support to avoid an economic slowdown rather than speeding up growth. Consumption remains modest due to adverse wealth effects from the housing market and weak consumer confidence as wage and employment growth remains weak. Add in the ongoing multi-year drag from residential property and the China non AI/high tech manufacturing sector faces headwinds. A U.S./China comprehensive trade deal would be a positive catalyst, but this now looks to be only a 20% probability in the next 2 years, as Trump’s Supreme Court defeat reduces the incentive for China to strike a deal – though China authorities will want to keep the trade truce to avoid section 301 sanctions by the U.S. We expect nominal GDP of around 5.0% in 2026, which suggests that 2026 corporate earnings estimates will be trimmed as the year goes on. Meanwhile, though China tech is making progress with cost effective AI solutions, U.S. AI models will open a gap in the next 6-18 months with Nvidia Blackwell and Rubin chips that are not available in China. Finally, valuations are no longer cheap in equity terms or against real government bond yields (Figure 4), though some are looking at earnings yield-nominal government bond yield spreads to support the market. China’s 2026 corporate earnings growth can push the market higher, but without further P/E multiple expansion. Our baseline is a for 4-8 week Iran war and China will likely see similar gains to the U.S. in H2 2026.
2027 can see a 2.5-5% outperformance versus the U.S., but driven by tech – though given our U.S. equity call, this means the index going sideways. Non tech is slightly overvalued, and will still face the challenge of modest consumption and the ongoing residential property bust, alongside a profit margin squeeze from excess of production over domestic demand.
Figure 4: China Earning-Bond Yield Relative Cheap Compared to Other Big EM’s (%)
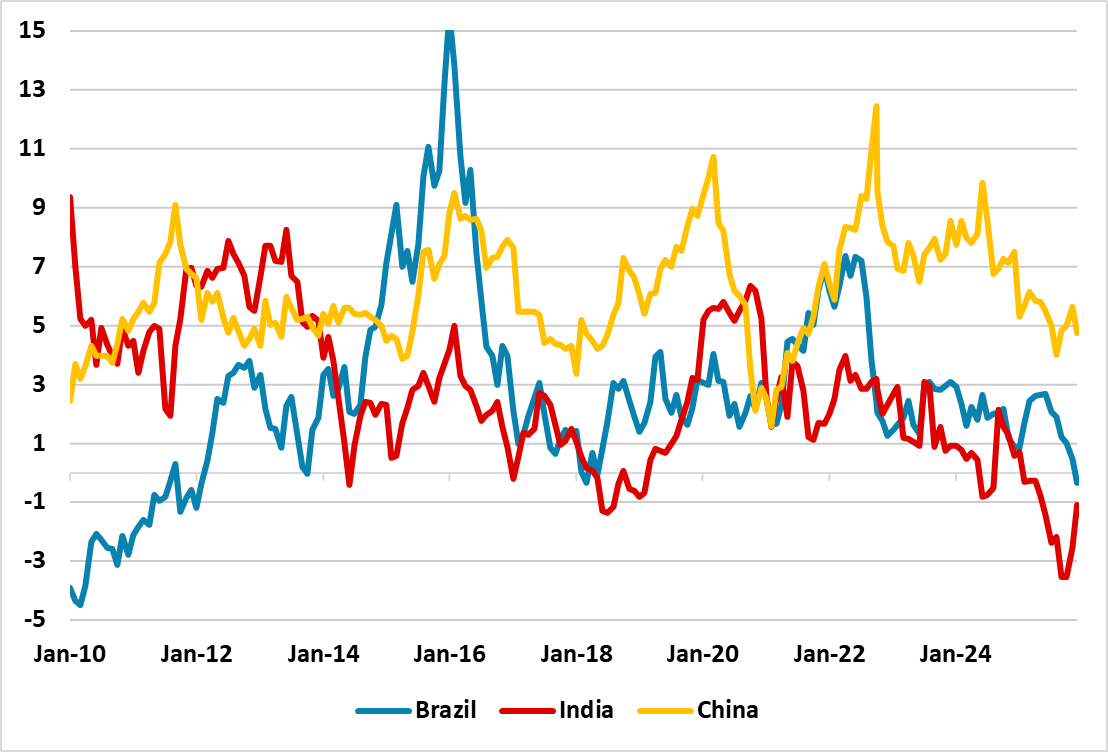
Source: Continuum Economics. CAPE Earnings Yield-10yr Real government bond yield
India’s equities underperformance has grown on Rupee weakness and Iran war energy shock. We expect the latter to reverse through the remainder of 2026 on a 4-8 week war baseline, but a modest rebound is only likely in H2 2026 – a 2-6 month war is a 30% alternative scenario and could cause a further 10% index decline given India’s energy dependency. Market valuation is less overstretched but still above multi-year fair value measures, while India’s equity to bond yield spread is now modestly unfavorable (Figure 5). Concerns are also growing that India’s IT services sector could become a net AI loser. However, solid 15% 2026 corporate earnings growth expectations should help the P/E derate further, but also allow enough for a H2 2026 rally and we only see scope to outperform U.S. equities by 2.5% by end 2026. 2027 should be better for India’s equities in absolute terms, as corporate earnings feed more into market levels and less into multiple deratings, and we see 10-15% outperformance versus the U.S.
Figure 5: India 12mth Fwd Earnings Yield-10yr Nominal government Bond Yield (%)
Source: Datastream/Continuum Economics.
Brazil has fallen alongside the global equity market amid economic fears from the Iran war, but our baseline is for a 4-8 week war and this should stabilize the market in Q2 - but what happens then? Brazil’s equities outperformance in January and February, had been helped by commodity prices and hopes of BCB easing in the coming quarters driving the fwd P/E higher. Given the relationship between 10yr yields and the fwd P/E ratio, a further rerating will likely be evident over the next 18 months. However, the BCB easing will likely remain modest, while the bond market will also remain concerned about fiscal policy ahead of an expected close presidential election in October 2026. Additionally, earnings growth has been trimmed as ultra-tight monetary policy feeds into economic slowdown and earnings rebound looks like a 2027 rather than 2026 story. We can see no outperformance versus U.S. equities for the remainder 2026 if Lula wins the presidential election, but 5-10% if Flavio Bolsonaro wins – all a Q4 story.
Late 2026 and 2027 should then be better, with consistent BCB easing helping to bring down yields and allowing a fall in fwd earnings yields that sees the price/earnings ratio moving above 12. 10-15% 2027 outperformance versus the U.S. should be on the cards.