Markets: Short vs Long Iran War
· For a 4-8 week war and 3-4 quarters of energy price normalisation, we see a 10% U.S. equity market correction in H1 2026 driven by the current Iran war and/or consumption slowing due to lower (real) wage growth, alongside still stretched valuations in equity and equity-bond terms. Then we see this being followed by a H2 2026 rebound on Fed easing that brings the S&P500 to 7200 by year-end 2026. 10yr U.S. Treasury yields down to 4.0% by end 2026 and EUR/USD at 1.24.
· For a 2-6 month war scenario a number of issues impact the macro and policy outlook. Firstly, whether the post war period could involve limited/partial or full Straits of Hormuz shipping. Issues 2-5 are labor market tightness/global supply pressures/consumption patterns and new fiscal support and stimulus. We feel that all four of these in either scenario would be less than during the 2022 Ukraine war and could dampen rather than amplifying inflation pressures. This could restrict DM 2026 policy tightening in this scenario and mean 2027 rate cuts!
· U.S. equities would see a stagflationary hit via pressure on corporate earnings/valuations and the Fed not being able to cut initially. This could produce a deeper correction to 5500-6000. However, genuine fears of a mild recession would be needed for larger multiple deratings and more prolonged selloff. 10yr U.S. Treasury yields could reach 4.50-4.75% with USD150 oil prices. However, U.S. real yields are reasonable and this should be a restraint to the scale of a U.S. yield rise. Any more aggressive U.S. equity selloff, plus signs of a hard landing, would likely fuel a rush into U.S. Treasuries. If the Fed shows sensitivity to the slowing economy, then this could drive 10yr yields down to 3.50%. USD could initially go higher on USD150 oil prices, but then get whipsawed if U.S. equities see a deep pullback/bear market and the Fed eases on the economy. Higher yielding AUD and NOK are our favourite safe havens.
What would the Outlook be for financial markets for a 4-8 week war versus a 2-6 month war?
Figure 1: Iran War Scenarios and WTI Oil Price Projections
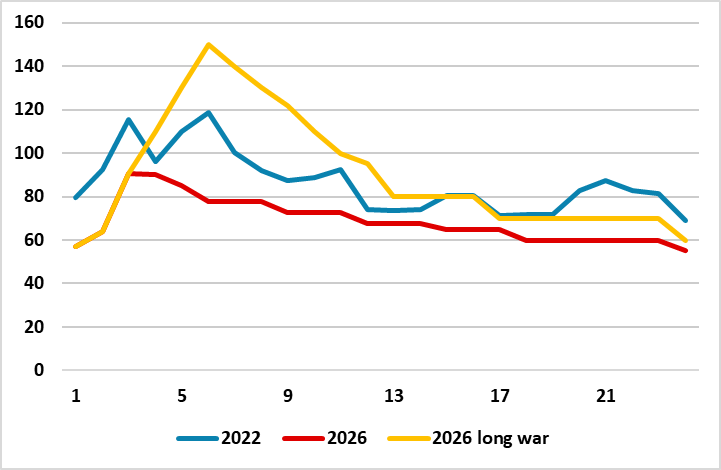
Source: Continuum Economics.
In our Iran war scenarios (here) we attach a 65% probability to a 4-8 week Iran war, with the end of hostilities followed by at least a partial reopening of the Straits of Hormuz – though it is possible that a limited ceasefire could be agreed that sees a fuller reopening of the Straits of Hormuz. The main alternative scenario (with a 30% probability) is a 2-6 months Iran war, with the end of hostilities followed by a partial reopening of the Straits of Hormuz. Figure 1 shows our projection of WTI oil prices based on these two scenarios and compared to the 2022 Ukraine war. The wide range forecast for the 2-6 month reflects different potential duration of the war and also the scale of further energy infrastructure damage. For more details see the March Commodity Outlook (here).
Natural gas prices are also impacted as 20% of global LNG goes through the Straits of Hormuz, but this is 2% of global gas consumption. Thus the gas market disruption will likely not be as acute as the cut off of Russian gas pipelines to Europe during the Ukraine war that caused a super spike in European gas prices (Figure 2).
Figure 2: Iran War Scenarios and TTF Natural Gas Price Projections
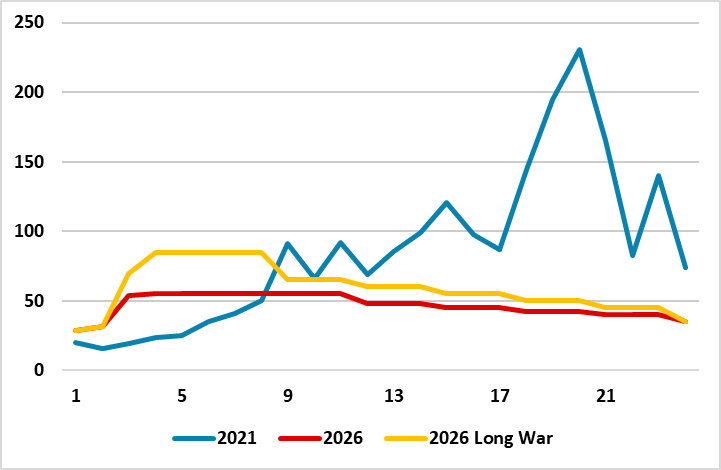
Source: Continuum Economics.
The other big export through the Straits of Hormuz are Fertilizers, especially Nitrogen (Urea and Ammonia) and Sulphur/Sulphuric acid – the latter also used by the metal industry. We have two concerns. Firstly, the price of Urea fertilizers could exceed the Ukraine war peak (Figure 3). Secondly, high Urea prices and disrupted supplies could cause farmers to reduce the use of Nitrogen, which could impact 2026 and 2027 global crop production; rundown inventories and put upwards pressure on grain prices and then into food prices. This is a global issue, but most impacts EM countries in Asia and Africa that are reliant on Middle East Urea.
Figure 3: Iran War Scenarios and Urea Price Projections
Source: Continuum Economics.
What will be the macro and policy impact? Figure 4 provides an overview. Our GDP growth forecasts are revised down marginally (except U.S. where base effects help); CPI by around 0.5% in 2026 and then partially reversed in 2027.
Figure 4: Scenario Assumptions for the Next 12 Months
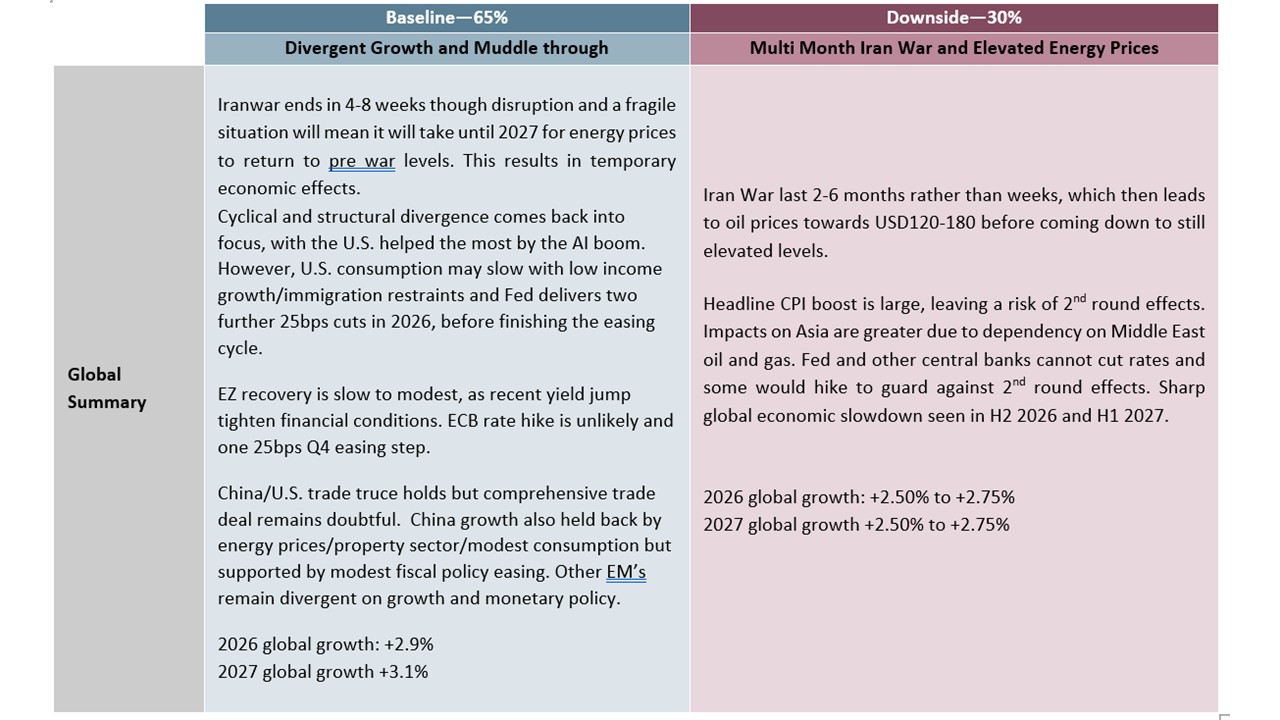
Source: Continuum Economics. Other scenario is upside surprises at 5%
We would highlight four factors. Firstly, consumption trends at end 2025 were soft in the big 3 of the U.S./EZ and China. EZ reflects cost of living pressures, while China reflects adverse wealth effects from the property bust and slow wage growth. The U.S. faces a K shaped consumption pattern, with the top 20% of households spending freely but the other 80% worrying about cost of living. The picture in 2022 when the Ukraine war hit was different (Figure 5), with EZ consumption rebounding from depressed COVID levels; China depressed by late COVID shutdowns and the U.S. had seen most of its recovery in 2021. Consumer confidence is already being hit by the Iran war, which could result in a more cautious consumer in 2026.
Figure 5: U.S./EZ Real Consumption and China Nominal Retail Sales (% Yr/Yr)
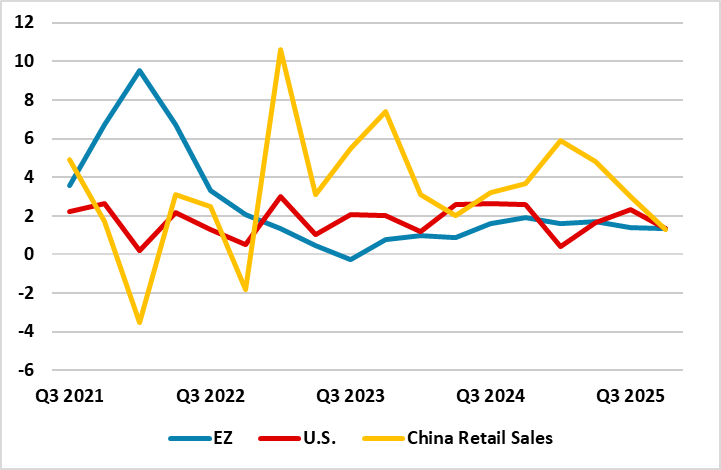
Source: Datastream/Continuum Economics
Secondly, labour markets are not tight in contrast to 2022 (Figure 6) and were normal or soft entering 2026. Crucially we feel that this restricts wage setting and reduces 2nd round effects on the 4-8 week war scenario. Combined with the extra budget for essential oil and natural gas, this can hurt consumption and produce a slight to modest GDP hit.
Figure 6: Vacancy Rates (%)
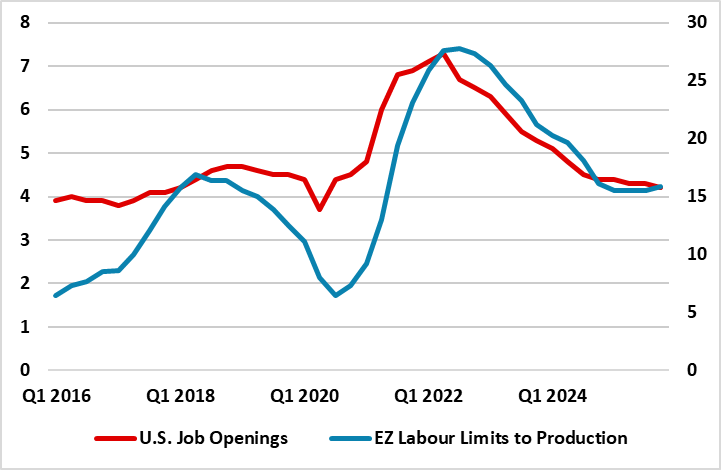
Source: Datastream/Continuum Economics.
Thirdly, global supply chain pressures were not evident before the Iran war (Figure 7), but were already elevated by COVID before being amplified by the Ukraine War in 2022. Additionally, China is super keen to provide lots of goods at competitive prices, both due to spare capacity and given the noticeable real depreciation of the Yuan in the last 4 years. On our baseline of 4-8 week war we do not see supply pressures jumping significantly and even in 2-6 month war the global supply chain problems would likely be below the Ukraine war highs.
Figure 7: NY Fed Global Supply Chain Supply Pressure (SD from Average)
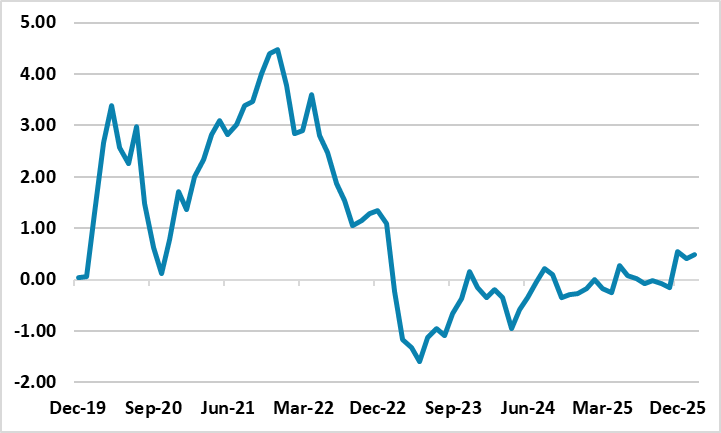
Source: Datastream/Continuum Economics.
Fourthly, governments are now more fiscally constrained than in 2020 or 2022. 2020 saw very aggressive fiscal policy easing during the COVID crisis. 2022 was less, as the U.S. was insulated by low natural gas prices and EZ was unwinding COVID expenditure at the same time as temporary energy subsidies/price caps were being introduced to deal with the natural gas crisis. In 2026 a further U.S. fiscal package is unlikely, given the splits in Congress. EZ has some stimulus coming from Germany and 2020 EU funds, but France/Italy/UK have little or no fiscal space. China 2026 fiscal stimulus is the same size as 2025, with China authorities actions constrained by the surge in the general government debt/GDP.
Figure 8: Cyclically Adjusted 2022 v 2026 Net Fiscal Stimulus (+) or Contraction (-)
| 19 to20 (COVID) | 22 TO 23 (Ukraine) | 25 to 26 | |
| China | 2.5 | -0.4 | 0 |
| Eurozone | 3.4 | -0.2 | 0.3 |
| U.S. | 5.0 | 0 | 0 |
Source: IMF October Fiscal Monitor October 2025/Continuum Economics.
This all feeds into our GDP/inflation and policy forecasts in Figure 9. We feel that market expectations of ECB and Fed tightening are misplaced, as demand is not as strong as 2022; labour markets are not as tight as 2022; fiscal policy is not really supportive and global supply chain inflation pressures should mainly be in energy/fertilizers. On a 4-8 week war, this means a slight to modest GDP hit (except U.S. helped by the AI boom) and higher 2026 CPI inflation followed by lower in 2027. We also feel that financial conditions have tightened too much and alongside sluggish lending growth argue for some further monetary policy stimulation in late 2026 as monthly CPI numbers show a more controlled profile. What happens with a 2-6 months war?
Figure 9: U.S./EZ/China Forecasts on a 4-8 Week War Scenario (%)
| 2026 GDP | 2027 GDP | 2026 CPI Inflation | 2027 CPI Inflation | End 2026 Policy Rate | End 2027 Policy Rate | |
| U.S. | 2.2 | 1.8 | 3.2 | 2.2 | 3.13 | 3.13 |
| EZ | 0.6 | 1.2 | 2.2 | 1.9 | 1.75 | 1.75 |
| China | 4.2 | 4.2 | 1.4 | 0.1 | 1.3 | 1.2 |
Source: Continuum Economics.
Our 4-8 week scenario is stylized, as it could involve limited/partial or full Straits of Hormuz shipping. The 2-6 month is of variable length, but would see little shipping during the hostilities and could involve limited/partial or full Straits of Hormuz shipping. Anything over 2 months has a more acute impact on the oil market, as strategic oil reserves are currently capping oil prices and it is difficult to see a further major IEA strategic release. This would mean that oil prices would have to price for demand destruction for the crude oil and products that could not be diverted by Saudi Arabia/UAE pipelines.
The 2nd complexity for a long war is that further energy infrastructure could be damaged, with the most high profile so far being the 17% of Qatar export facility that will take 3-5 years to rebuild.
The 3rd issue is what economists call non-linearities. Economists work on a rough rule of thumb that a 10% increase in oil prices knocks 0.1 ppt off global GDP and adds 0.2 ppt to inflation (with some country variations depending on energy intensity/subsides and import dependency). However, in 2022 the non-linearities of the post COVID period for global supply; labour markets and company profiteering, amplified the inflation impact. As we have argued above the starting point is much better and we do not expect the effects to be amplified. Indeed, some labour market slack, plus fragile consumers, could actually dampen the inflation effects – especially on a 2nd round basis.
The final complexity is the monetary policy reaction function, which is not straightforward. If central banks expect none or small 2nd round effects, then steady policy initially would be appropriate, then policy set on underlying conditions. If the energy price shock is larger and 2nd round inflation effects are larger than some central banks with an inflation mandate could tighten. The ECB could hike by 50bps in this alternative scenario (it hiked in 2008 and 2011), but then as 2nd round effects are not as bad as feared could cut by 75bps in 2027! If financial conditions tighten and GDP takes a bigger hit than the models suggest, then central banks would face a dilemma as an argument to cut interest rates would exist. Our 2-6 month Iran war scenario would likely stop the Fed from easing further initially. However, if the shock caused a recession, then the Fed would likely cut policy rates to 2% or lower!
Figure 10 has our central range for GDP/CPI inflation and policy rates in the 2-6 month scenario, which reflects the issue above. This is a central range rather than a full range to try to provide some illustration.
Figure 10: U.S./EZ/China Forecasts on a 2-6 Month War Scenario (%)
| 2026 GDP | 2027 GDP | 2026 CPI Inflation | 2027 CPI Inflation | End 2026 Policy Rate | End 2027 Policy Rate | |
| U.S. | 1.6-2.0 | 1.0-1.7 | 3.6-4.6 | 1.8-2.4 | 2.5-3.5 | 2.0-4.0 |
| EZ | 0.0-0.5 | 0.6-1.0 | 2.8-3.4 | 1.6-2.3 | 1.5-2.5 | 1.5-2.0 |
| China | 3.9-4.2 | 3.8-4.0 | 1.8-2.8 | -0.6-+1.0 | 1.2-1.3 | 1.1-1.2 |
Source: Continuum Economics.
Markets
What should financial markets do? Price for the most probable outcome? Be willing to dump the idea of 4-8 weeks, if Iran continues a hard line on ending the war and reopening the Straits of Hormuz?
Alongside, our economic Outlooks, we published 3-24 month forecasts and views for DM Rates (here), DM and EM Equities (here); DM FX (here) and EM FX (here). These are guided by our baseline 4-8 week war view and the modest macro impact. For the U.S. government bond market, slowing consumption will likely help deliver a Q3 25bps (Figure 11) cut from the Fed and a Q4 move and lower 2yr yields, though 2yr yields will move to a positive spread versus Fed Funds as occurs at the late stage of a Fed easing cycle. With choppy 10yr yields, this can see one last yield curve steepening phase, before slow yield curve flattening in 2027.
In the U.S. we see a 10% correction in H1 2026 driven by the current Iran war and/or consumption slowing due to lower (real) wage growth, alongside still stretched valuations in equity and equity-bond terms (Figure 12). Then we see this being followed by a H2 2026 rebound on Fed easing that brings the S&P500 to 7200 by year-end 2026. Core technology equities could return to support the market later in the year, especially as the rollout of Nvidia Blackwell and Rubin chips accelerate AI again. In terms of 2027, U.S. job losses from AI could be more noticeable and cause a fear factor among consumers that dents consumption and growth. The economic cycle will also be more mature. This risks a new deeper correction in the overvalued U.S. equity market. We see the S&P500 at 7000 by the end of 2027.
Figure 11: Fed Funds, 2, 10 and 30yr U.S. Treasury Yields Forecasts (%)
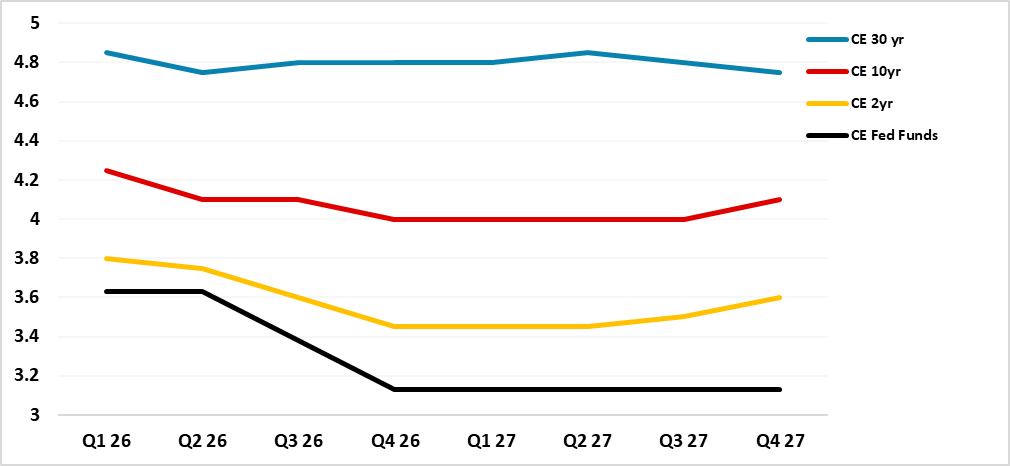
Source: Continuum Economics
Figure 12: 12mth Fwd S&P500 P/E Ratio and 10yr Real U.S. Treasury Yield Inverted (Ratio and %)
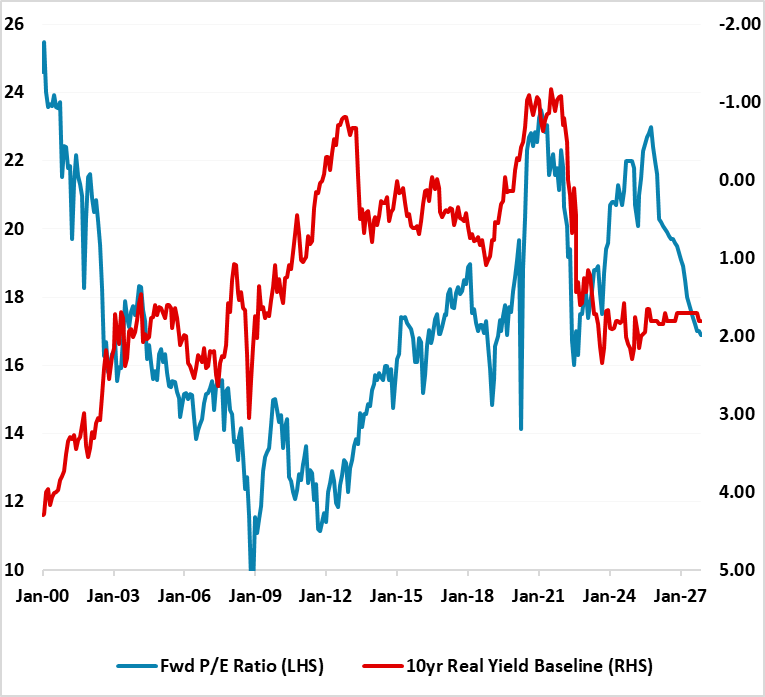
Source: Continuum Economics with forecasts to end 2027 for 10yr real bond yields and fwd P/E ratio.
In DM FX, as energy prices ratchet down through the course of 2026 we would see the EUR starting to recover ground on the understanding that the economic hit is temporary. Additionally, 10yr Bund yields have narrowed structurally versus the U.S. (Figure 13) with Germany huge defense and infrastructure spending kicking in throughout 2026. We can see EUR/USD returning to 1.20 by end 2026. For 2027, we generally feel that the overvalued USD will continue to unwind as part of a multi-year cycle and we can see EUR/USD at 1.24 by end 2027.
Figure 13: EUR/USD and the 10 year US/Germany yield spread
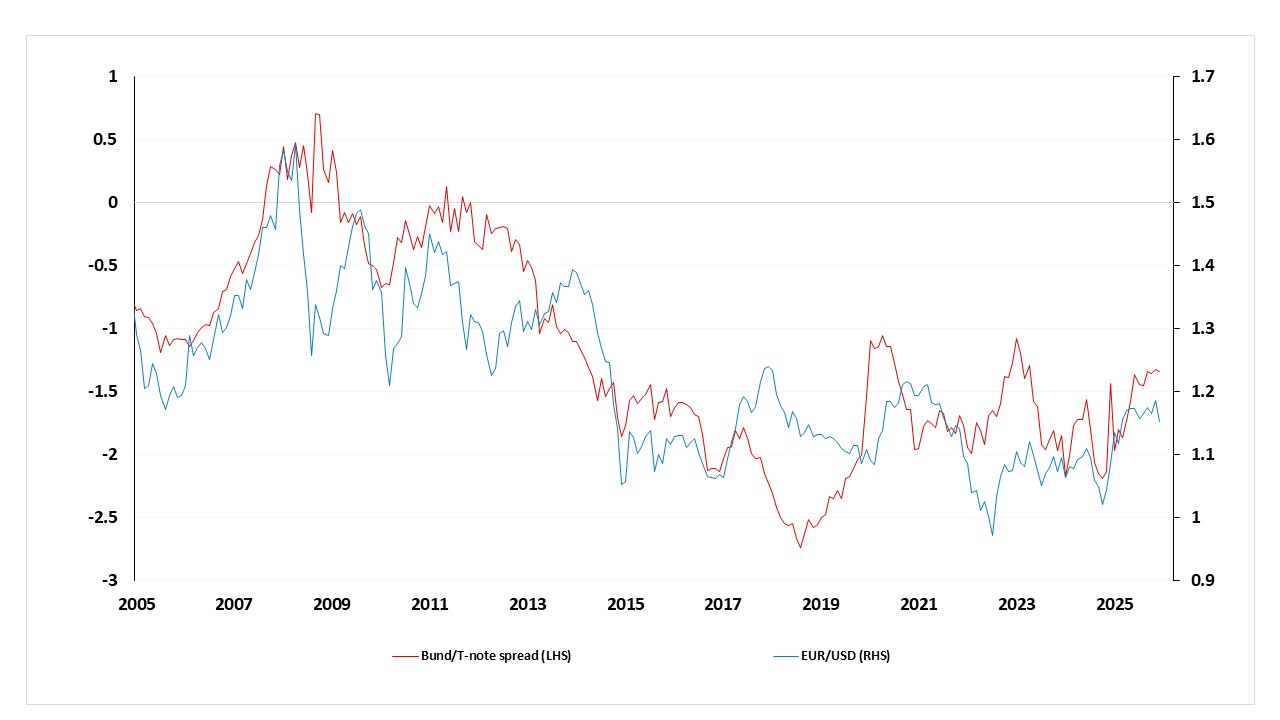
Source: Datastream, CE
What happens if a 2-6 month war and super elevated oil prices are seen? U.S. equities would see a stagflationary hit via pressure on corporate earnings/valuations and the Fed not being able to cut initially. This could produce a deeper correction to 5500-6000. However, genuine fears of a mild recession would be needed for larger multiple deratings and more prolonged selloff. Other global equity markets would likely sell off broadly in line with the U.S. equity market in this alternative scenario.
U.S. Treasuries yields could initially move higher than the levels shown in Figure 11 and 10yr yields could reach 4.50-4.75% with USD150 oil prices. However, U.S. real yields are reasonable and this should be a restraint to the scale of a U.S. yield rise. Any more aggressive U.S. equity selloff, plus signs of a hard landing, would likely fuel a rush into U.S. Treasuries. If the Fed shows sensitivity to the slowing economy, then this could drive 10yr yields down to 3.50%.
In DM FX, further USD strength initially on super high oil prices may not last if U.S. equities enter a major risk off phase and come down to 5500-6000. Then we could see the USD losing ground. It could get whipsawed against the JPY that is very oversold. Our favorites were the AUD and NOK based on yield spreads, but it is also worth noting they are net energy exporters (Figure 14) and helped if energy prices remain elevated. We also like these countries as they are fiscal saints compared to the U.S./UK or France (here) and more appealing in a crisis.
Figure 14: Energy trade, measured as the percentage of energy use (-ve is net importer, +ve net exporter)
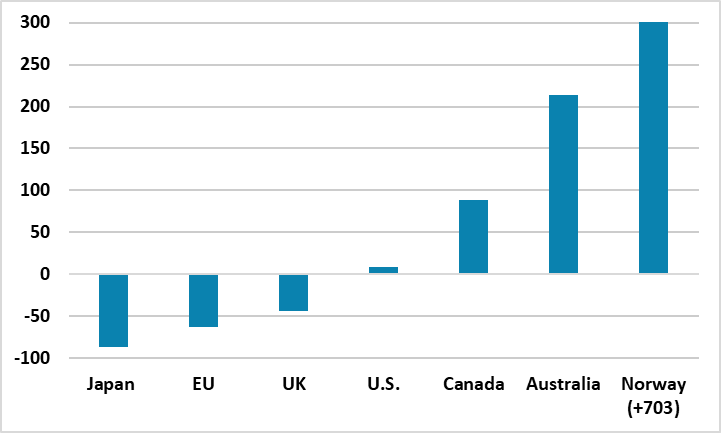
Source: World Bank (2023 data), CE