DM Central Banks: Overlooking Lagged 2021-23 Tightening and QT?
We are concerned that DM central banks are underestimating the lagged impact of 2021-23 tightening and ongoing QT, which impacts the transmission mechanism of monetary policy. Central banks need to consider cyclical and structural issues, but also need a more rounded view of the stance and implications of monetary policy than purely the level of policy rates. These lags and QT help provide some of the reason for our view of prolonged BOE easing into 2026; three rate cuts from the Fed in 2026; more ECB easing in 2025 and the BOJ pausing the tightening cycle at a 1% policy rate.
DM central banks are focused on cyclical issues (growth, Trump’s tariffs and inflation), as well as structural issues (deglobalization, labor market problems and structural fiscal policy). Are they underestimating the lagged impact of both 2021-23 tightening and QT?
Figure 1: U.S, Eurozone and China M2 (Yr/Yr %)
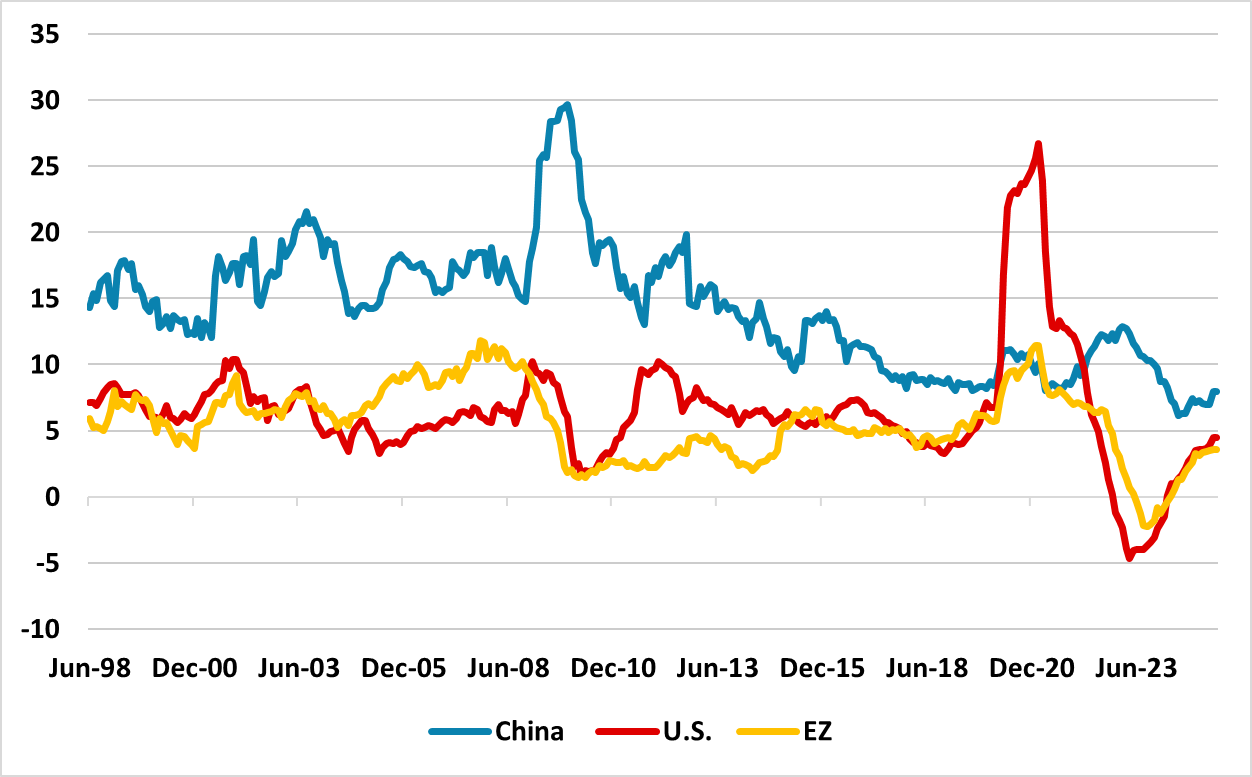
Source: Datastream/Continuum Economics.
DM central banks are focused on cyclical issues (growth, Trump’s tariffs and inflation), as well as structural issues (deglobalization, labor market problems and structural fiscal policy). This provides a difficult set of circumstances to navigate and a lot of DM central banks are trying to balance current and future inflation projections in setting interest rate levels. In the EZ, the reduction in wage inflation has allowed the ECB to be comfortable in moving back towards neutral policy rates. But has it taken note of a further slowing private sector credit in its latest money and credit update, all the more important given that the last two bank lending surveys hinted at banks becoming more cautious about lending. However for the Fed, the threat of an inflation boost from tariffs has produced a prolonged pause in the easing cycle, while UK current wage and service inflation are countering lower projected inflation and producing a cautious easing of policy from the BOE MPC.
However, are DM central banks underestimating the lagged impact of 2021-23 tightening and QT? M2 money growth in the U.S. and EZ (Figure 1) are below the 2015-19 average, while financial conditions have been tighter in the EZ than the level of interest rates would suggest (here). The 2021-23 tightening cycle was not a normal tightening cycle, as it came after an era of ultra-low interest rates that had existed since 2008 (Figure 2). Households and businesses made decisions in this era based on the forward guidance that policy would remain ultra-easy. This did allow a lot of households and businesses to lock in low fixed rates, but some of this is coming to maturities to be rolled over at higher interest rates than the 2008-20 era. Though the level of U.S. and UK interest rates are not as restrictive as the 2023 peak, the transmission mechanism of restrictive policy could be incrementally increasing due to the lagged impact of monetary policy. The ECB is starting to talk about the impact of lagged monetary policy on still rising mortgage rates (here).
Figure 2: Fed, ECB Deposit Rate, BOE Policy rates (%)
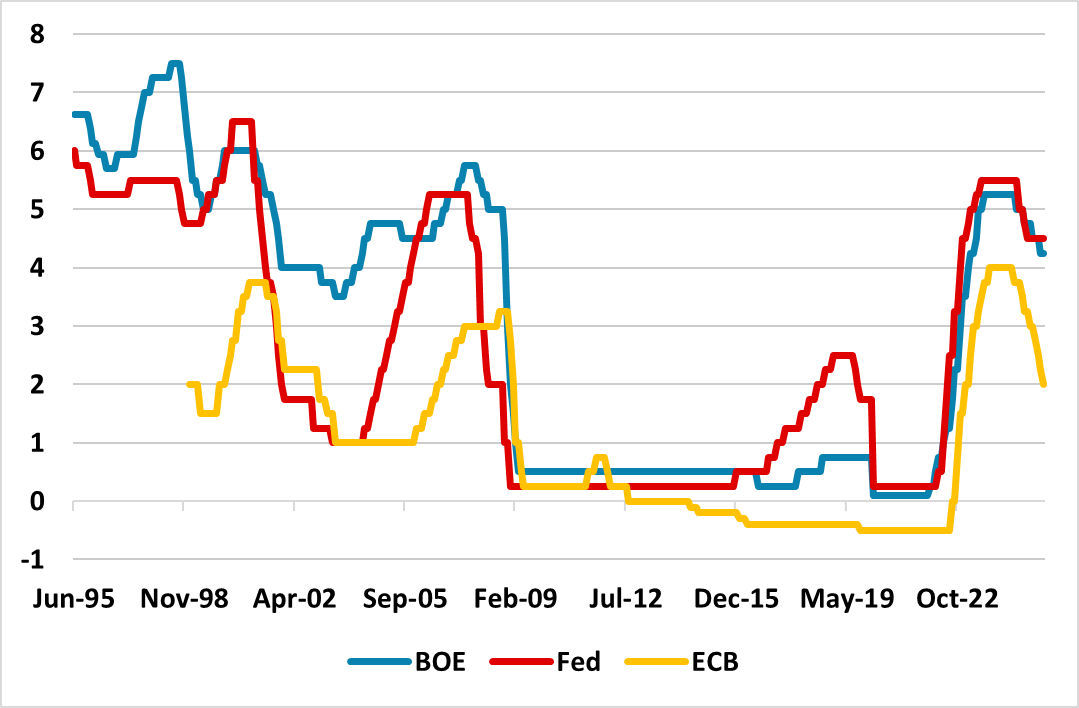
Source: Datastream/Continuum Economics.
In the U.S. the average 30yr household mortgage rate is considerably higher than the post GFC period, which has meant that new and existing home sales have not picked up after last year’s Fed easing. For the Fed, this needs to be balanced against the long lags of monetary policy due to fixed rate mortgage, which has kept the household debt servicing costs below the pre GFC period still. In our June Outlook (here) we do see Fed easing arriving late 2025 and then three 25bps cuts arriving in 2026 and part of this story is that the lagged impact of 2021-23 monetary tightening is still feeding through.
Figure 3: U.S. 30yr Mortgage Rate and Household Debt Servicing Costs (%)
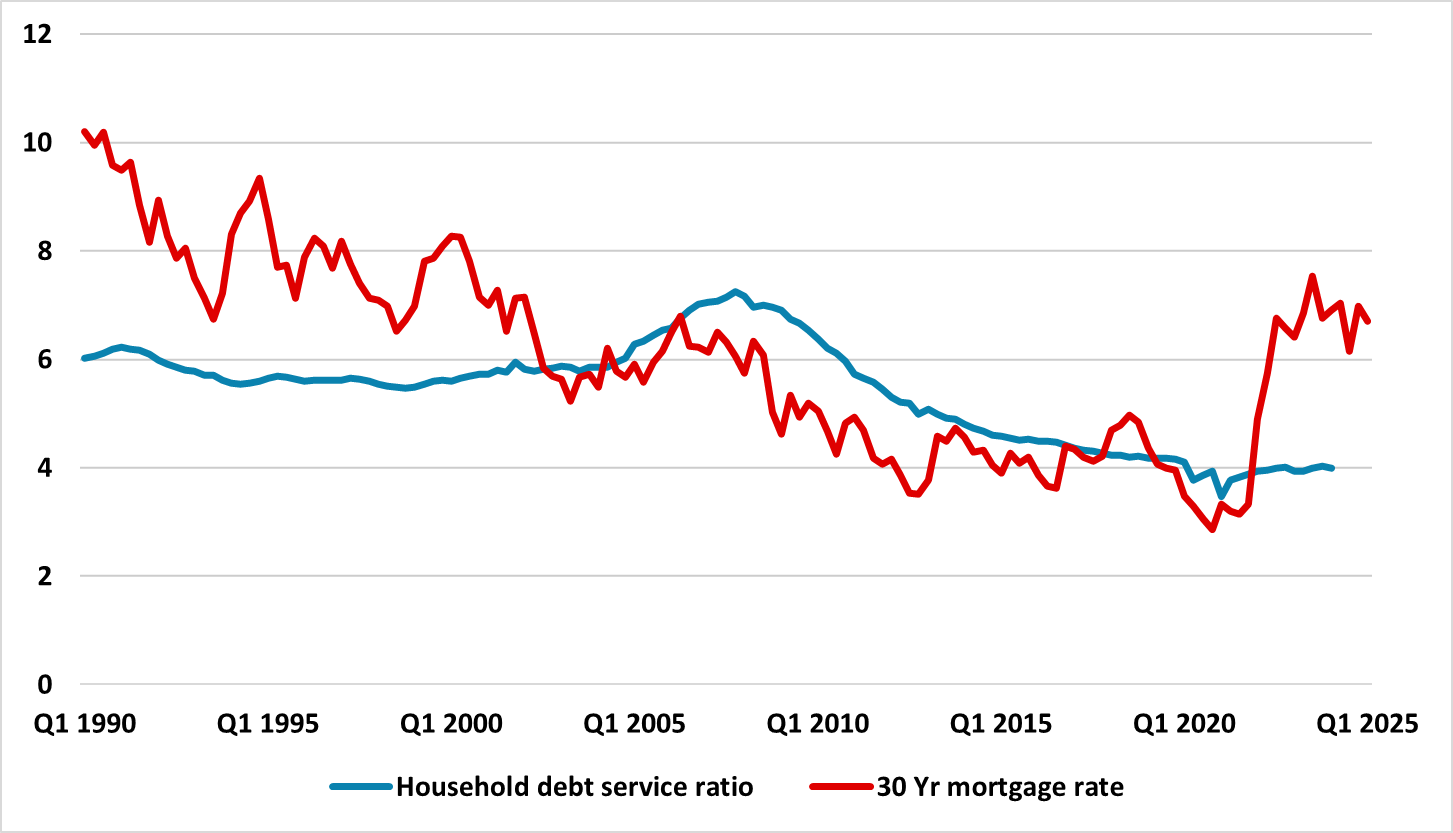
Source: Datastream/Continuum Economics.
Central banks also need to consider their balance sheet in assessing the monetary policy stance, alongside the level of interest rates. The pace of DM central bank balance sheet reduction has been more aggressive than the divergent 2012-18 period (Figure 4). This has been achieved via a mix of not reinvesting in maturing bonds and for certain central banks allowing large long-dated repos to mature. Increasing bank demand for short dated safe assets helped to initially smooth this process. However, persistent QT is a force now starting to steepen government bond curves. Central bank surveys of lending also show signs of banks complaining about tighter central bank liquidity due to central bank balance sheet shrinkage. Overall, QT is not as powerful as QE, but it still has some adverse impact on the economy and should be considered in the overall monetary policy stance.
Figure 4: Central Bank Assets to GDP (%)
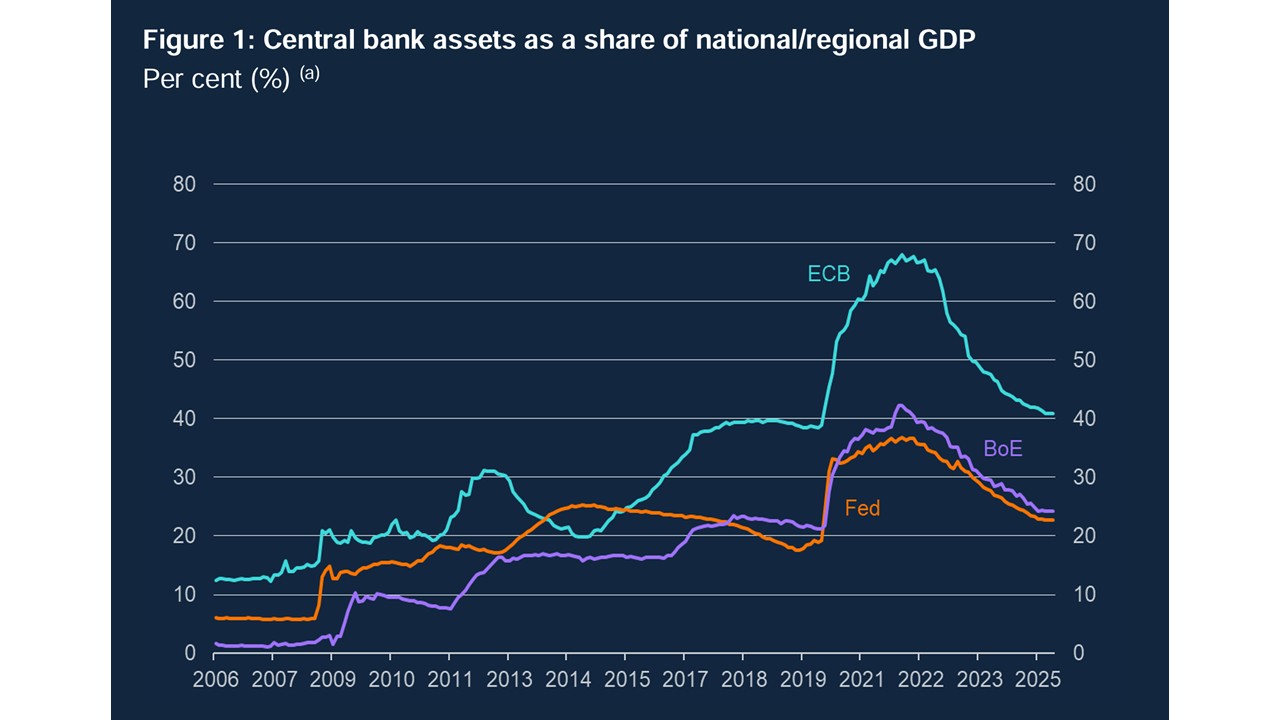
Source: BOE (here)
The Fed has slowed the pace of QT noticeably, due to concerns that excess reserves could decline to a level that causes 2019 style short-dated money market problems in the U.S. ECB, BOE and BOJ QT pace remains fairly aggressive however. We do see the ECB slowing the pace of QT later this year or H1 2026, as the ECB is starting to understand that QT is diluting the impact of its monetary easing (here). The BOE will likely slow the pace of annual bond rundown to £75bln from September versus the current £100bln pace (here), but this will still involve outright gilt sales in contrast to other major DM central banks. The lagged impact of 2021-23 BOE tightening, plus the ongoing adverse economic impact of QT, leaves us forecasting two further 25bps BOE cuts in 2025 and then two further 25bps cuts down to 3.25% in 2026 – see Western Europe Outlook (here). Finally, BOJ QT is approaching 3% of GDP, which we feel will drive a further increase in 10yr JGB yields to 1.80% by end 2025 and 2.00% by H2 2026 (here). Given the BOJ concern over inflation this is unlikely to stop 25bps BOJ policy rate hikes in September and H1 2026 to bring the policy rate to 1%, but the rise in 10yr JGB yields will likely be enough for the BOJ to slow the pace of QT acceleration in June 2026 and cause a prolonged pause once the policy rate reaches 1%.