Equities Outlook: Choppy Up For 2026 and Down for 2027?
· The U.S. equity market is underpinned by the bullish AI/tech story and a soft economic landing into 2026. However, overvaluation is clear and this leaves the market vulnerable to a 5-10% correction on moderate bad news e.g. economic data. We see the S&P500 having a choppy year and at 7300 for end 2026. We see 6850 for end 2027, as the alternative adverse scenarios are more fluid and potentially larger than 2026 (e.g. mature U.S. economic cycle or AI investment profit disappointment). Revenue or earnings disappointment from 2nd tier tech companies in particular could also be a catalyst in 2027. Additionally, extreme overvaluation on key equity only measures tend to last 12-18 months, which could mean that any moderate or major adverse catalyst could cause a 2027 deep correction. However, this is a market valuation question, as the broader AI story will likely lift productivity and U.S. GDP and produce wider benefits in the next 2-10 years, with the key uncertainty whether this will be modest or moderate.
· For EZ equities, a clear new catalyst is needed for significant outperformance versus the U.S. and a further 50bps ECB cut is unlikely to be enough. UK equities will remain restrained by fiscal consolidation and volatile UK politics, though supported by more BOE easing than the market is discounting. Finally, Japanese equities are too optimistic on new reflation policy, but corporate reform and higher return on equity can drive modest outperformance versus the U.S. in 2026 and 2027.
· In EM equities, 2026 can see a China 2.5-5% outperformance versus the U.S., but driven by tech. Non tech is slightly overvalued and facing the cyclical challenge of modest consumption and the ongoing residential property bust, alongside a profit margin squeeze from the excess of production over domestic demand. India can only outperform modestly in 2026, as good corporate earnings growth will partially go into a further de-rating of the P/E multiple. Finally, Brazil equities will likely pause in H1 2026, as BCB will be slow to ease and concerns grow over a tight October 2026 presidential election. 2027 will be a better year for Brazilian equities.
· Risks to our views: U.S. economy sees a mild recession hitting corporate earnings expectations. S&P500 falls to 5000-5500, as overvaluation is so large that a major adverse catalyst would likely cause a noticeable decline in the fwd P/E ratio (S&P 500 ex mag 7 is too high).
Figure 1: 12mth Fwd S&P500 P/E Ratio and 10yr Real U.S. Treasury Yield Inverted (Ratio and %)
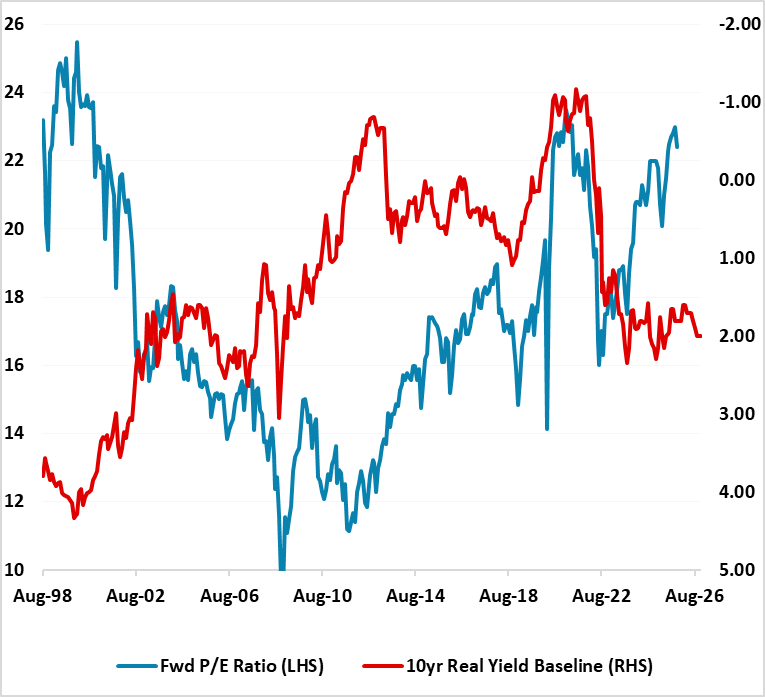
Source: Continuum Economics with forecasts to end 2026
The U.S. equity market has a number of crosscurrents in 2026.
· AI/Tech wave remains. The latest earnings season shows momentum for the big tech companies and no major adverse surprises. Though questions have been raised about the AI capex squeeze on 2026 profits, the backlog of orders for Nvidia, Microsoft, Amazon and Alphabet means that investors are counting on revenue and double digit earnings in 2026 and 2027 for some of the Magnificent 7. Even so, Meta is facing questions due to the lack of a big server business, while Open AI losses remain very large and future financing may not be smooth (here). Both need exponential revenue growth in AI businesses, with some industry analysts questioning whether AI moats are lower than traditional big tech earnings. Slower profit growth from any of the Magnificent 7 could prompt intermittent correction in the next 12 months, but it is difficult to be see a major reset and this means that underlying bullishness will remain in place. Even so, S&P500 IT and Communications fwd P/E ratios remains well above the 2020 peak and are clearly overvalued, which could cause correction/consolidative absolute price movements at times. Given the importance of AI and tech, this will impact overall S&P 500 performance. This is a market valuation question, as the broader AI story will likely lift productivity and U.S. GDP and produce wider benefits in the next 2-10 years, with the key uncertainty whether this will be modest or moderate (here).
· Buybacks. If the economy sees a soft landing then buybacks can be counted on to continue at an aggressive pace. A harder landing would likely slow buybacks and amplify a correction, but this is a lower probability risk than a couple of months ago – we now attach a 20% probability in the next 12 months.
· Soft Landing. Economic data recently is more consistent with a soft landing rather than a hard landing, as we wait to see federal data for October/November and December. Though we do still see the high average tariffs being an economic headwind in H1 2026, we do not see this causing a hard landing. The U.S. economy is muddling through on an AI Capex boom and balance sheet strength of middle to upper income U.S. households. This all reduces the risk of a sharper slowdown in corporate earnings, though we do expect a reduction in optimistic current 2026 bottom up estimates.
However, the U.S. equity market is clearly overvalued on a broad array of equity valuation measures and also against 10yr real bond yields (Figure 1). Rather than going into the merits of each measure, we would note that the fwd 12mth P/E ratio and CAPE P/E (Figure 2) have been the best predictor of future returns and current 5yr capital market assumptions would show mean reversion in P/E ratios. Finally, measures of equity risk premia and equity-bond yield measures show the U.S. equity market is clearly overvalued. If the economy sees a soft landing then 2% real yields are likely to remain in place, which place a strain on the equity market. Meanwhile, peak valuations do not last years but rather months and quarters. 2022 sky high valuations were noticeable from January 2021 to April 2022 before major P/E de-rating occurred. Extremely elevated valuations (CAPE P/E over 40) existed January 1999 to September 2020, before valuations cracked and caused a bear market.
Our baseline for 2026 is for a rally on good earnings, with a correction followed by a recovery that leaves the market up modestly from end 2025 levels. The 2022 and 2001-2 P/E derating were caused by major catalysts in the shape of aggressive Fed tightening and a recession respectively. No large adverse catalyst is in our baseline U.S. economic and policy view for 2026. However, we see 10yr U.S. Treasury yields remaining close to current levels (here) throughout 2026, which leaves a strain in equity-bond relatives. Any moderate adverse news could be enough to prompt a 5-10% correction in U.S. equites. Overall, we look for 7300 on the S&P500 for end 2026.
One potential catalyst is the economy if high tariff levels feed through later and more powerfully then we are projecting to cause a harder landing in the economy. An early end to Fed easing or a Fed pause is more mixed for U.S. equities, as the money and bond market would likely believe that further easing would likely arrive in H2 2026. Meanwhile, Supreme Court rejection of Trump’s reciprocal tariffs would cause short-term volatility, but the Trump administration would likely find some replacements and also a considerable number of key trading partners have agreed trade frameworks in principle that include specified tariff levels, and these would likely be codified quickly. On the political front, an attempt by the Trump administration to derail the mid-term election or dispute the election result would raise political risk and likely prompt an equity market correction, but is a modest probability scenario. In terms of alternative scenarios, we attach a 20% probability to a U.S. hard landing, which would likely lead to P/E contraction and see the S&P500 fall to 5000-5500.
In terms of 2027, we feel that the risk of a disappointment on future tech profits from some big tech companies could be greater than 2026 (here), while the economic cycle will be more mature. This risks a deeper correction in the overvalued U.S. equity market. We then see a recovery to 6850 by end 2027. Even so, as noted super high valuations have lasted 12-18 months, which leaves U.S. equities structurally vulnerable.
Figure 2: Germany/UK 12mth Earnings Yield minus 10yr Real Government Bond Yield (using 10yr breakeven inflation)
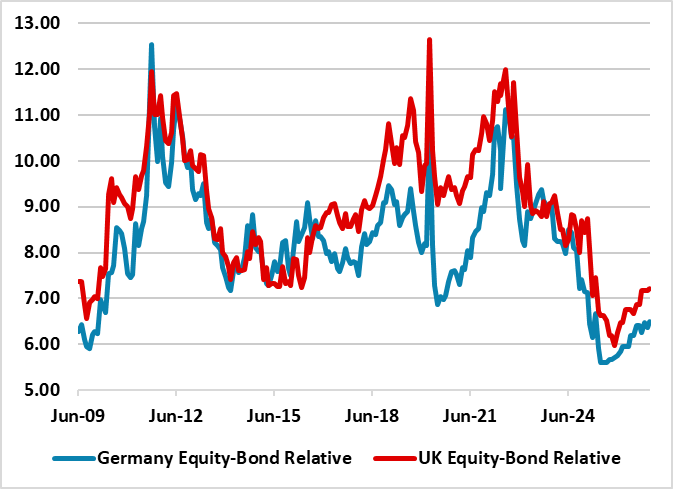
Source: Continuum Economics. Continuum Economics projections until end-2026 using 10yr breakeven inflation and Bund/Gilt yield forecasts.
EZ equities have underperformed the U.S. in H2, after the H1 outperformance. U.S. monthly TICS data suggest that net inflows into U.S. equities remain strong, though with more currency hedging occurring (here). Additionally, concern over the EZ economic recovery, plus corporate earnings downgrades, are restraining the EZ equity market. Though the ECB has cut rates by 200bps, the boost to the economy into 2026 is projected to be small. Fiscal policy is also a mixed influence, with Germany getting a defense and infrastructure boost but France restrained by an adverse budget deficit and political splits – Italy and Spain are also fiscally restrained by multi-year fiscal consolidation. Equity-bond valuation for EZ equities is better than the U.S., but Germany is now tight relative to post GFC history (Figure 2) and the 12mth fwd P/E ratio is above fair value. Though we look for two further 25bps cuts from the ECB, this is not enough in itself to see EZ equities clearly outperforming. Finally, any Ukraine peace deal will likely take time and years before sanctions are lifted, while the EZ/EU remain reluctant to get addicted to cheaper Russian gas again. This all means that EZ equities do not have a clear new positive story to decouple from U.S. equities in the next 12 months and we see only small outperformance over this period. 2027 will likely see ongoing EZ economic recovery which can help EZ equities mildly outperform the U.S.. The French fiscal mess will likely come into sharper focus as the May 2027 presidential election looms, but the prospect is that parliament remains against a credible fiscal consolidation path (here).
Figure 3: Japan 12mth Earnings Yield and 10yr Nominal Government Bond Yield (%)
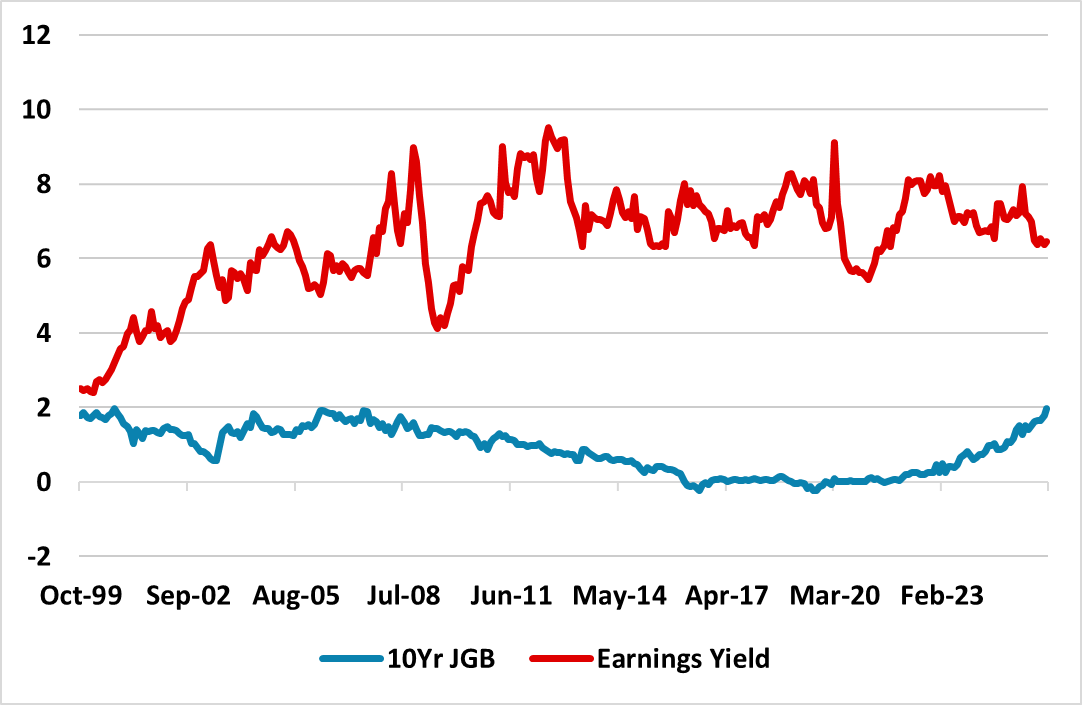
Source: Datastream/Continuum Economics. UK real yield uses RPI instead of CPI.
Japan’s equities have too much optimism about the Takaichi economic boost, with fiscal policy easing likely to be modest rather than aggressive. Additionally, we do not see the BOJ QT acceleration stopping until an accident occurs in the JGB market from the huge supply pressures. This could happen by mid-2026, which would likely see a BOJ partial U turn on QT and a 1-2 year pause in policy rate interest rate normalization. This could mean that H1 2026 is disappointing for Japanese equities, but H2 is good. With continued action on corporate reform and return on equity, we see 2.5-5% outperformance in 2026 compared to the U.S. 5% outperformance can be seen in 2027, with a steady BOJ leading to a refocus on equity-bond yield relatives (Figure 3). A sharp rebound in the undervalued JPY could reduce outperformance however.
Re UK equities, the FTSE 100 has outperformed FTSE 250 in 2025 on global versus UK factors, as the UK domestic economy is seen to be fiscally restrained and prone to stagflation risks that slows the BOE easing cycle. For 2026, the labor market is slackening more quickly than other DM economies and risks of a hard landing exist. This could mean that despite still attractive valuations, domestic equities continue to lag global equities. However, we see more slowing in service and wage inflation, which should allow more BOE easing than discounted in money markets in the next 12 months. The stagflation fears should ebb and this can see UK equities seeing 2.5-5% outperformance versus the U.S. in 2026. 2027 should see UK equities matching the U.S., as the BOE goes on hold and UK mid-term political turbulence reaches new heights.
Overall, other DM equity markets will likely not significantly outperform U.S. equities in 2026 and 2027, as less stretched valuations are offset by domestic economic and fiscal issues.
Emerging Markets
China’s equities optimism in August/September has been tempered and the market needs fresh good news for 2026. Valuations are no longer cheap in equity terms or against real government bond yields (Figure 4), though some are looking at earnings yield-nominal government bond yield spreads to support the market. China’s 2025 corporate earnings growth estimates have also been revised down, but this also needs to happen to 2026/27 earnings to be more consistent with 5% nominal GDP growth (given the excess of production over domestic demand).
The China AI/tech story certainly has upside though, as China tech companies are pursuing a more competitive AI route compared to U.S. tech approach of closed high cost AI. However, this is a sector story rather than a whole market story, where the macro and policy outlooks are more important. A U.S./China comprehensive trade deal would be a positive catalyst, but this now looks to be only a 30% probability in the next 2 years and a trade truce will likely be extended. New fiscal measures will remain targeted rather than aggressive and monetary easing will be slow. Real GDP will struggle to reach 5%. Overall, we see 2.5-5% outperformance versus the U.S. in 2026, mainly driven by China tech.
2027 can see a similar 5% outperformance, but once again driven by tech – though given our U.S. equity call, this means the index going sideways. Non tech is slightly overvalued, and is facing the cyclical challenge of modest consumption and the ongoing residential property bust, alongside a profit margin squeeze from excess of production over domestic demand. We do like China tech multi-year however.
Figure 4: China Earning-Bond Yield Relative Cheap Compared to Other Big EM’s (%)
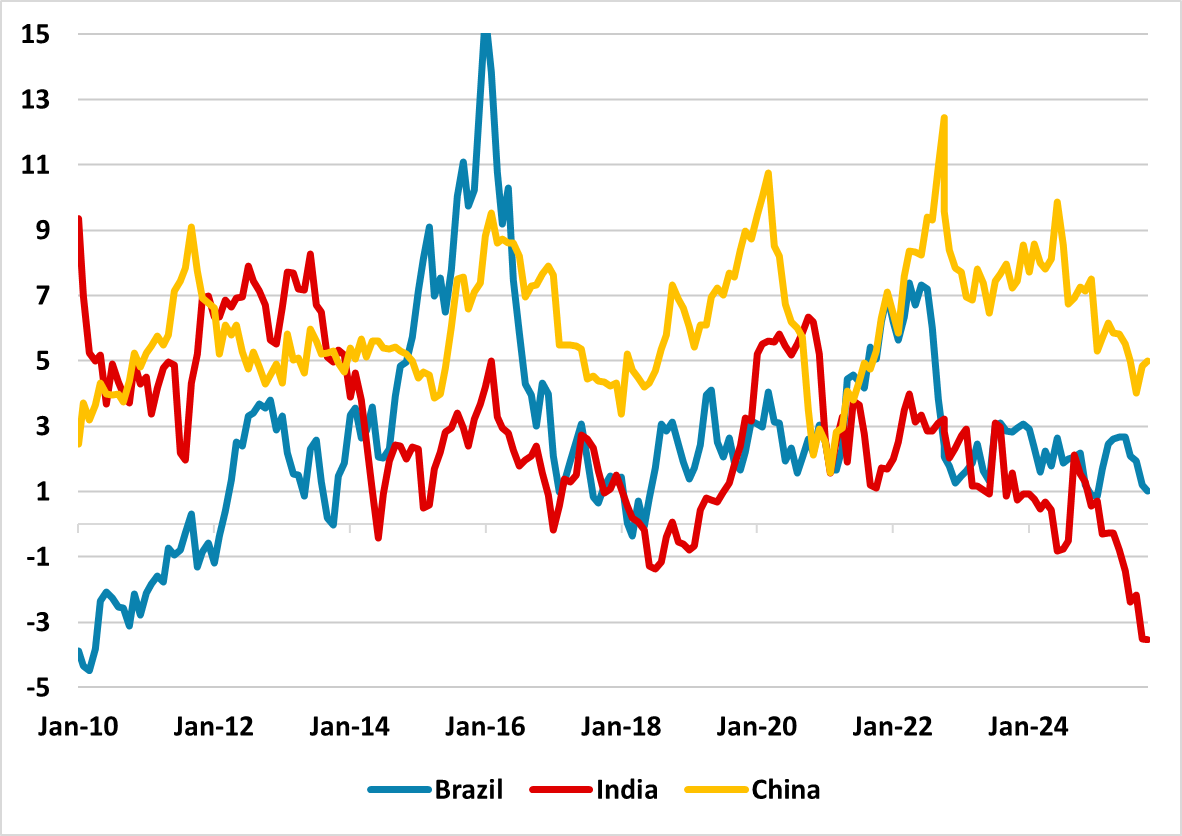
Source: Continuum Economics. CAPE Earnings Yield-10yr Real government bond yield
India’s equities have lagged in 2025 with the tariff war with the U.S. and also overvaluation outright and versus other EM equity markets. However, U.S. tariffs will only have a modest effect and will likely be counterbalanced for the 2026 economy and corporate earnings prospects by RBI easing and government stimulus measures. Even so, the 12mth fwd price earnings ratio is still at levels that mean a U.S. selloff would likely be mirrored in India tactically in the coming months, while India’s equity to bond yield spread is now modestly unfavorable. This means that 15% 2026 corporate earnings growth will likely partially go into a decline in the P/E ratio and we only see scope to outperform U.S. equities by 2.5-5% by end 2026. 2027 should be better for India equities in absolute terms and see 10% outperformance versus the U.S.
Figure 5: Brazil 12mth Fwd Earnings Yield-10yr Nominal government Bond Yield (%)
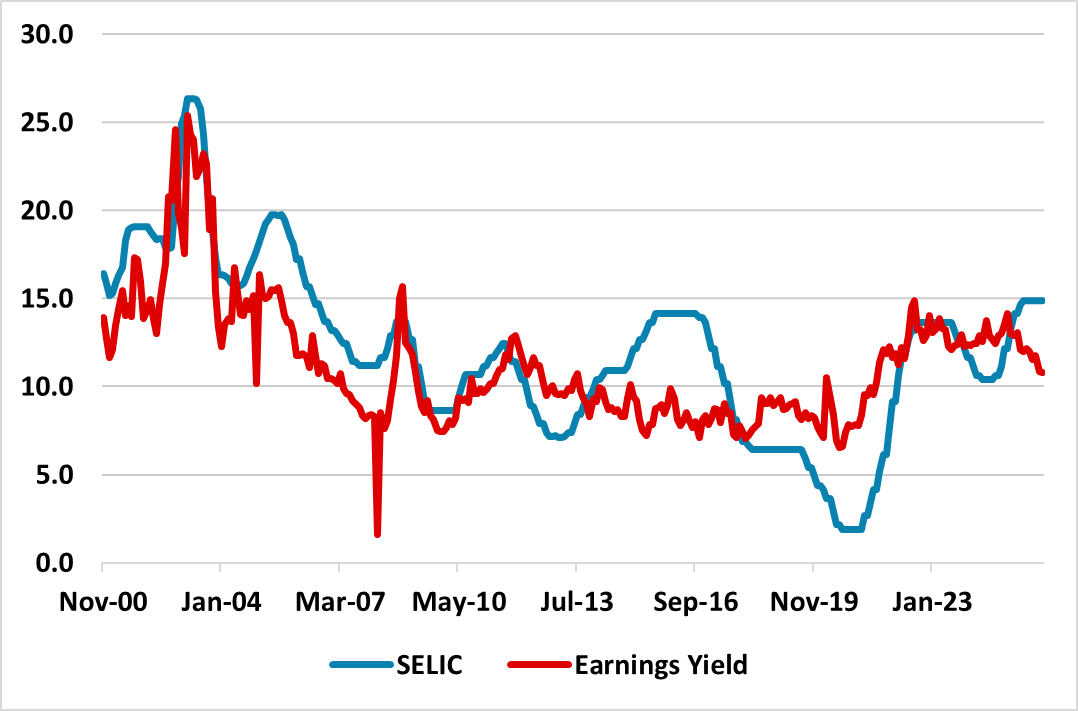
Source: Datastream/Continuum Economics.
Brazil’s equities have had a great 2025, as a softer USD trend and cheap valuations have attracted interest. A still high fwd earnings yield is the main bullish argument for 2026, but this now requires Brazilian bond yields and then policy rates to come down to drive further outperformance. This will take time as the BCB is on hold until at least spring 2026 and the bond market remains wary about fiscal policy ahead of an expected close presidential election in Oct 2026. Additionally, earnings growth has been trimmed as ultra-tight monetary policy feeds into economic slowdown and earnings rebound looks like a 2027 rather than 2026 story. An intermittent phase of outperformance will likely be followed by underperformance on political news. We see no outperformance versus U.S. equities for 2026. Late 2026 and 2027 should then be better with consistent BCB easing helping to bring down yields and allowing a fall in fwd earnings yields that sees the price/earnings ratio moving above 10. 10-15% 2027 outperformance versus the U.S. should be on the cards.