Headwinds To Long-term Global Growth
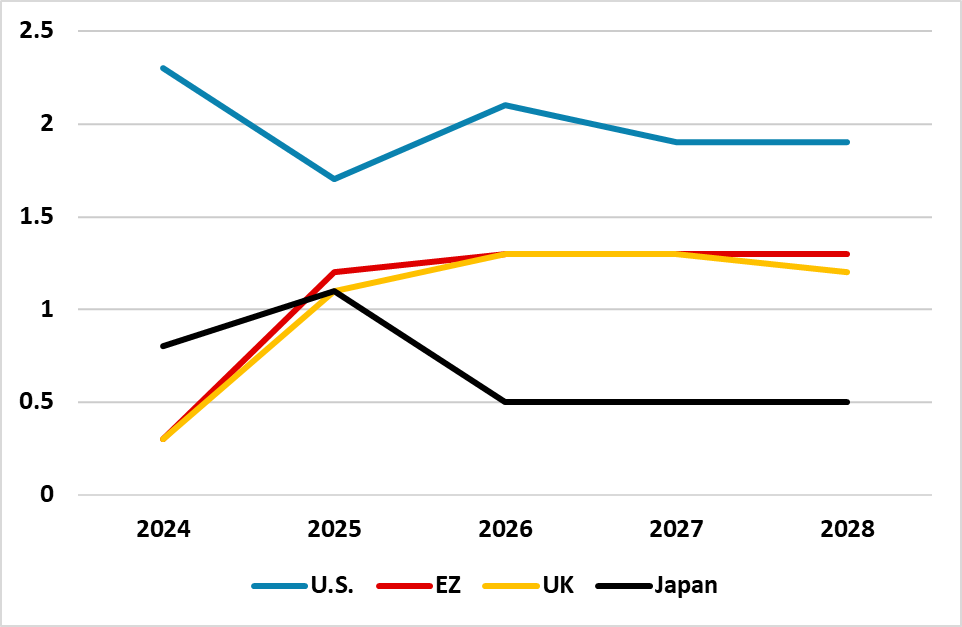
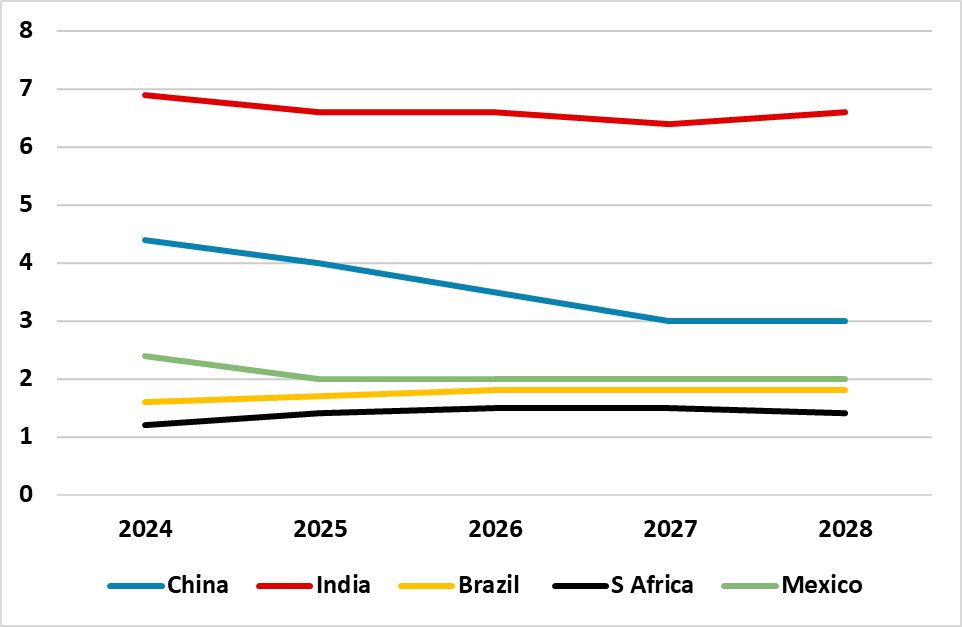
Bottom line: While much focus is on the cyclical economic position to determine 2024 monetary policy prospects, the 2025-28 structural growth trajectory differs to the pre 2020 GDP trajectory for major economies. While global fragmentation has a role to play, aging populations are already having an adverse impact in Europe and China, alongside a slowing trend in productivity growth. Tech and AI will only likely boost the wider economy latter in the decade, while the current boost from climate change investment could become more volatile if Donald Trump were elected U.S. president. Some reduction in restrictive monetary policy will help into H2 2024/2025, but an understanding of structural influence is also important. The most impacted will likely be China where we see growth slowing to 3% by 2027.
Figure 1: DM Real GDP Forecasts 2024-28 (%)
Source: Continuum Economics.
GDP: Long-Term Trends
Figure 2: EM Real GDP Forecasts 2024-28 (%)
Source: Continuum Economics.
Beyond our one and two year ahead forecasts, we also forecast out to 2028. In our annual review, we consider the impact of demographic headwinds/tailwinds; technology and AI; fiscal policy stance and fiscal policy (here). These vary across countries and produce different cumulative forces across the 23 economies that we follow closely. Some of the considerations are:
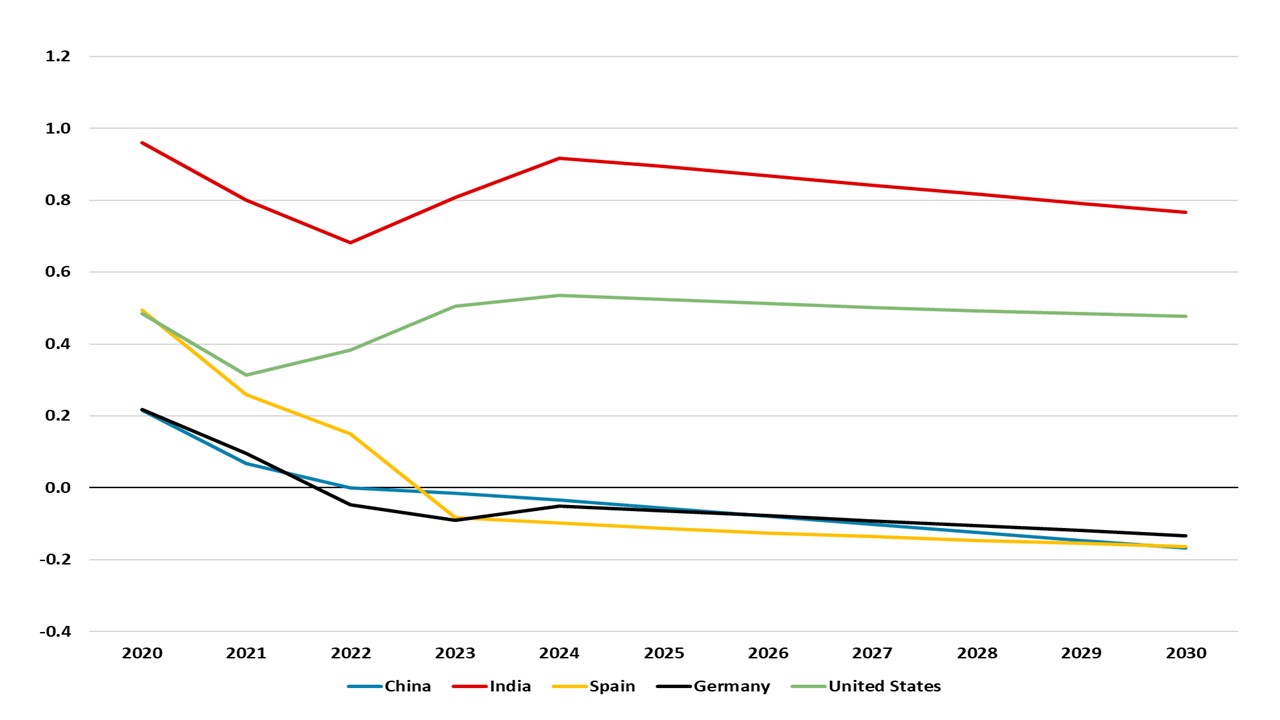
Demographic Headwinds / Tailwinds: EZ/UK/Japan and China face population aging due to demographic trends through the remainder of the 2020s. This is not just about lower absolute consumption for older people, but also less people in the 15-64yr age group inhibiting housebuilding/consumption and tax revenue growth. Additionally, it can mean peak labor force and lower participation rates for the 55-64 age group impacted by long COVID or desire to retire early. Our view is that those countries with declining populations could be negatively affected by the change in the coming years, and political reasons will likely hinder the swift implementation of major solutions to counteract decreasing labor force (e.g. large scale immigration in DM countries or increased retirement age or female participation in some EM countries).
However, India and Indonesia are set for continued population growth in the next decade and likely to reap benefits from this demographic trend given their relative political stability and reform leaning governments. The U.S. should also be a beneficiary given better domestic demographic trends than other DM countries (Chart 3), but also depends on the immigration policy of the next U.S. president – a reelected Donald Trump would likely try hard to slow immigration, posing a headwind to U.S. growth in the coming years.
Figure 3: Population Growth in Select Countries (%)
Source: UN, Continuum Economics
Artificial Intelligence and Digitalization: A key subject to analyze is the impact of artificial intelligence on growth over the next decade, which we did last autumn (here). Most economists argue that AI will boost growth in the long run. First, AI is expected to make existing workers more productive by allowing them to complete tasks more efficiently. Second, a new virtual workforce, capable of learning and solving problems autonomously, is expected to emerge. Third, in tandem with the AI revolution (and complemented by the diffusion of innovation), new products, services, markets, and industries are anticipated to arise, thereby boosting consumer demand. Also it is worth remembering that digitalization continues to provide a boost as 5G/Big Data and the Internet of Things enables an improvement in processes and benefits growth (here).
However, we see the initial wider economy effects of AI starting to kick in the late 2020s and gaining traction in the 2030s, with AI chip, mega tech and infrastructure companies being the near-term beneficiaries. It is crucial to highlight that countries will need to navigate through an adoption phase, which includes establishing the regulatory framework and implementing policies in the areas of labor, education, and competition. Similarly, firms will undergo this stage by integrating technologies, adapting processes, and providing training for their workforce. This adoption stage is one of the reasons of why the impact of AI is not realized sooner. DM economies will also likely benefit more than EM countries, due to higher wages and thus increased benefit from automation.
Climate Investment and Costs: During President Biden's administration in the United States, the US Inflation Reduction Act was passed, allocating over USD 370 billion in funding to mitigate climate change. In Europe, initiatives such as the EU’s Green Deal, Fit for 55, and RePowerEU have been put into effect. China also launched its mid-century long-term low greenhouse gas emission development strategy (here), which among other strategies, aims to reduce the cost of climate investment and financing while promoting green consumption. Although these policies represent a step in the right direction and offer some net stimulus in terms of economic growth during the second half of the 2020s, we think that political headwinds could potentially slow or even reverse some of the progress achieved. We delve into this issue in depth (here), where we argue that the outcome of the November 2024 U.S. presidential election is crucial for the U.S. and globally. If Biden is reelected then momentum will remain towards increased climate investment, but if Donald Trump wins then it will likely produce a U.S. withdrawal from the Paris Agreement and a reduction in renewable energy subsides.
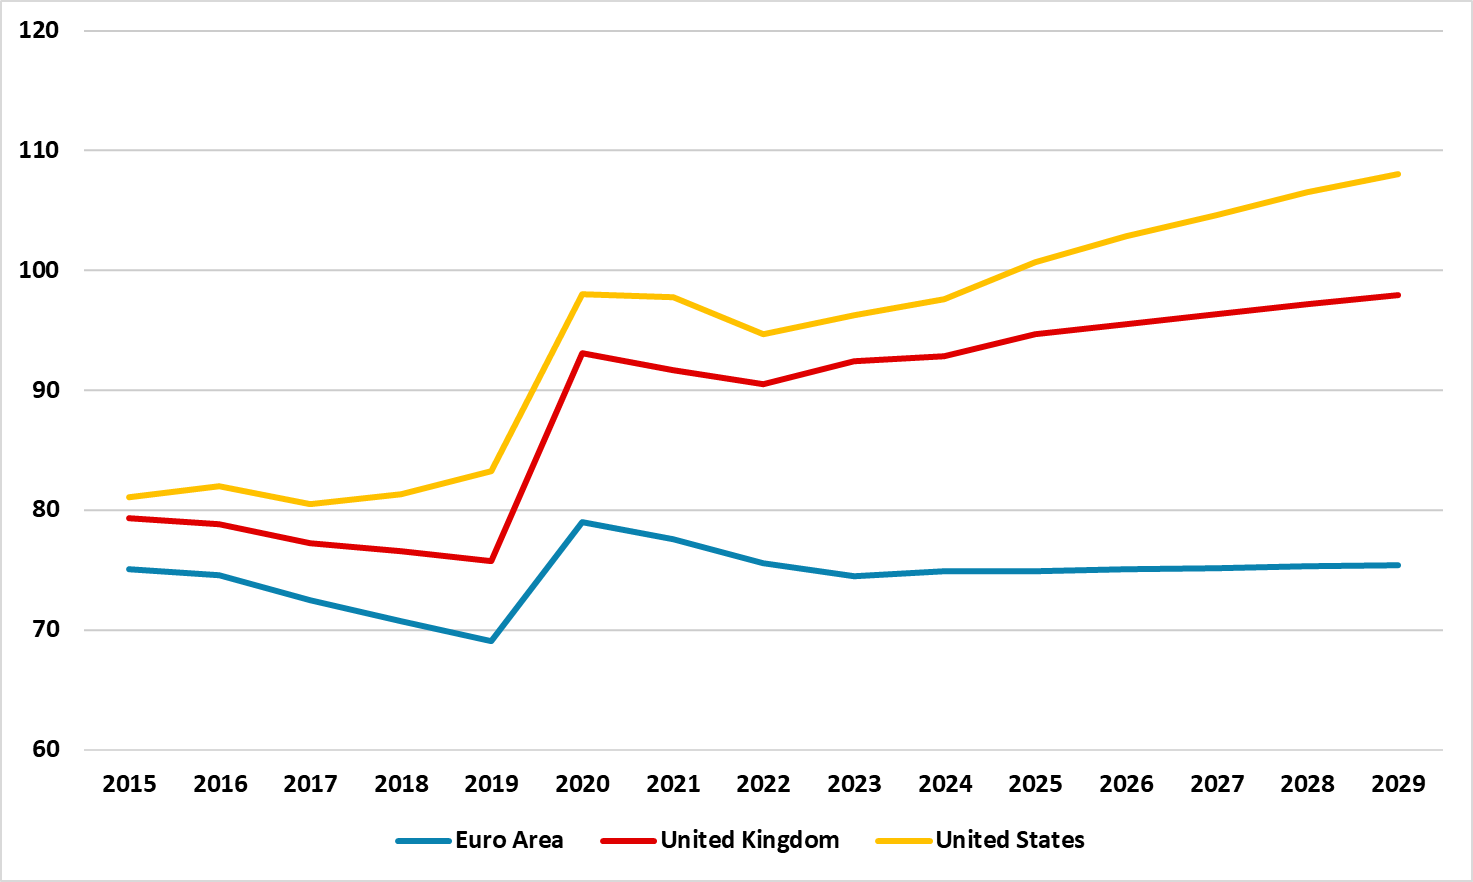
DM and EM fiscal policy investment vs. consolidation: The fiscal buffers of DM countries have been diminished by the dual impact of the COVID pandemic and the energy crisis. Consequently, sustained efforts are required for some countries to navigate a course toward fiscal consolidation, though avoiding too quick a pace and hurting growth. Within the EZ, countries are making progress in this direction, as the EU next generation funds help to provide domestic infrastructure investment without a strain on national governments. However, the progress in France and Italy is slow meaning little room for adverse fiscal surprises. In the United States, we anticipate loose fiscal policy in the coming years, irrespective of the outcome of the presidential election in November 2024, given Congress is reluctant to raise taxes or cut expenditure. 2025 could see U.S. fiscal tensions either for Biden as the Republicans fight a debt ceiling increase or Trump who wants to make his 1 term tax cuts permanent.
In EM countries, the panorama varies on a country basis, both in terms of deficit and government debt trajectory. China official figures provides a misleading picture and we prefer the IMF measures, which shows a large general government budget deficit and a debt trajectory. India, on the other hand, has the benefit of high nominal GDP growth in the coming years, which should ensure that the government debt/GDP trajectory should stabilize. Of the other big EM, Brazil and South Africa need to do more multi-year fiscal consolidation to ensure that government debt/GDP levels do not get too high and risk fiscal crisis. Overall, fiscal space is modest and the bias will be towards fiscal consolidation.
Figure 4: Key DM Net Government Debt/GDP (%)
Source: IMF, Continuum Economics (net of financial assets)
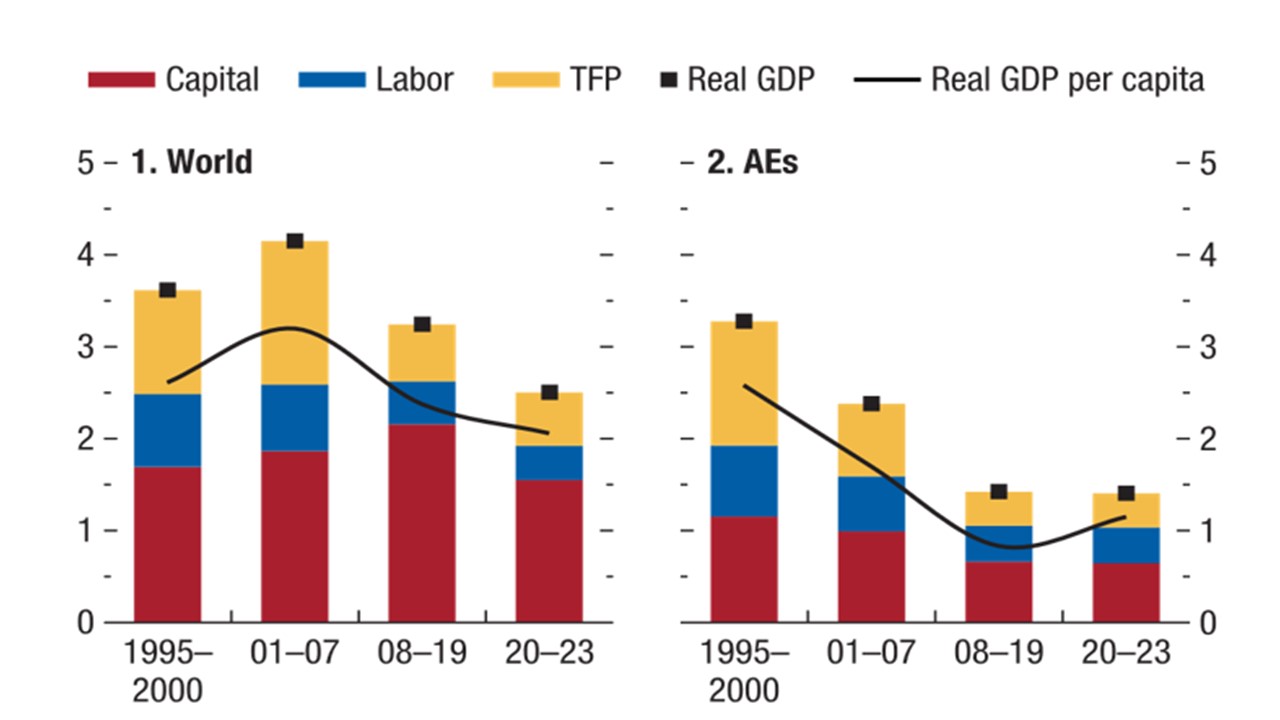
Slower Productivity Growth: Productivity growth has slowed over the past 20 years, which along with increasing demographic headwinds and low business investment rates post GFC, have caused the structural slowdown in growth trend. Economists also focus on the combination of labor and capital in the form of total factor productivity (TFP) growth, which has also slowed over the past 20 years globally and also in advanced economies (Figure 5). The IMF recommends that sizeable TFP and structural growth dividends could be enjoyed from increased market competition; trade openness; financial access and labor flexibility. However, most DM and EM politicians are not focused on such reform measures and are thus unlikely to boost most economies medium-term.
Figure 5: Contributions of Components of Growth (%)
Source: IMF WEO
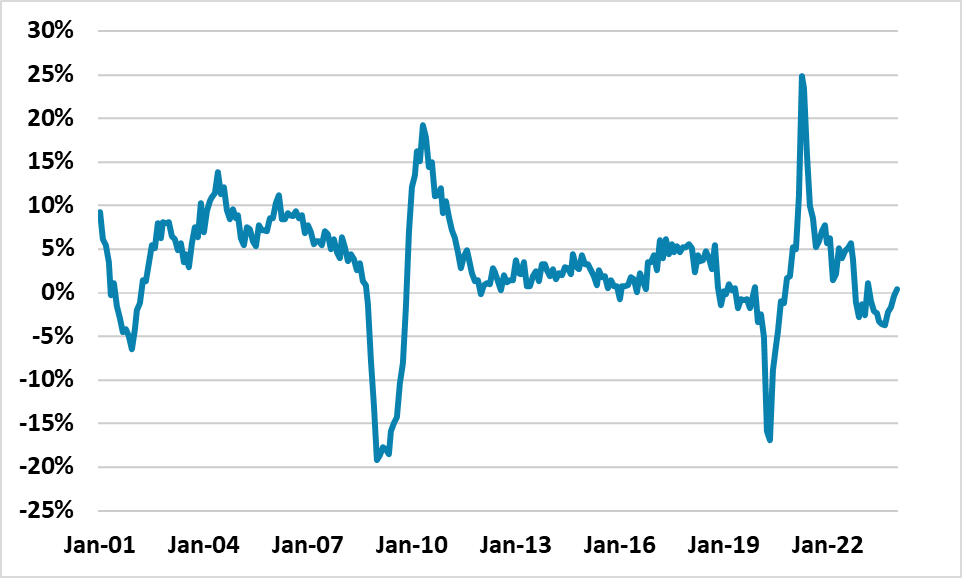
Global Fragmentation: The COVID crisis has prompted a shift to onshore some industries, while the Ukraine war has fragmented global trade with Russia and its close allies. U.S./China competition and fears of the impact of any China/Taiwan war has also hurt global trade growth and reshaped supply chains. CPB data shows that world trade growth has slowed after the post COVID reopening (Figure 6). Part of this is China now growing more slowly, as China is the dominant force in a lot of global commodity trade. For the coming years much depends on the geopolitical situation. We have argued that the risk of a China/Taiwan war in the next 5 years is low, though this may only slow a shift of supply chains away from China. Additionally, the outcome of the U.S. presidential election is key, as the two candidates are a globalist (Biden) and isolationist (Trump) respectively. Though domestic production could be boosted in some countries from reshoring and a shift in global supply chains, a more fragmented world appears to be slowing global trade growth and this is a drag for overall global growth.
Figure 6: World Trade Volume Growth (Yr/Yr %)
Source: CPB
Overall, while global fragmentation has a role to play, aging populations are already having an adverse impact in Europe and China, alongside a slowing trend in productivity growth. Tech and AI will only likely boost the wider economy latter in the decade, while the current boost from climate change investment could become more volatile if Donald Trump were elected U.S. president. Some reduction in restrictive monetary policy will help into H2 2024/2025, but an understanding of structural influence is also important. The most impacted will likely be China where we see growth slowing to 3% by 2027.