DM Rates Outlook: Steepening Yield Curve The Old Normal?
• We continue to forecast further yield curve steepening across the U.S./EZ and UK, driven by cumulative easing. For the U.S. this can see a modest further decline in 2yr yields, but the prospect is for a move to a premium of 2yr to Fed Funds (unless a hard landing is seen). 10yr yields can move below 4.0% on economic jitters, but then rise back above 4% again in 2026 as gradual Fed easing reinforces soft landing ideas. A mild recession is now a 30% probability however and this would see 3.50% 10yr yields (Figure 5).
• 2yr Bund yields can shift to a premium versus the ECB deposit rate, as the market takes the view that policy rates have bottomed. However, tariffs are disinflationary outside the U.S.; EZ wage settlements are consistent with below target inflation and EZ growth is choppy. The ECB mood will likely change to deliver two further 25bps of further easing and we see a further small decline in 2yr yields. 10yr Bund yields can push to 3.0% by end 2026 on fiscal easing in Germany and given still low real yields, though disinflation and a 25% cut to the pace of ECB QT should cap long-end yields.
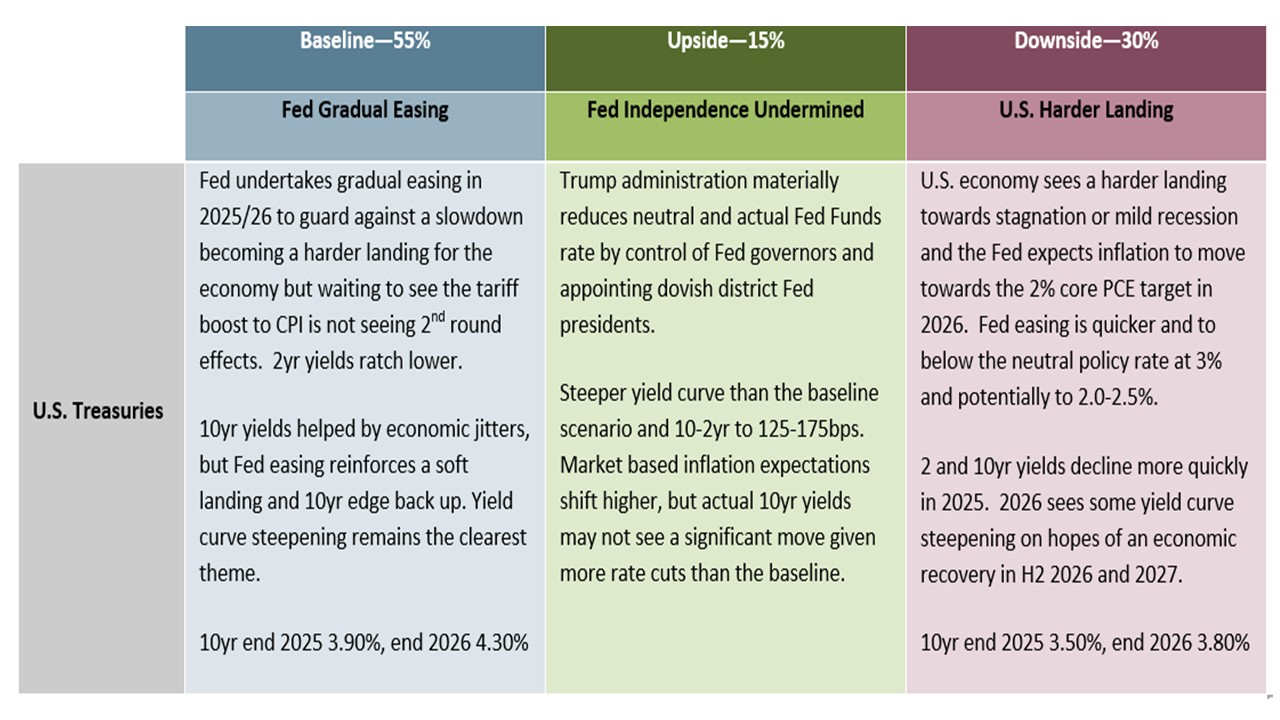
• A split BOE will find it difficult to deliver a November cut. However, with the policy rate still restrictive; financial conditions also tight; inflation set to fall over the next 2 years and the UK employment deterioration and GDP growth remaining bumpy, the MPC consensus for further BOE rate cuts will return. We see 75bps by end 2026, which will help 2yr yields to decline. Still large BOE QT combined with budget deficit net issuance should be around 6.5-7.0% of GDP in 2026 and this can slow the decline in 10yr yields. Thus 10-2yr yield curve can steepen to 100bps. Risks to our views: The U.S. economy sees a harder landing towards mild recession and the Fed expects inflation to move towards the 2% core PCE target in 2026. Fed easing would be quicker and to a neutral policy rate at 3% and potentially to 2.0-2.5%. 2 and 10yr yields decline more quickly in 2025 (Figure 4).
Figure 1: Fed Funds, 2, 10 and 30yr U.S. Treasury Yields Forecasts (%)
Source: Continuum Economics
The softness of employment numbers in recent months is leading money and bond market to discount persistent Fed easing by a further 100bps by July 2026. The 25bps cut at the September FOMC meeting (here), plus SEP and Powell guidance, suggests that most of this will be delivered, but perhaps not as quickly as the market expects. We look for a further 100bps of easing by Q3 2026 and our baseline assumes that the Trump administration does not radically change Fed behavior. The market will be happy to continue discounting more than Fed guidance provided that the employment numbers are soft, as that could mean that the economic slowdown deepens. If a hard landing occurs for the economy then the Fed would likely cut the Fed Funds rate to 2.0-2.5% and we attach a 30% probability to this alternative scenario (Figure 3). 2yr yields will see a small further decline but easing towards the neutral rate without a hard landing will likely see 2yr yields move to a premium versus Fed Funds. We would not see this being as large as 1994 or 2002 however (Figure 2) and 2yr yields are forecast at 30bps premium by end 2026 (Figure 1).
Figure 2: 2yr-Fed Funds Spread and Fed Funds Rate Inverted (%)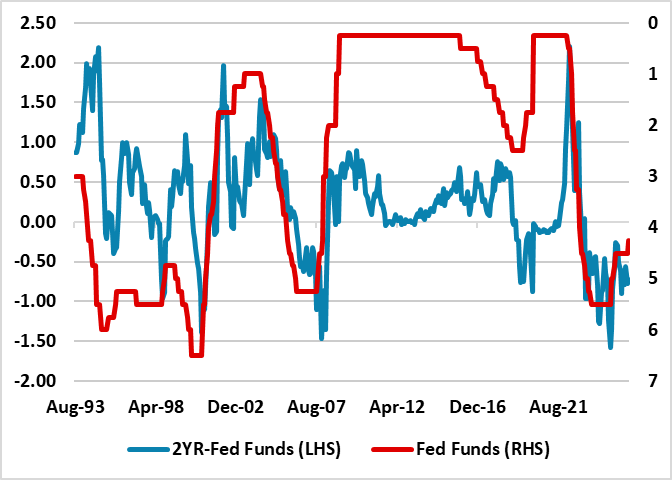 Source: DataStream/Continuum Economics
10yr yields have declined with the cumulative slowing in the labor market and as CBO estimates of USD4trn of tariff revenues over 10 years have tempered budget deficit and supply concerns for 2025 and 2026. However, some further yield curve steepening can be evident with Fed easing to engineer a soft landing for the economy. In the next 6 months economic jitters can see 10yr yields falling below 4%, but 2yr falling more. Additionally, the Fed Treasuries QT is very small in contrast to other DM government bond markets where QT will likely be 2-6% of GDP in 2026 (Figure 4). The 10-2yr curve is unlikely to be as steep as 1992 or 2003 however (Figure 3) but can widen to 100bps. This can come through cumulatively in 2026, as the market sees that the economy is seeing a slowdown rather than a hard landing and 10yr yields drift back above 4%. 10yr yields are forecast at 4.30% by end 2026.
Figure 3: 10-2yr U.S. Treasury and Fed Funds Inverted (%)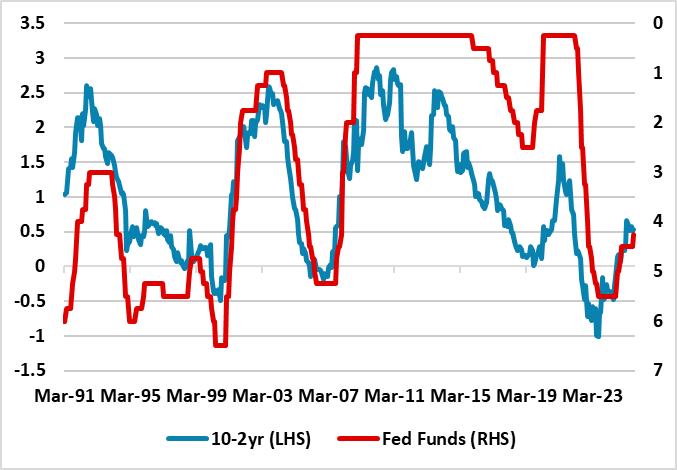 Source: DataStream/Continuum Economics
Figure 4: 2026 Budget Deficit and QT to GDP (%)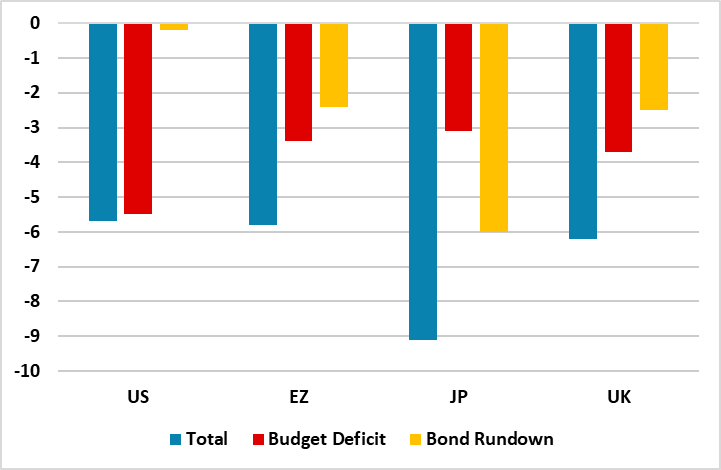 Source: IMF/Continuum Economics
In terms of alternative scenarios around our baseline, the bias is for lower yields (Figure 5). A harder landing for the U.S. economy could cause more aggressive Fed easing and a large decline in U.S. Treasury yields in 2025. 10yr yields could come down to 3.50%, with flight to quality also from an overvalued U.S. equity market. A 2nd alternative scenario is if the Trump administration get a majority of Fed governors, approve only dovish Trump Fed presidents in Feb 2026 and materially reduce the neutral and actual policy rate. The clear impact is a 10-2yr steeper yield curve that could be 125-175bps. For absolute 10yr yields this is less clear, as 2yr yields could fall dramatically and mean small fall, unchanged or small rise in 10yr yields compared to our baseline (Figure 5) due to the economic and easing cycle in 2026.
Figure 5: 10yr U.S. Treasury Scenario Analysis
Source: Continuum Economics
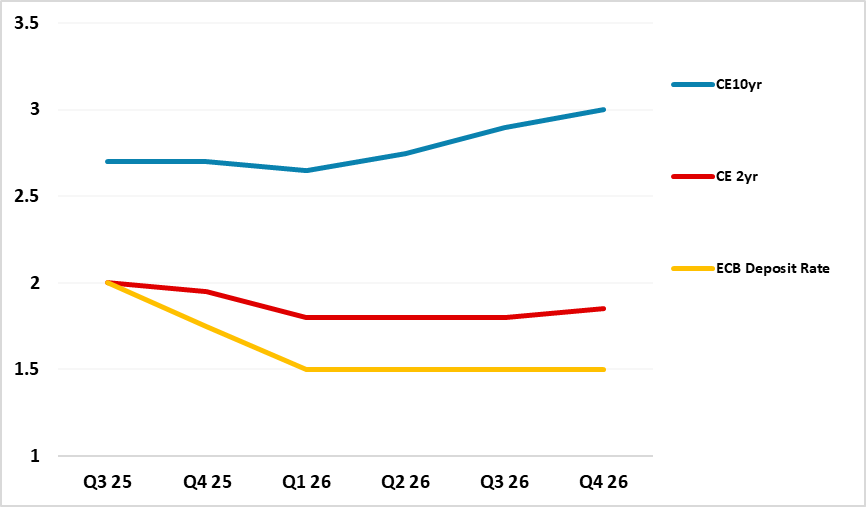
In the EZ, the market is taking the view that the ECB easing cycle has likely ended, which in the pre GFC period normally meant that 2yr German yields went to a premium versus the ECB depo rate as the next tightening cycle was discounted. However, the ECB will likely dampen any talk that 2026 could see a tightening, given that H2 2025 will see a slowdown from the impact of tariff implementation. Additionally, excess reserves in the system likely restrain the scale of premium for 2yr and we see scope in the coming months for +25bps (Figure 6). Even if the ECB cuts in December as we expect, the market will likely view this as the last rate cut. However, we feel that the ECB is underestimating disinflationary pressures (here) from wages and also from redirected China exports, while the growth rebound in 2026 will likely prove less than the ECB expects as financial conditions are tighter than the policy rate level. For us this means one final 25bps cut in the deposit rate to 1.50%, which can bring down the level for 2yr Bunds, but the positive spread versus the ECB policy rate will likely remain in 2026. It is worth remembering that the ECB appeared to end the 2001 easing cycle only to restart 12 months later and then ease an additional cumulative 125bps.
Figure 6: ECB Deposit Rate, 2 and 10yr Germany Forecasts (%)

Source: Continuum Economics
For 10yr Bund yields, the more important influence is the inflation outlook and budget deficit/government debt trajectories. Though Bunds safe haven status has been boosted by the Trump administration attacks on Fed independence, we see the increase supply from the defense and infrastructure expenditure starting to kick in during 2026. This can prompt some further steepening of the yield curve, especially given our non-consensus view on ECB policy rates. 10-2yr has been moving in line with ECB easing (Figure 7), but has been steeper in the last 25 years. We feel that 10yr Bund yields will edge up gradually towards 3.0% through 2026 – especially in H2 (Figure 6). It is worth restating that Trump’s tariffs are disinflationary outside the U.S. and we see more disinflation than the ECB, which will likely cap the rise in 10yr yields.
Figure 7: 10-2yr Germany to ECB Refi Rate Inverted (%)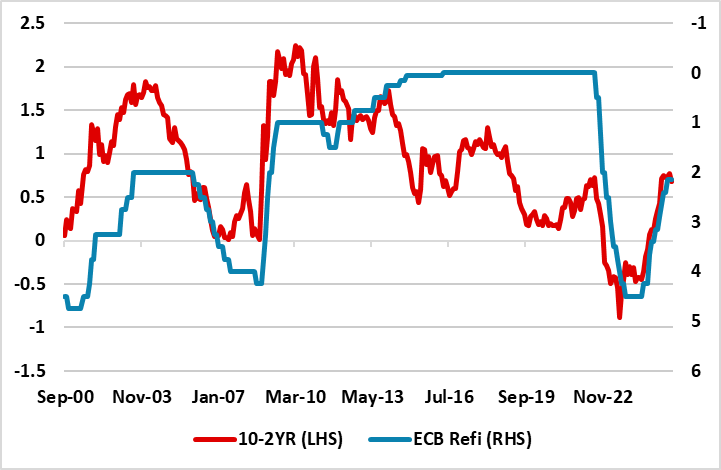 Source: Continuum Economics
For EZ sovereign spreads, the issue is more France than Italy, as expectations remain of a stable Italian government and fiscal consolidation until at least the December 2027 election. France is now stuck in political paralysis, which could see the 10yr OAT-Bund spread go to 100bps. We feel the French authorities will not ask for ECB TPI, given that the inability to agree fiscal consolidation and the likelihood the ECB would not agree to do so. However, against this environment, we also see the ECB slowing the pace of QT by around 25% at some stage in the next 12 months to ensure that policy rates are transmitted to the EZ economy and not for French reasons alone.
Figure 8: 10-2yr JGB and BOJ Policy Rate Inverted (%) 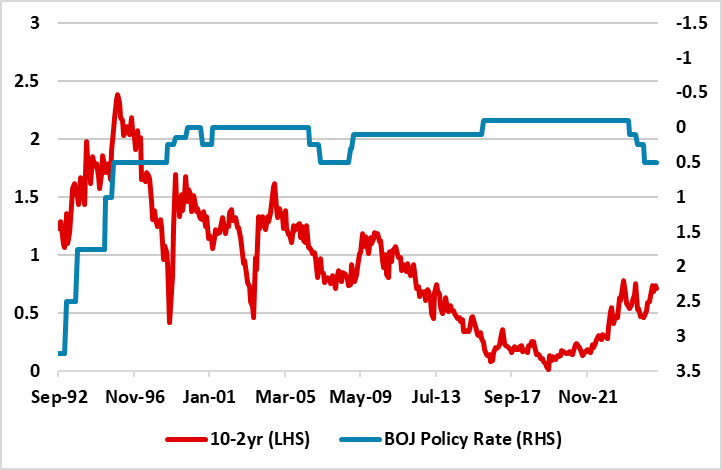 Source: Continuum Economics
In Japan, expectations of BOJ policy normalization remain key. The BOJ want to normalize, but the pace will be slow with base wage inflation and unit labor costs suggesting that current inflation will come down in 2026 and 2027. We see scope for the policy rate to rise to 1.00% in two steps over the next 9 months, before a growth slowdown is enough to produce a pause in the tightening cycle – we also expect CPI to come below 2%. For 2yr JGB’s, this cautious tightening will likely see a ratch up in 2yr JGB yields to 1.15% by end 2026. 10yr yields will be impacted by this BOJ action, but the widespread expectation is that the BOJ will lift the policy rate to 1% or slightly above over the next 2-3 years will reinforce a positive shaped yield curve. The slowing of gross bond purchases to a JPY2trn pm pace by Q1 2027, would equate to much more aggressive QT than ECB/BOE (Figure 4). However, we feel that GDP and inflation will not be high enough for the BOJ to be confident of such an acceleration in QT and this likely means that the BOJ could keep a JPY2.5trn pm pace from June 2026. Even so, the BOJ JGB holdings are falling faster than the 1999-2007 period when holdings were small up/small down or flat. During this period the 10-2yr yield curve averaged 100-125bps (Figure 8). Though Japan’s budget deficit is not excessive, it is still large enough to argue for higher 10yr yields in an era of QT and also changing demand among Japanese end investors for long-dated bonds. High 20 and 30yr yields in Japan also provide competition with 10yr yields. We see 10yr yields at 2.00% mid-2026 and 1.85% end 2026. The scale of BOJ QT is also so large that a long-end crisis occurs to cause the BOJ to actually increase gross monthly bond purchases and reduce net QT to a less aggressive percentage of GDP.
Figure 9: 10, 2yr Gilts and BOE Bank Rate Forecasts (%)
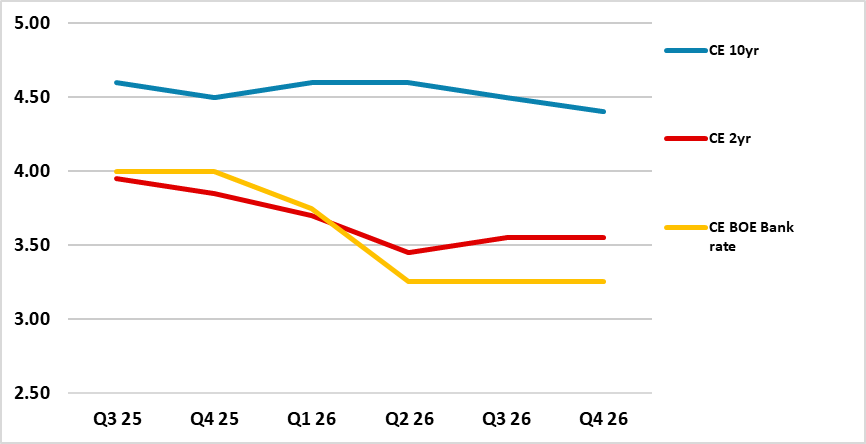
Source: Continuum Economics
In the UK, the BOE MPC is split on rate easing, but appears to want to see the November 26 budget to understand whether fiscal tightening will be backloaded or also impact growth in the next 1-2 years. With the floating votes on the MPC also wanting to see progress on monthly inflation, a pause is being discounted by the money and bond markets. However, with policy rate still restrictive; financial conditions also tight; inflation set to fall over the next 2 years and the UK employment deterioration and GDP growth remaining bumpy, the MPC consensus for further BOE rate cuts will return. We look for the BOE rate to come down to 3.25% (Figure 9), which will see 2yr yields moving lower. However, as the policy rate move towards perceived neutral levels and the easing cycle slows, the 2yr gilt yield will likely move to a positive spread versus the BOE policy rate. The 2yr-BOE bank rate pushed to 100bps at the end of the 1999 and 2002-2004 easing cycle, as the market looked to the next tightening cycles. However, a 2027 BOE tightening cycle is unlikely and we see the premium to 2yr yields will like be modest rather than large (Figure 9).
Figure 10: 10-2yr and BOE Bank Rate Inverted (%)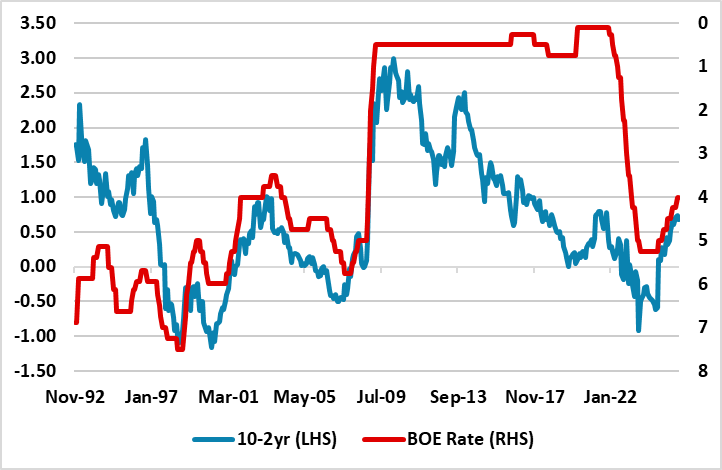 Source: Continuum Economics
10yr Gilt yields can be held up by huge supply pressures, as the BOE’s reduction in QT to £70bln in the next 12 months still leaves the market needing to absorb net bonds of 6.0-6.5% of GDP (Figure 4) once the CGNCR ex Network Rail net issuance is added. End 2025 we forecast 4.60% (Figure 9). We would argue that BOE QT should have stopped gilt sales and proceed at a moderate pace multi-year, but we will likely see a further slowing in September 2026 to a £35-50bln pace for the following 12 months. Cumulative BOE easing can feed through in 2026 to produce a decline in 2yr and further yield curve steepening, though we would take the view that this slows around 100bps rather than returning to the steeper 10-2yr yield curve seen in the 1990’s (Figure 10). A 100bps yield curve would be steep enough to encourage some lengthening of duration provided the government sticks to its fiscal rules in the 2025 and 2026 fiscal announcements. This would translate into a small decline in 10yr yields in 2026.