DM Rates Outlook: Yield Curve Steepening?
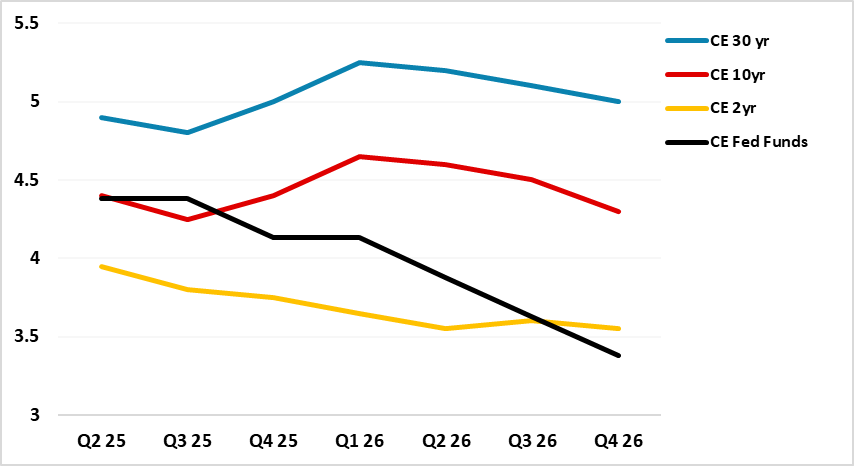
• We see the U.S. yield curve steepening in the next 6-18 months. 2yr U.S. Treasury yields can step down with cautious Fed easing on a modest/moderate growth slowdown and also if the Fed keeps an easing bias in H2 2026. 10yr U.S. Treasury yields face a tug of war between lower short-dated yields and a burgeoning budget deficit (heavy issuance) and the government debt trajectory (sustainability and rating concerns) if (as we expect) the 10yr budget bill passed is similar to the House Bill. Foreign accounts could also demand high mid to long-term yields as they are troubled by the Trump administration’s adverse and erratic policymaking; concerned they are overweight U.S. assets and factoring in a multi-year USD downtrend. We have recently revised up our 10yr yield forecasts to be centered around 4.5% in the next 6-18 months (here). • EZ yield curve steepening can be seen H2 2025, as the ECB is overestimating growth prospects and we see 25bps ECB depo rate cuts in September and December that can see 2yr yields modestly lower. 2026 is more difficult, as the 2yr yields will push higher to a positive premium versus a 1.5% ECB depo rate. However, 10yr Bund yields will also likely rise towards 2.75-3.00%, as yield curve steepening continues with an economic recovery into 2026 and due to bond issuance for European defense spending/infrastructure funds. • We see a 25bps hike from the BOJ in September/October and then one single 25bps hike in Q1 2026 before the BOJ pauses. This can ratchet up 2yr JGB yields over the next 3-18 months. 10yr yields will also likely rise, as overall yields are low enough that the short end rise lifts the whole curve out to 10yrs. Though we see slower BOJ JGB holdings rundown, QT can drive further yield curve steepening in Japan. 10yr yields are forecast at 1.80% for end 2025. Risks to our views: The U.S. economy sees a harder landing towards stagnation or mild recession and the Fed expects inflation to move towards the 2% core PCE target in 2026. Fed easing is quicker and to a neutral policy rate at 3% or potentially just below. 2 and 10yr yields decline more quickly in 2025 (Figure 4).
Figure 1: Fed Funds, 2 and 10yr U.S. Treasury Yields Forecasts (%)
 Source: Continuum Economics
2yr yields are dependent on the Fed leaving the door open to rate cuts and then actually starting to cut rates later this year. This is our baseline view and we see a 25bps Dec cut after the monthly inflation numbers come back under control after a Q3 pick-up and the risk of 2nd round effects from tariff increases has passed. We then see three 25bps cuts from the Fed in 2026, which can bring the 2yr down modestly multi quarter (Figure 1). However, as 2026 progresses, we see 2yr yields drifting to a small premium versus the Fed Funds rate, which is consistent with the experience seen in the pre GFC period (Figure 2) towards the end of an easing cycle. This would be a larger premium in 2026 if the market started to fear that the next move in the Fed Funds rate would be towards tightening in 2027 after a two phase easing cycle 2024-2026. This is unlikely with tariff and trade policy headwinds and the market will likely still hope that further easing could be possible towards the neutral policy rate estimated by Fed officials to be 3%.
Figure 2: 2yr-Fed Funds Spread and Fed Funds Rate Inverted (%)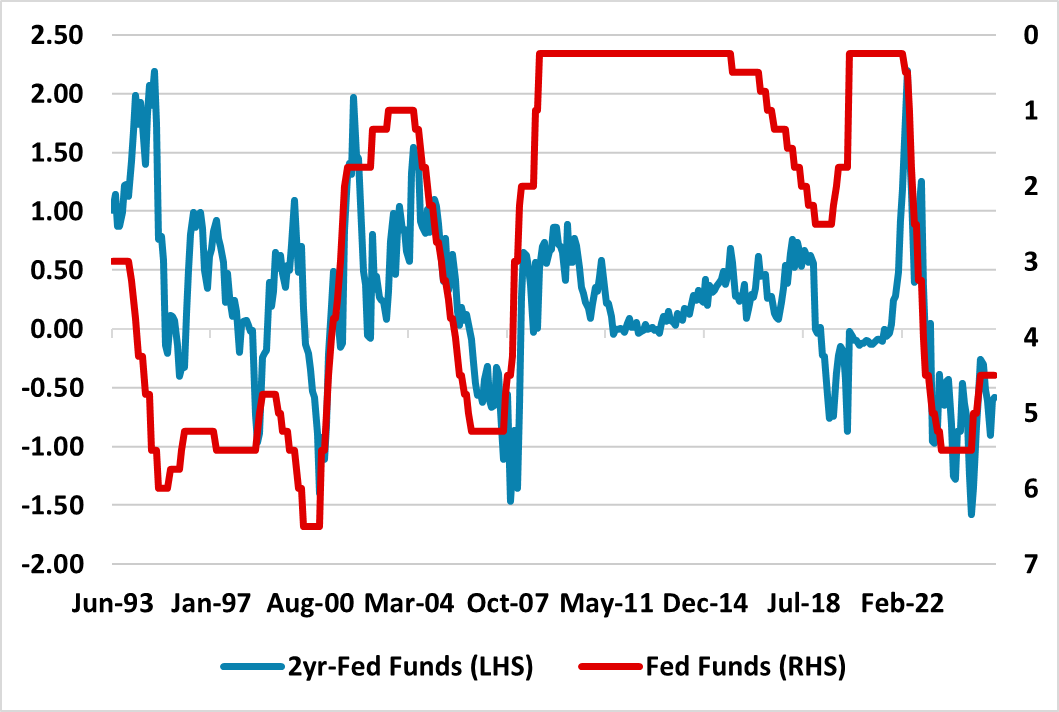 Source: DataStream/Continuum Economics
10yr yields face a tug of war. The front end of the curve into 2026 can see lower yields that act as a force to drag yields down and some of this can be seen into Q3 with soft economic data. However, 2% real yields for 10yr may not be high enough, both with the persistent heavy issuance and foreigners less willing to invest in U.S. Treasuries without extra risk premium. The 1998-2002 period saw an average of 3.5% 10yr real yields in the days before heavy EM central bank purchases of Treasuries from 2003 onwards. TICS and Fed data need to be watched closely to see the scale of foreign net buying or selling. It could be that the cyclical conditions mean that 2% is the right real yield, but we feel that 2.0-2.5% real yields will likely be required (here). With 10yr breakeven inflation of 2.3%, this translates into 10yr nominal yields centered around 4.3-4.8%. We are thus raising our 10yr yield forecasts modestly (Figure 1), especially in 2026 when the tariff storm will be past its worst. 10-2yr can push to over 100bps by early Q1 2026, though this is not steep by the pre GFC experience (Figure 3). Re U.S. attack on Iran, our baseline oil view remains that the effect will be temporary and that oil prices will move to USD62 by end 2025.
Figure 3: 10-2yr U.S. Treasury and Fed Funds Inverted (%) Source: DataStream/Continuum Economics
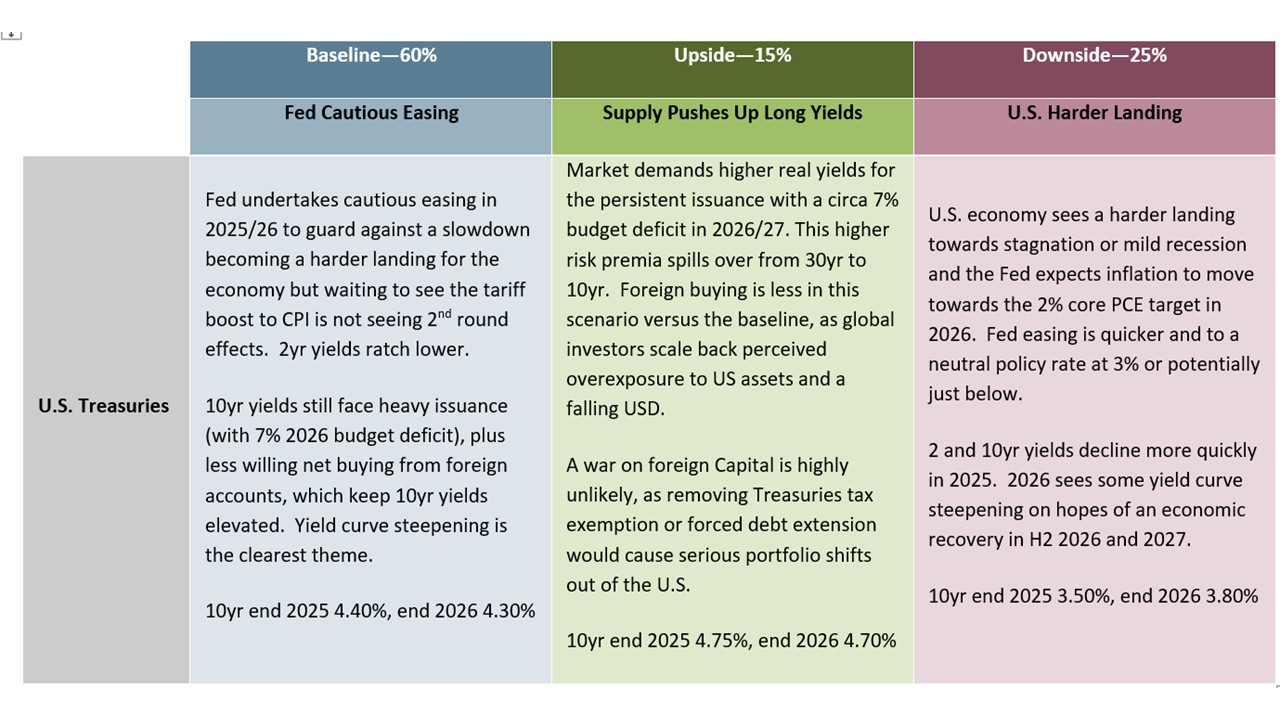
In terms of alternative scenarios around our baseline, the bias is for lower yields (Figure 4). A harder landing for the U.S. economy could cause more aggressive Fed easing and a large decline in U.S. Treasury yields in 2025. 10yr yields could come down to 3.25-50%, with debt concerns being overlooked. A modest risk of higher yields than the baseline also exists, if investors demand a big premium for 10 and 30yr bonds due to heavy supply and new foreign buying is scaled back more significantly.
Figure 4: 10yr U.S. Treasury Scenario Analysis
Source: Continuum Economics
The outlook for 2yr Bunds depends on whether the ECB goes on hold or continues to ease at a slower pace in H2 2025. We feel that the ECB is being over optimistic about a small tariff spillover, as U.S./EU trade negotiations will in the end likely end up with 15% overall tariffs on EU goods – given Trump’s deeply ingrained distrust of European exports. Additionally, the ECB is also overly optimistic about the defense spending build up boosting EZ growth in 2026. We are less upbeat than the ECB on growth and feel that a 25bps cut will likely be delivered in both September and December. This will not be a smooth process for market expectations of further easing, as some of the ECB hawks will argue that enough easing has been done already.
Figure 5: ECB Deposit Rate, 2 and 10yr Germany Forecasts (%)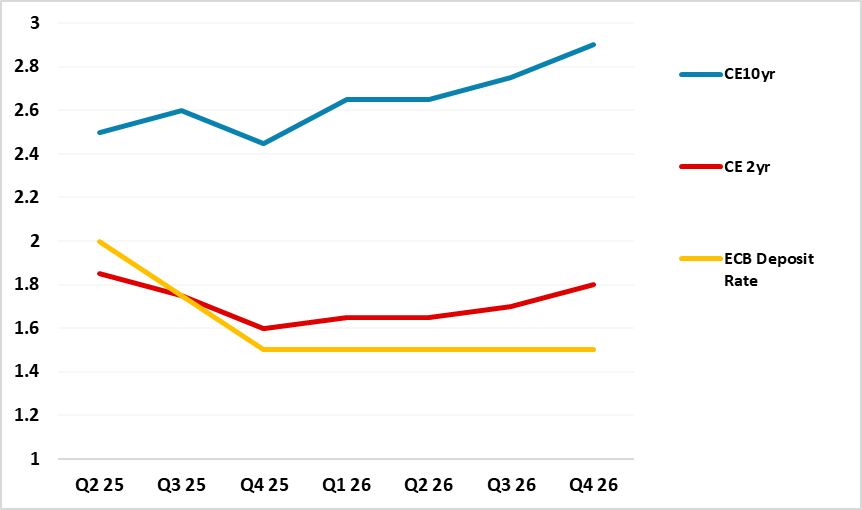
Source: Continuum Economics
We thus see a further small decline in 2yr Bund yields in H2 2025. However, when the depo rate reaches 1.5%, the majority of the ECB Council will likely turn neutral and this will leave the market wondering whether the next ECB cycle is towards higher policy rates in 2027-28. This can see 2yr Bund yields edging up through 2026 to a consistent positive spread versus a 1.5% ECB depo rate. The 1999-2007 experience saw a large positive spread between 2yr and ECB depo rate. We would argue for a low spread in 2026, based on the ECB keeping large excess liquidity to keep EONIA controlled. 25bps on 2yr Bunds v ECB depo rate seems about right, unless the economic arguments were to grow for an early 2027 tightening – unlikely in our view.
Figure 6: 10-2yr Germany to ECB Deposit Rate Inverted (%)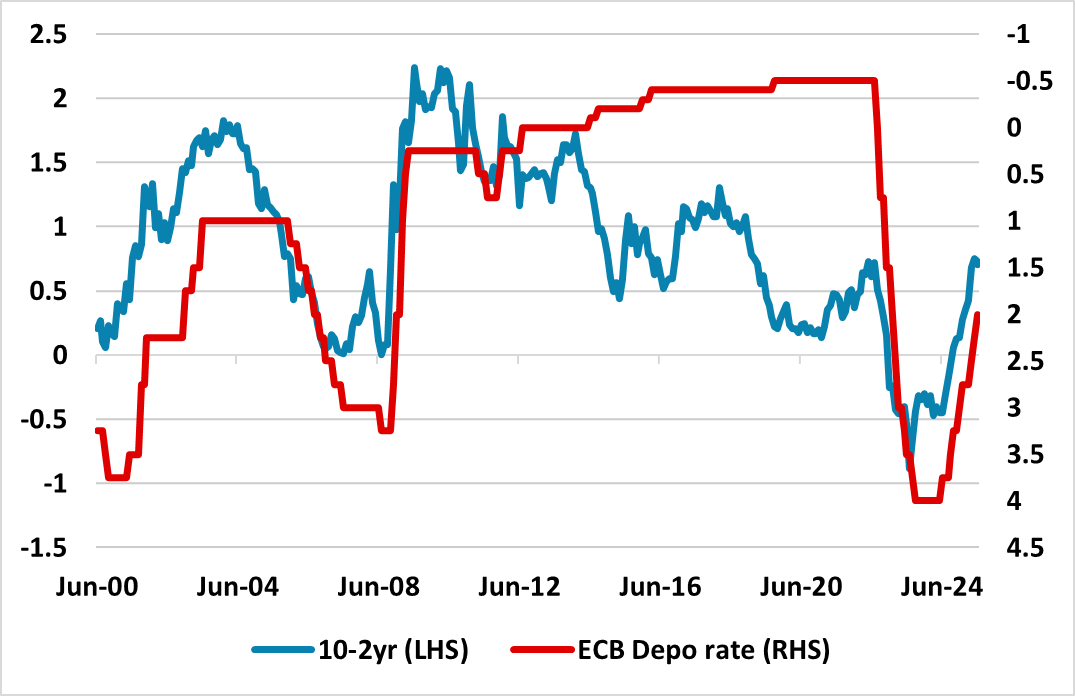 Source: Continuum Economics
For 10yr Bund yields, we see a weaker economic recovery than the ECB in H2 2025, which will likely keep yields close to current levels (Figure 5). However, with 2026 economic recovery and the ECB ending the easing cycle, we see normal yield curve steepening extending. 10yr real Bund yields are low compared to the U.S/UK and this new period after the end of ultra-low interest rates and QE. The 10-2yr Bund curve exceeded 150bps at the end of the 2003 easing cycle, when the depo rate got down to 1% (Figure 6). However, we do not see too steep a yield curve in the next 12 months and we see the ECB eventually slowing QT by returning to undertake partial reinvestment – the ECB risks a Fed style 2019 money market problems if excess liquidity falls quickly below EUR2.0trn (here). German borrowing will increase under the new government as already outlined, but we see this as a secondary issue for yield curve steepening.
For EZ sovereign spreads, the ECB easing cycle has helped to narrow the 10yr BTP-Bund spread, as investors chased intra EZ yield spreads – perceptions of U.S./UK fiscal problems hashave also helped inflows. This can stay tight in H2 2025, but as 10yr Bund yields rise towards 3% we feel that 10yr BTP-Bund spread can widen. This will likely be modest and seen to be technical in nature, as Italian PM Meloni does provide both political and fiscal stability and the next election could be as late as December 2027. We see the 10yr spread at 105bps by end 2025 and 115bps end 2026.
Figure 7: 10-2yr JGB and BOJ Policy Rate Inverted (%) 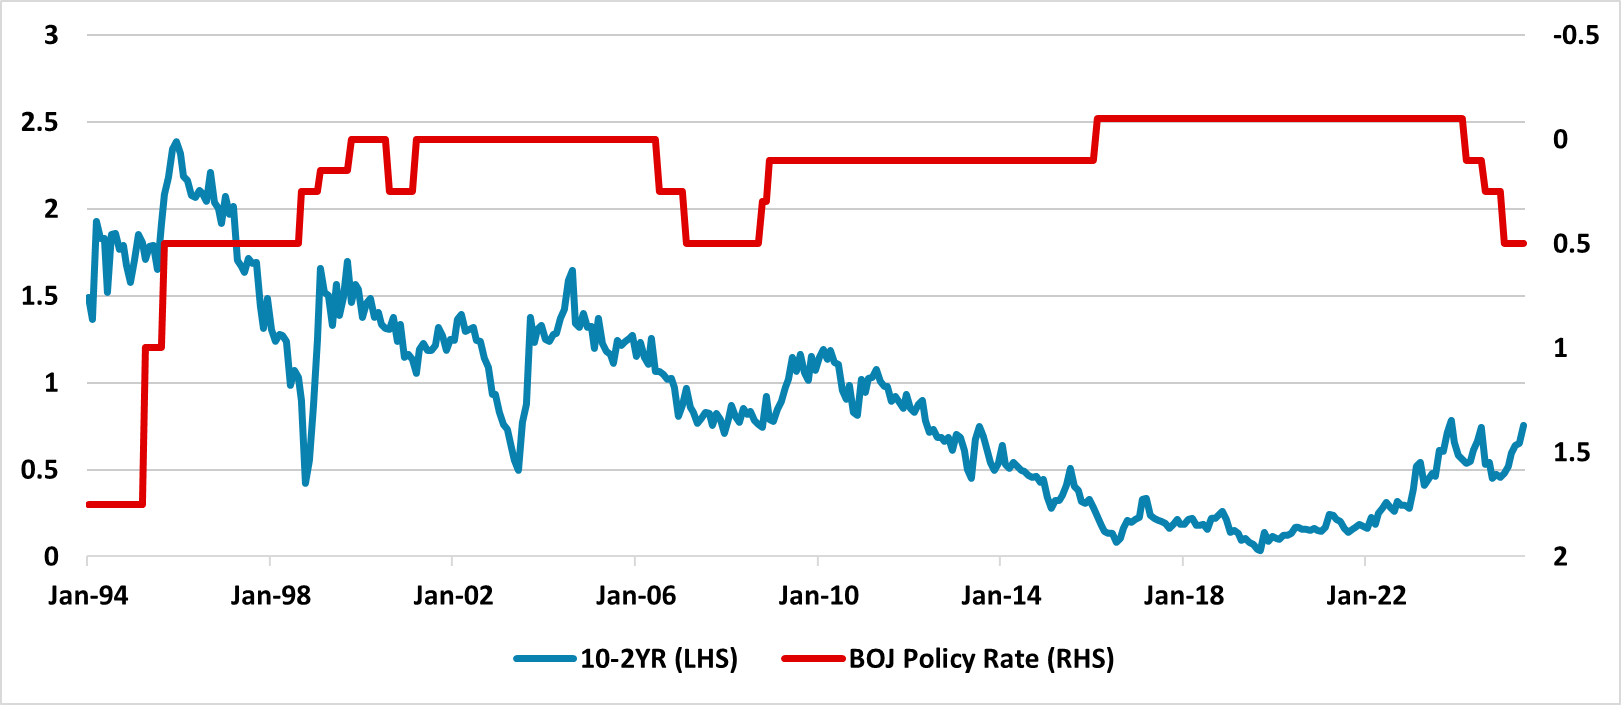 Source: Continuum Economics
Expectations of BOJ policy normalization remain key. For 2yr JGB’s, the expectations are that this will be at a slow pace, with the next 25bps hike not fully discounted until H1 2026. The tariffs and trade threats have tempered BOJ action for now. However, inflation remains consistent with the case for BOJ normalization to deliver a further 25bps hike in 2025 and we see the risk of an earlier than expected hike in September/October 2025 after aafter a trade deal is done with the U.S. We see 2yr yields at 0.95% end 2025. For 2026, we see consumer spending being soft, which dampens inflation and causes a CPI move back just below 2%. This can slow the BOJ normalization pace versus 2025 and we see only one 25bps BOJ hike in 2026.
10yr yields will be impacted by this BOJ action, but the widespread expectation is that the BOJ will lift the policy rate to 1% or slightly above over the next 2 years will reinforce a positive shaped yield curve. Some will also question whether the BOJ will slow bond purchases to a JPY2trn pm pace, which would equate to sizeable net QT (here). However, we feel that GDP and inflation will not be high enough for the BOJ to be confident of such an acceleration in QT. Even so, the BOJ JGB holdings are falling faster than the 1999-2007 period when holdings were small up/small down or flat. During this period the 10-2yr yield curve averaged 100-125bps (Figure 7). Though Japan’s budget deficit is not excessive, it is still large enough to argue for higher 10yr yields in an era of QT and also changing demand among Japanese end investors for long-dated bonds. High 20 and 30yr yields in Japan also provide competition with 10yr yields. We see 10yr yields at 1.80% end 2025 and 1.85% end 2026.
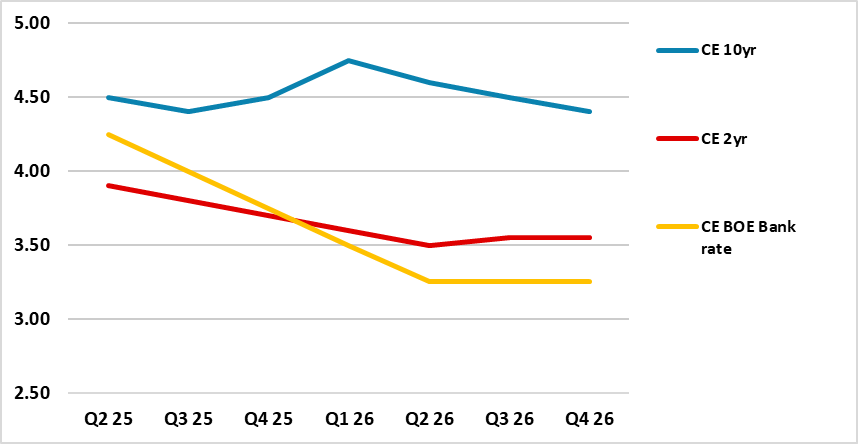
Figure 8: 10, 2yr Gilts and BOE Bank Rate Forecasts (%)
Source: Continuum Economics
The stickiness of service CPI and wage inflation will likely cause the BOE MPC to have intermittent splits, but we would still see the BOE delivering two further 25bps cuts in H2 2025 given softness in the economy. This can help 2yr decline by end 2025 (Figure 8). The situation could then become volatile in 2026, as some of the MPC will want the BOE to pause at 3.75% or 3.50% to see the lagged effect of previous monetary easing. This can slow the pace of easing down in 2026, though we still forecast two 25bps cuts (Figure 8). Policy communication and forward guidance could become difficult. Normally towards the end of an easing cycle the 2yr moves to a premium versus the BOE bank rate and this pushed to 100bps at the end of the 1999 and 2002-2004 easing cycle (Figure 9), as the market looked to the next tightening cycles. However, a 2027 BOE tightening cycle is unlikely. While the policy rate remains above the MPC view on the neutral rate (around 3-3.5%), the premium to 2yr yields will like be modest rather than large (Figure 8).
Figure 9: 2yr-BOE Bank Rate and BOE Bank Rate Inverted (%)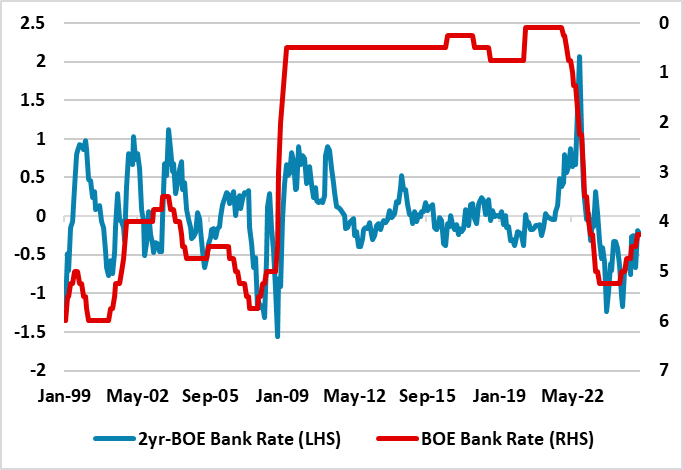
Source: Continuum Economics
10yr Gilt yields can be held up by huge supply pressures, as the BOE £100bln QT bond rundown is more aggressive than other DM central banks. With the 2025/6 government budget deficit of £117.7bln (the CGNCR ex Network Rail that drives net gilt issuance is £142.7bln), this is substantially increasing the net issuance that the private market has to absorb at close to 8% of GDP once BOE QT is taken account of ((here p140). We do see the BOE slowing the pace of QT from September 2025 (here), which should reduce the scale of supply that the market has to absorb. This involves some compromise from the BOE, which likely mean that outright gilt sales are slowed rather than stopped. We would argue that QT should stop gilt sales and proceed at a moderate pace multi-year, but a majority of MPC members may not adopt this view. An annual pace of £75bln is likely, which would still mean that the CGNCR plus QT that the private sector faces net bond supply close to 7% of GDP. End 2025 we forecast 4.50% (Figure 8). Cumulative BOE easing can feed through in 2026 to produce a small decline in 10yr yields.