DM Rates Outlook: Policy Divergence
• 2yr U.S. Treasury yields can step down with cautious Fed easing on a modest/moderate growth slowdown and also if the Fed keeps an easing bias. 10yr U.S. Treasury yields can be helped by this easing and see a move down through 2025. However, the budget deficit will likely be 6.5-7.0% of GDP in 2026 on the House of Representatives plans. The market will also look for a positive shaped yield curve and increased term premia, if a hard landing is avoided. This makes it difficult to persistently break below 4.0%, unless a hard landing is seen.
• For 10yr Bund yields, the multi-year defense build-up will likely see a moderate positive yield curve, both on hopes that EZ growth could be better from 2026 onwards and as most funding will be via individual governments as well as a modest EU funds. However, we do not see too steep a yield curve in the next 12 months, given that the EZ economic recovery will be modest rather than sharp. ECB easing in 2025 will likely also be more than discounted, as the ECB is too high on its inflation forecasts. H2 2026 will likely see a renewed increase in 10yr Bund yields.
• A further 25bps BOJ hike will likely be delivered in May and prompt fears of further BOJ policy normalization. The impact will likely be to push 10yr JGB yields still higher, both given that the 10-2yr yield curve is not too steep and heavy end investor interest is only expected in the 1.75 to 2.00% area. In 2026, we see small declines in 2 and 10yr yields, as inflation surprises on the downside and prompts the BOJ to pause the normalization cycle.
Risks to our views: U.S. economy sees a harder landing towards stagnation or mild recession and the Fed expects inflation to move to the 2% core PCE target in 2026. Fed easing is quicker and to a neutral policy rate at 3% or potentially just below. 2 and 10yr yields decline more quickly in 2025.
Figure 1: Fed Funds, 2 and 10yr U.S. Treasury Yields Forecasts (%)
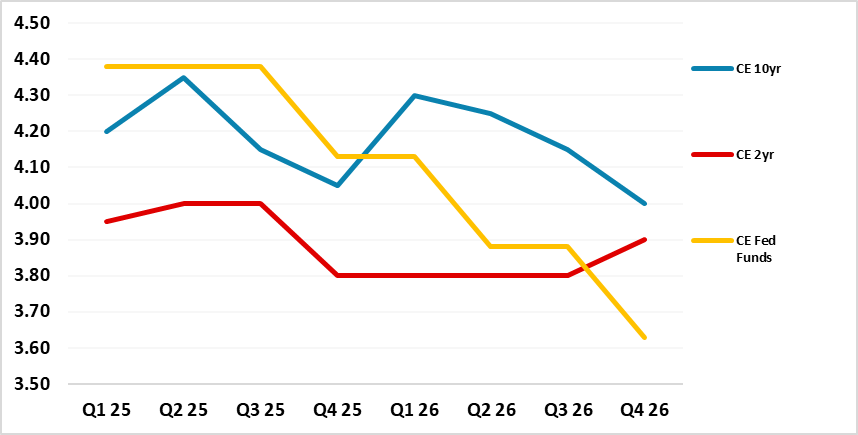
Source: Continuum Economics
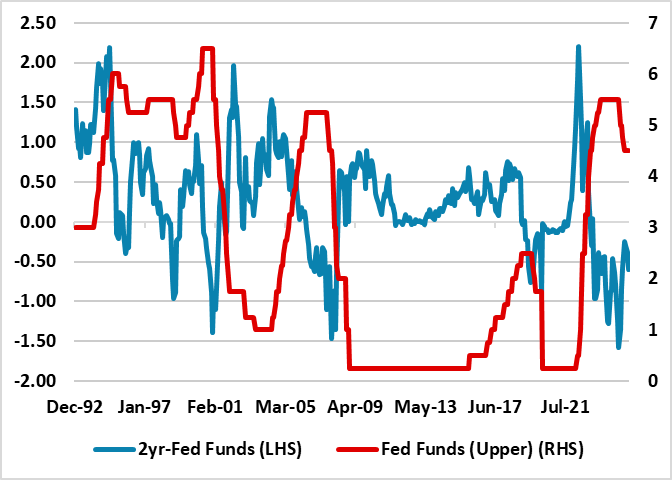
The short-end of the curve depends on the scale and pace of Fed easing. Our baseline is that the ongoing implementation of tariffs will broaden to more products (cars, lumber, semis and pharma) and reciprocal tariffs in April and some will be permanent. Combined with policy uncertainty generated by the Trump administration, the U.S. economy will likely suffer a moderate hit to growth but a modest boost to inflation. This causes a dilemma for the Fed, though we feel they will place more weight on the labor market and employment. We see 25bps of Fed easing in 2025 and 50bps in 2026 (Figure 1). For 2yr yields this gradual deliverance of policy easing should keep 2yr yields at a small discount to the Fed Funds rate. 2yr yields will also be helped by the policy rate still remaining in restrictive territory and the fear that a softening of the economy could turn out worse than expected (Figure 3). However, as 2026 progress we see 2yr yields drifting to a small premium versus the Fed Funds rate, which is consistent with the experience seen in the pre GFC period (Figure 2).
Figure 2: Fed Funds Rate and 2yr-Fed Funds Spread (%)
Source: DataStream/Continuum Economics
10yr U.S. Treasury yields can be helped by this easing and we see a move down through 2025 (Figure 1). However, the budget deficit will likely be 6.5-7.0% of GDP in 2026 with the House of Representatives plans. Though the Fed will likely slow or stop QT, and the Treasury reduce funding at the long-end of the curve, we still expect some supply pressures into 2026. The market will also look for a positive shaped yield curve and increased term premia, if a hard landing is avoided. Cumulative Fed easing can bring 10yr yields lower in H2 2026. In terms of alternative scenarios around our baseline, the bias is for lower yields (Figure 3). A harder landing for the U.S. economy could cause more aggressive Fed easing and a larger decline in U.S. Treasury yields in 2025. Elevated inflation and only a soft landing could provide upside risks alternatively – this latter scenario also includes the risk of toxic Trump administration ideas, such as forced extension of foreign central bank holdings into 100yr U.S. Treasuries – see here.
Figure 3: 10yr U.S. Treasury Scenario Analysis
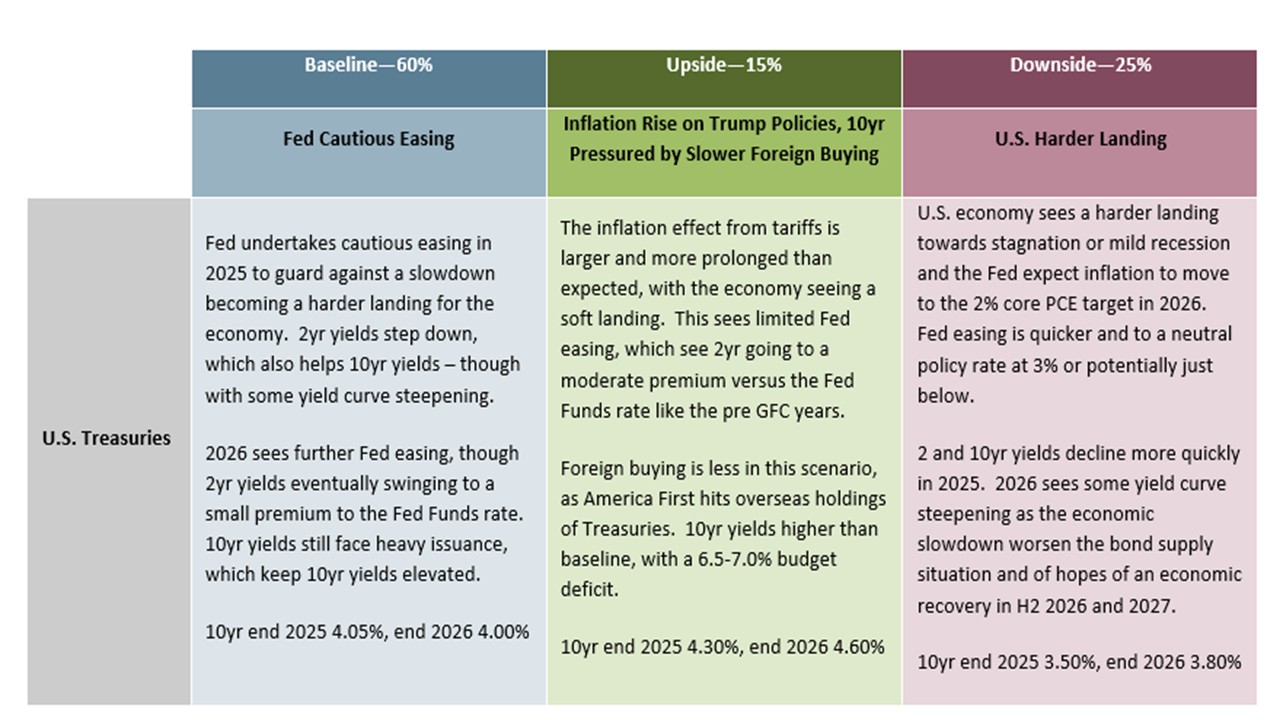
Source: Continuum Economics
The outlook for Bunds is a question of ECB easing versus fiscal policy stimulus and funding. Though the EU and EZ countries will continue to ramp up defense spending commitments, other countries are unlikely (and largely unable) to match Germany’s ambitions for infrastructure spending. The EZ fiscal stimulus will also not come through in the next 6-12 months, as Europe needs to work out where it wants extra defense spending to be concentrated and also organize common procurement and operations to allow European armies to work more closely without dependence on the U.S. Finally, the bond market has not fully discounted the high probability that the Trump administration will actually introduce some reciprocal and product tariffs against the EU, given Trump’s loathing of the EU and the large goods deficit with the U.S. This will likely mean that the ECB keeps on easing policy beyond March’s cut and we see 25bps in June and September (Figure 4).
Figure 4: ECB Deposit Rate, 2 and 10yr Germany Forecasts (%)
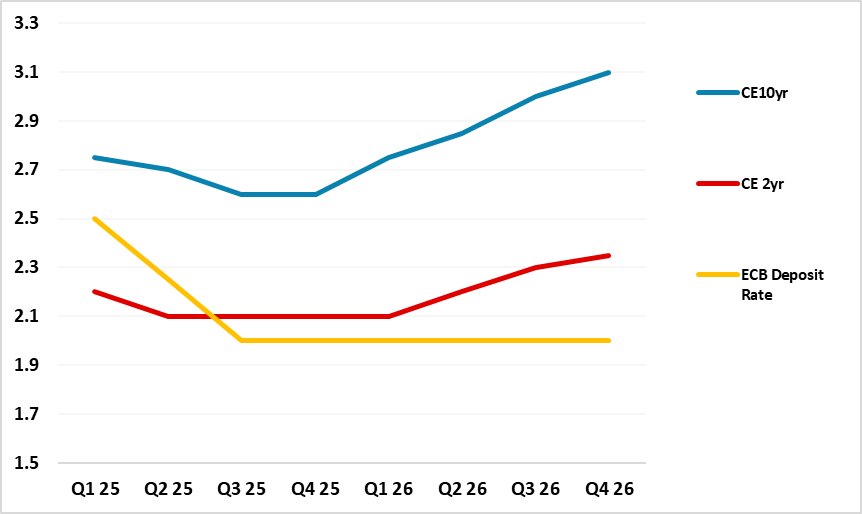
Source: Continuum Economics
For 2yr, the majority of the ECB Council will likely leave the door open to rate cuts over the next 12 months and this will likely mean that the 2yr Bund yield only moves to a small premium versus the ECB deposit rate (Figure 4). This premium could get somewhat greater in H2 2026 if the sense grows that the ECB policy easing has ended and the easing bias is removed to be replaced by a symmetric policy bias. At the end of the 2003 easing cycle, the 2yr premium versus the ECB deposit rate grew noticeably (Figure 5). For 10yr Bund yields, the multi-year defense build-up will likely see a moderate positive yield curve (Figure 4), both on hopes that EZ growth could be better from 2026 onwards and as most funding will be via individual governments. However, we do not see too steep a yield curve in the next 12 months, given that the economic recovery will be modest rather than sharp, see Figure 4. H2 2026 will likely see a renewed increase in 10yr Bund yields.
Figure 5: 2yr Germany to ECB Deposit Rate (%)
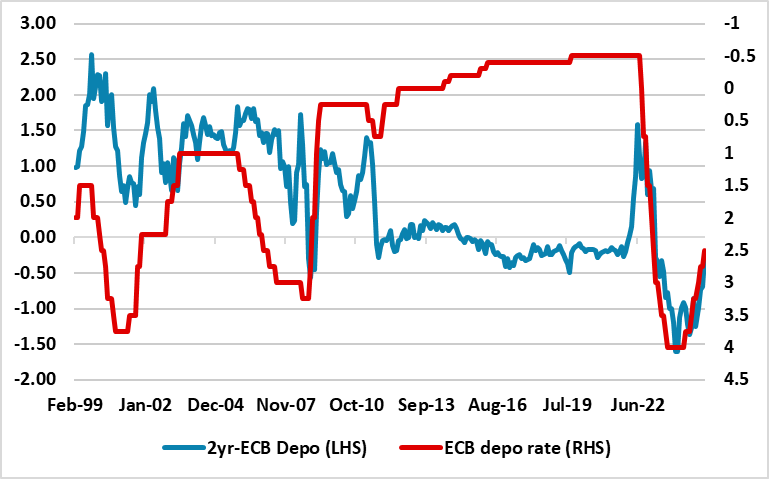
Source: Continuum Economics
For EZ sovereign spreads, we still feel that the 10yr BTP-Bund spread is too narrow, given the medium-term risks and given the level of U.S. long-dated yields. However, Italian PM Meloni does provide political stability and the next election could be as late as December 2027. This should mean that a slow widening bias should be evident and we see the 10yr spread at 120bps by end 2025. BOJ policy normalization will likely be maintained with a 25bps hike in May and the BOJ policy tightening bias remaining. This can see 2yr JGB yields pushing higher in the remainder of 2025 (Figure 6). The impact will likely be to push 10yr JGB yields still higher, both given that the 10-2yr yield curve is not too steep and heavy end investor interest is only expected in the 1.75 to 2.00% area. In 2026, we see small declines in 2 and 10yr yields, as inflation surprises on the downside and prompts the BOJ to pause the normalization cycle. Net exports will also likely be a drag on the real economy, due to the U.S. led trade wars impact on global trade and the rebound of the JPY.
Figure 6: 2, 10yr JGB and BOJ Policy Rate Forecasts (%)
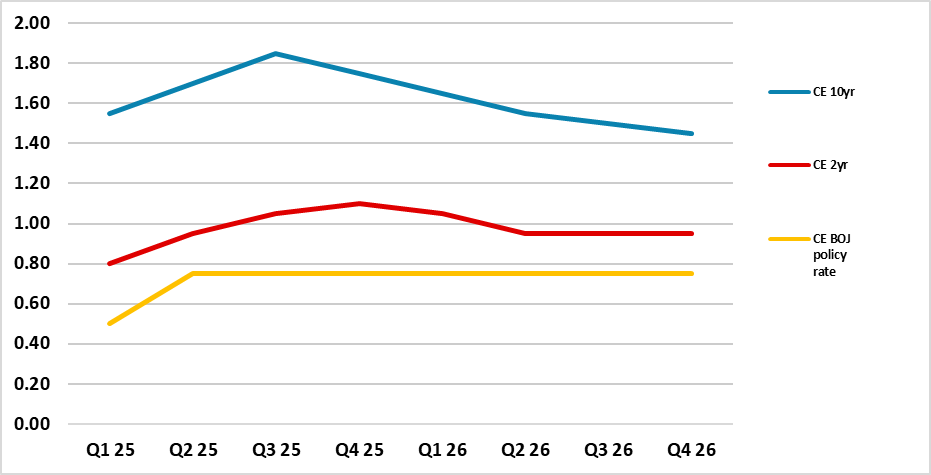
Source: Continuum Economics
Though some of the BOE hawks want to keep a restrictive policy stance, we see the majority of the MPC maintaining a quarterly easing pace (Figure 7). The UK economy is slowing due to still high policy rates feeding through and on UK tax hikes. The labor market is also softening and likely to deliver lower wage growth through the year thereby easing BOE concerns over core inflation. 2yr yields can follow this rhythm set by the BOE, though as the policy rate gets to the low 3’s a positive premium to the BOE bank rate should appear. 10yr Gilt yields can be held up by supply pressures, as the BOE £100bln QE rundown is more aggressive than other DM central banks. We do see the BOE slowing the pace of QT from September 2025, which should reduce the scale of supply that the market has to absorb. Combined with cumulative BOE rate cuts, this should see 10yr gilt yields coming down through the course of 2026.
Figure 7: BOE Bank Rate, 2 and 10yr UK Forecasts (%)
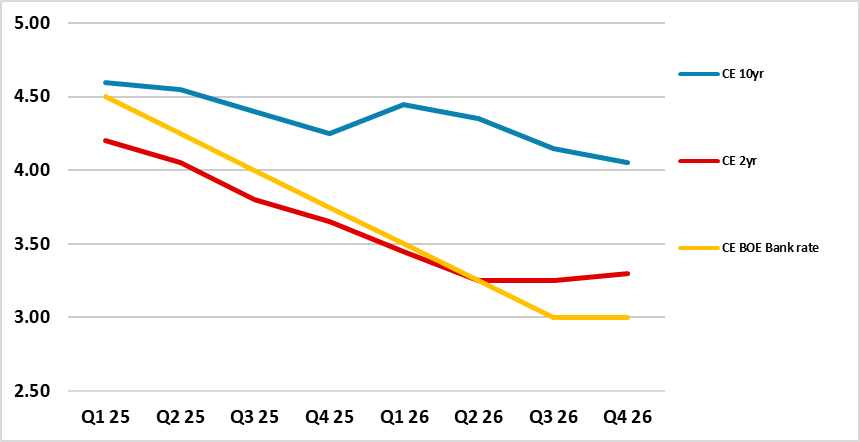
Source: Continuum Economics