DM Rates Outlook: Front End Favored
- U.S. Treasury yields will be dominated by the start date and pace of Fed easing. Our baseline view of a 125bps of easing in 2024 should translate into a noticeable decline in 2yr yields, as further easing is discounted in 2025. However, 10yr yields will come down more slowly, both due to the traditional swing back to a positive shaped yield curve and on supply from the large budget deficit – we also see the risk of a U.S. downgrade, especially in the H1 2025 period. We see 10yr U.S. Treasury yields 3.70% end 2024 and 3.90% end 2025. The front end is favored.
• EZ debt yields will also see a swing back towards a positive shaped yield curve. Gradual ECB rate cuts will translate into a persistent decline in 2yr yields in 2024, but slower in 2025 as the market will be uncertain about the terminal policy rate and the ECB forward guidance will likely remain weak. 10yr Bund yields will edge lower but not by much in 2024, as real yields (based on breakeven inflation expectations) are still low and are unlikely to return to negative territory.
• Finally, 10yr JGB yields can rise consistently through 2024 to around 1.60%, as the BOJ ends yield curve control and yields return to pre 2013 ranges. The rise in the short-end should be smaller, as a 10bps spring hike in the BOJ policy rate in Q1 will likely be only followed by a further 25bps hike in Q2 2024 but then no extra changes as inflation slows more than the BOJ projects. 10-2yr yield curve steepening is also forecast for Japan. End 2025 we see 10yr at 1.4%.
Risks to our views: A mild recession in the U.S. would lead to larger than projected Fed easing in 2024, which would bring yields down more across the curve – though still with a swing to a positive shaped yield curve occurring. The spillover would impact 10yr government bond yields in other DM countries.
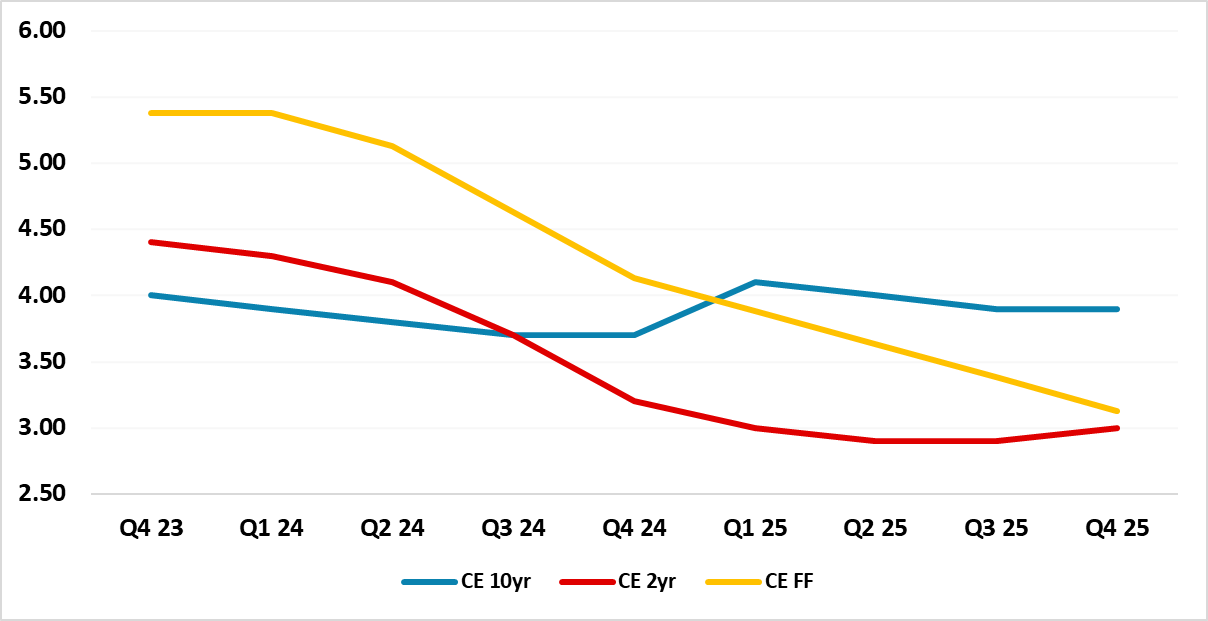
Figure 1: U.S. Treasuries Fed, Funds, 2yr and 10yr Yield Forecasts (%)
Source: Continuum Economics
Peak Fed Rates and Then Easing
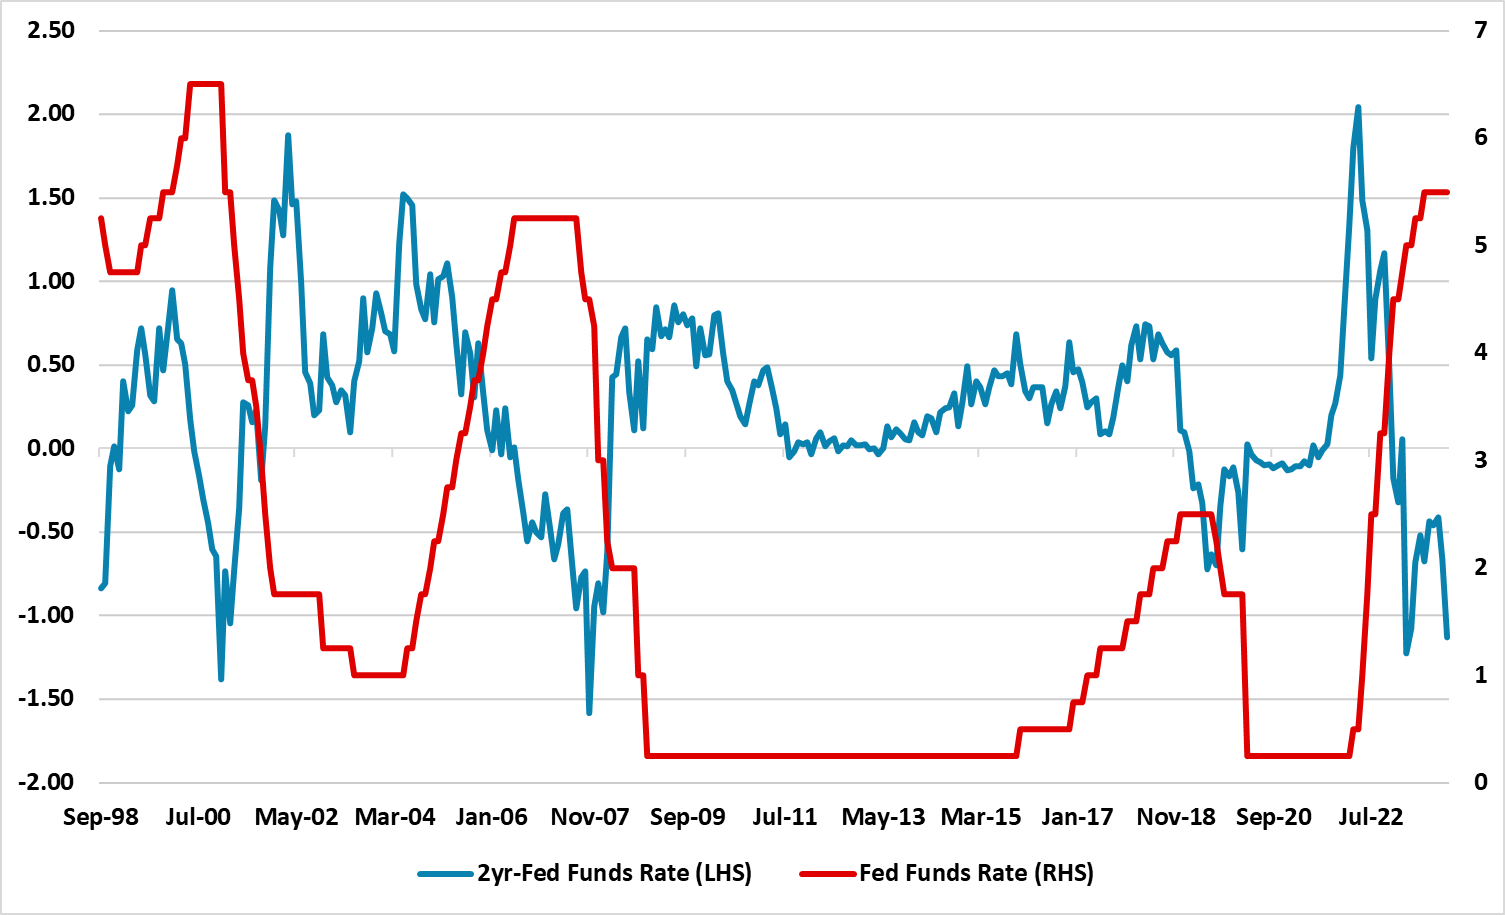
The December FOMC meeting (here) very much suggests that Fed Funds have probably peaked and the Fed could be easing by the spring – given Powell dovish press conference and the 75bps median 2024 cuts in the dots... We see a 25bps easing starting in Q2 (Figure 1) mainly to avoid real interest rates from rising, as inflation comes back towards target. However, the pace of easing will likely quicken, as GDP growth slows more noticeably from the lagged impact of monetary policy tightening and as the benefit from COVID handouts to household consumption finally fade. A further 100bps of cuts in H2 2024 will then likely follow, which will encourage the market to discount a decline in the Fed Funds rate towards 3% into 2026. We see 2yr yields at 3.20% by end 2024 and 3.00% by end 2025 (mid to late cycle tends to go back to a premia versus Fed Funds, see Figure 2).
Figure 2: 2yr-Fed Funds Spread (LHS) and Fed Funds (RHS) (%)
Source: Continuum Economics
Such a drop in 2yr yields is not at the pace of either of the 2000-01 or 2007-08 easing cycles (Figure 2) however. For 10yr yields, our baseline forecast is a further decline in 10yr yields in 2024, as the effects of noticeable easing cycle back towards neutral rates helps to spill along the curve. Nevertheless, the 10-2yr yield curve inversion will likely disappear with such Fed action and a positive yield curve will likely be reestablished by H2 2024 and we forecast 3.70% 10yr yields by end 2024 (Figure 1).
Indeed, 10yr Treasury yields could rise modestly in H1 2025 as a further debt ceiling drama and large budget deficits prompts one or more rating agencies to downgrade the U.S.’s credit rating. This will likely see end investors demanding a premia for 10yr yields versus 2yr yields and the Fed Funds rate throughout 2025. We do feel that the Fed will likely slow QT for monetary policy reasons in 2025 or potentially H2 2024 (here), as QT is contractionary and acts against monetary policy once an easing cycle starts in earnest. However, the Fed bias would likely be to compromise to slow QT rather than stopping, given the size of the balance sheet. This all means conflicting forces for 10yr yields and we forecast 3.90% 10yr yields for end 2025 and further yield curve steepening.
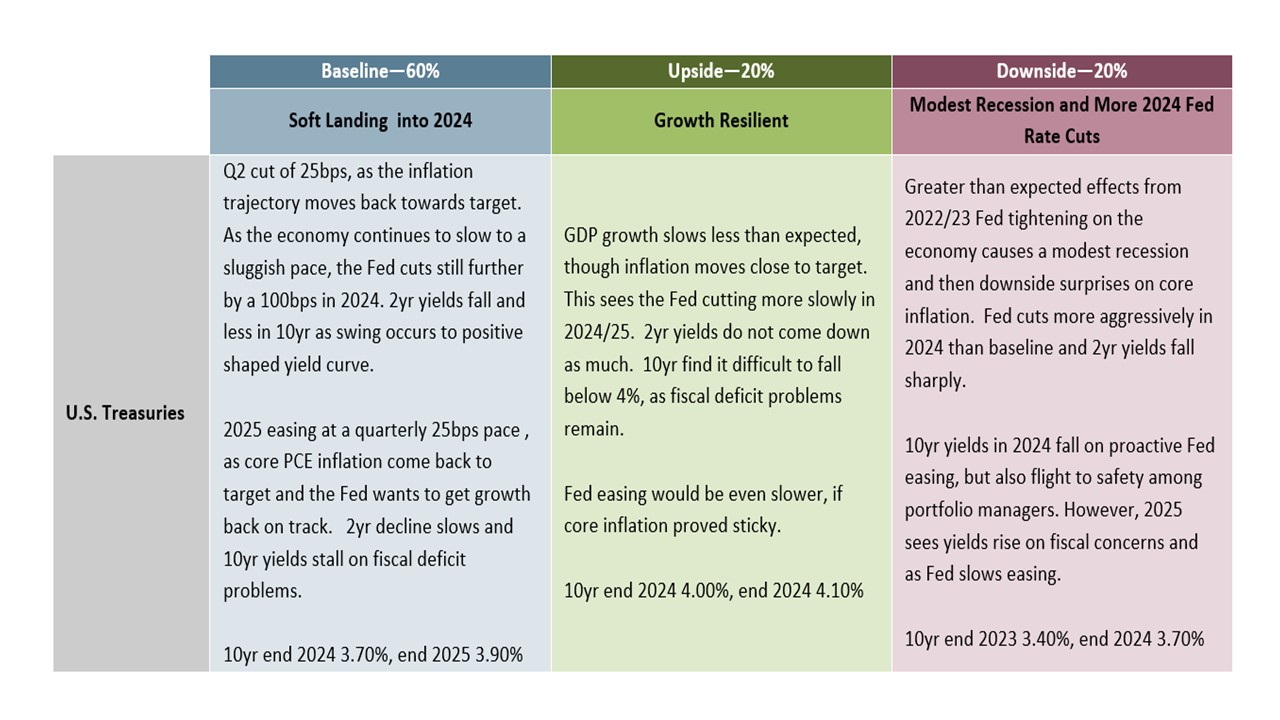
The Fed sensitivity to GDP growth/unemployment will likely grow, as inflation gets closer to target and the dual mandate comes back into focus. This means that GDP growth modestly above our forecast (Figure 3 upside) could see slower Fed easing over 2024/25 and less decline in 2 and 10yr yields. However, a mild recession in the U.S. would be enough to give the Fed confidence that core PCE inflation could return to target or undershoot and prompt more aggressive rate cuts down towards 2.5% in 2024. However, in all three scenarios we would project a shift back to a positive yield curve.
Figure 3: Main Scenario Assumptions for 10yr U.S. Treasuries
Source: Continuum Economics.
ECB Rate Peak and Eurozone Debt Yields
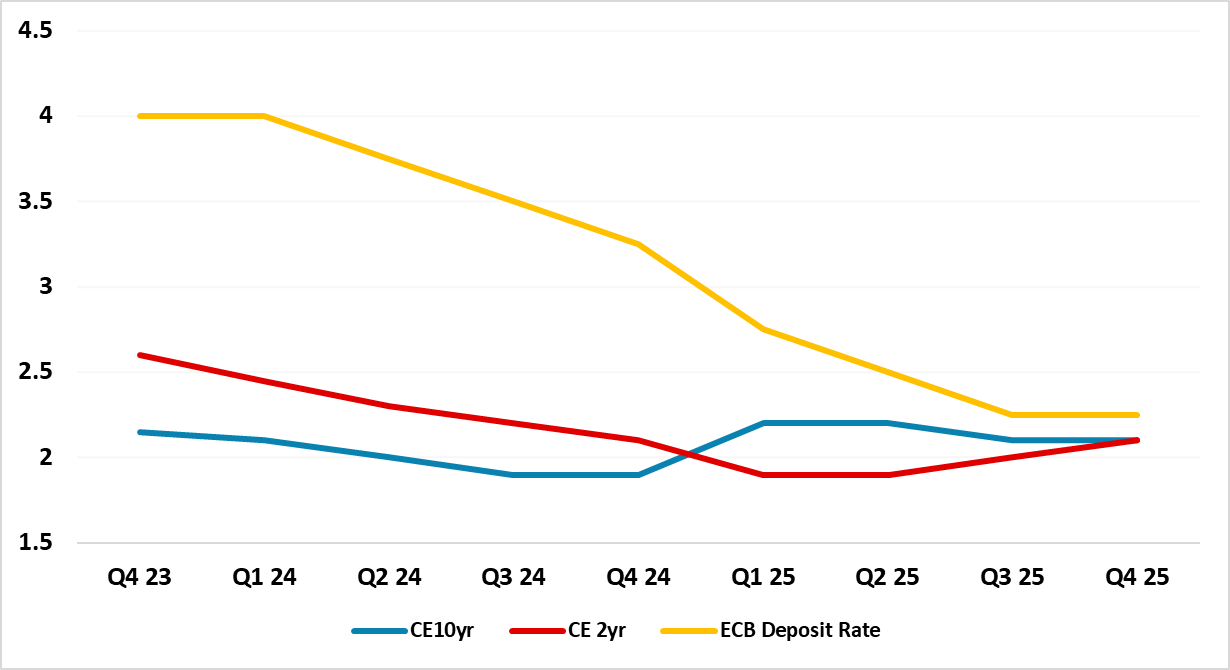
We feel that the ECB is headed towards 75bps of cuts in 2024 (here) and a further 100bps in 2025, both as the economic recovery in 2024 will be weak (after the H2 2023 recession) and as inflation continues to come back quickly to 2% (Q2 2024) and surprises the ECB even further. The ECB has overtightened in terms of interest rates, but also balance sheet reduction with the huge roll off of TLTRO’s. Policy needs to become less restrictive and shift towards neutral policy. While this is the strategic story for 2yr yields, ECB communications will likely not outline such a path and forward guidance will not be clear. This means a gradual path lower for 2yr yields in 2024 (Figure 4), as the 1st 25bps rate cut is delivered in Q2 2024 and a quarterly gradual pace follows. 2yr German yields are also already at a hefty discount to the o/n rate and ECB deposit rate. This is larger than the 2yr-Refi spread just before the 2001/2008 and 2011 ECB easing cycles. Thus a steady 25bps pace of ECB easing is unlikely to prompt a quick drop in 2yr yields. As ECB easing builds it will build expectations that the deposit rate can come back down to 2%. Though we see a temporary dip below a 2% deposit rate in 2026, 2yr yields will likely not push consistently below 2% as the easing cycle slows in H2 in 2025.
Figure 4: CE ECB Refi Rate, German 2yr and 10yr Yield Forecasts (%)
Source: Continuum Economics
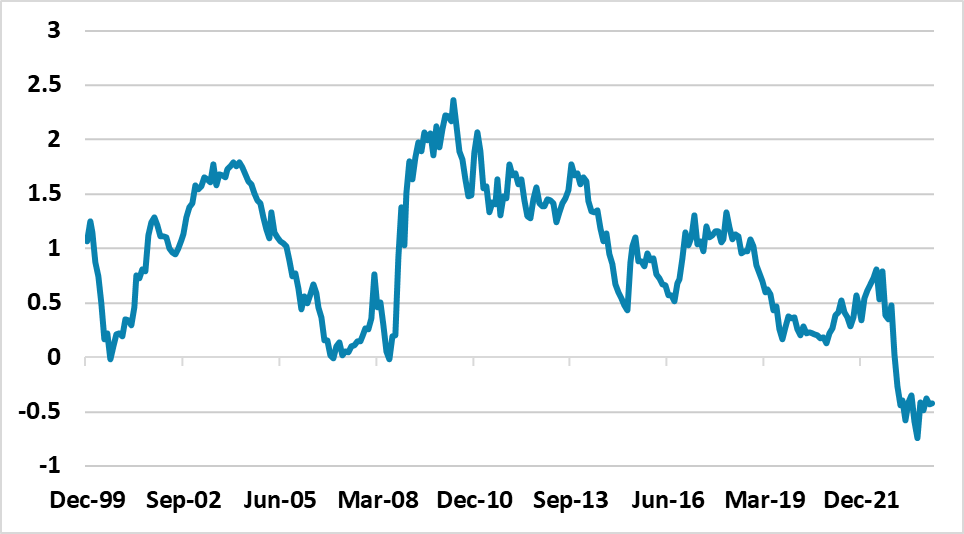
For 10yr Bund yields this is all crucial, as it means that the short-end will provide some interest rate relief. However, the traditional process of less yield curve inversion and then a positive shaped yield curve should also be evident (Figure 4). Meanwhile, the 10-2yr yield curve is already more inverted than prior to previous easing cycles (Figure 5). Additionally, though 10yr Bund yields have risen a lot since 2020-21, real yields using breakeven inflation rates are still low in real terms and this will likely mean that 10yr Bund yields are volatile but end 2024 at 1.9%. Thus we have a strong bias towards the front end of the curve. End 2025, we see 10yr Bund yields at 2.1%.
Figure 5: 10yr-2yr Germany Bunds Yield Curve (%)
Source: Datastream/Continuum Economics
In terms of EZ sovereign spreads, ECB easing should allow some relief to rising debt servicing costs for EZ governments. The bias also remains towards slow fiscal consolidation in key EZ countries, which is perhaps not quick enough for the purists but will likely be tolerated by the market. However, at the December meeting the ECB decided to partially stop PEPP reinvestments from H2 2024 and fully stop in Jan 2025. We see this as a policy mistake, as it will likely further squeeze bank lending but also increasing supply pressures for Italy/Spain and France. Thus we see a 10-20bps widening of sovereign spreads in the 10yr area. This could become disruptive if a pro expansionary fiscal policy government were elected in any key EZ country.
JGBs and Gilts
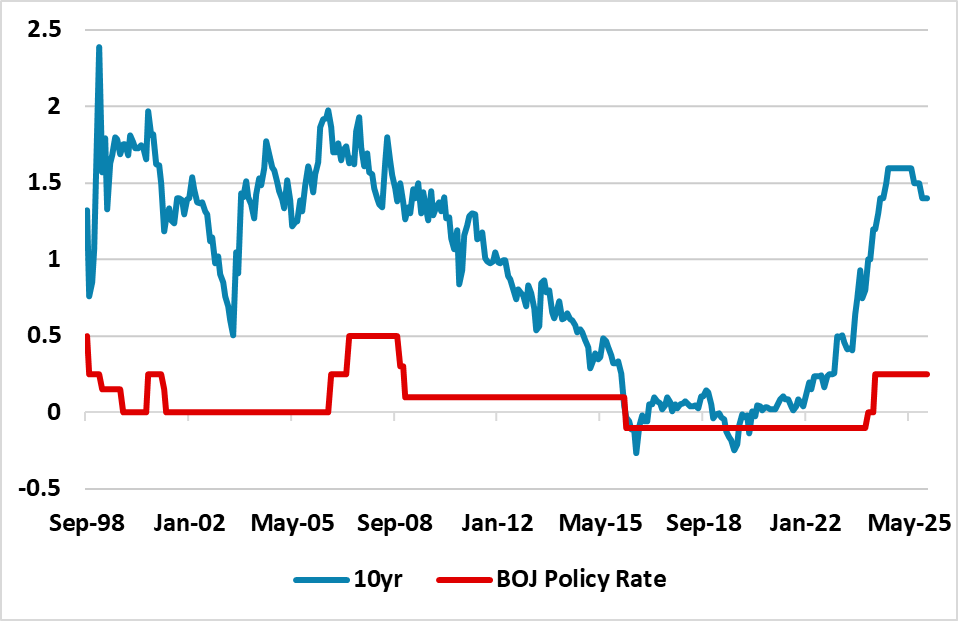
For 10yr JGB yields, the BOJ is preparing the way for yield curve control to be abandoned in H1 2024, with the shift to a 1% 10yr JGB reference rate. However, the 1st step in Q1 will likely be a rise in the BOJ policy rate (-0.1%) by 10bps to zero. The BOJ inflation forecasts will then likely drive them to 25bps of hikes in Q2, which has been done in 2000 and 2006 with less inflation pressure than currently. For 10yr yields, the end of YCC can mean pre 2013 type behavior in JGB yields (Figure 6). We see end investors being reluctant until 10yr yields move towards 1.50-2.00% and we forecast 1.60% end 2024 (here). BOJ bond buying will be designed to slow the pace of adjustment rather than protest at the level of 10yr JGB yields – though 2% 10yr JGB yields would likely be too much for the BOJ in the next 2 years.
We then see no further change in the BOJ policy rate from H2 2024 onwards. , as we see CPI inflation slowing below 2% (wage inflation not rising as much as expected in 2024 and PPI slowdown feeding through) and then to 1% in 2025. This will also cap 10yr JGB yields and we see 1.40% for end 2025.
Figure 6: 10yr JGB and BOJ Policy Rate – with Projections to End 2025 (%)
Source: Datastream/Continuum Economics
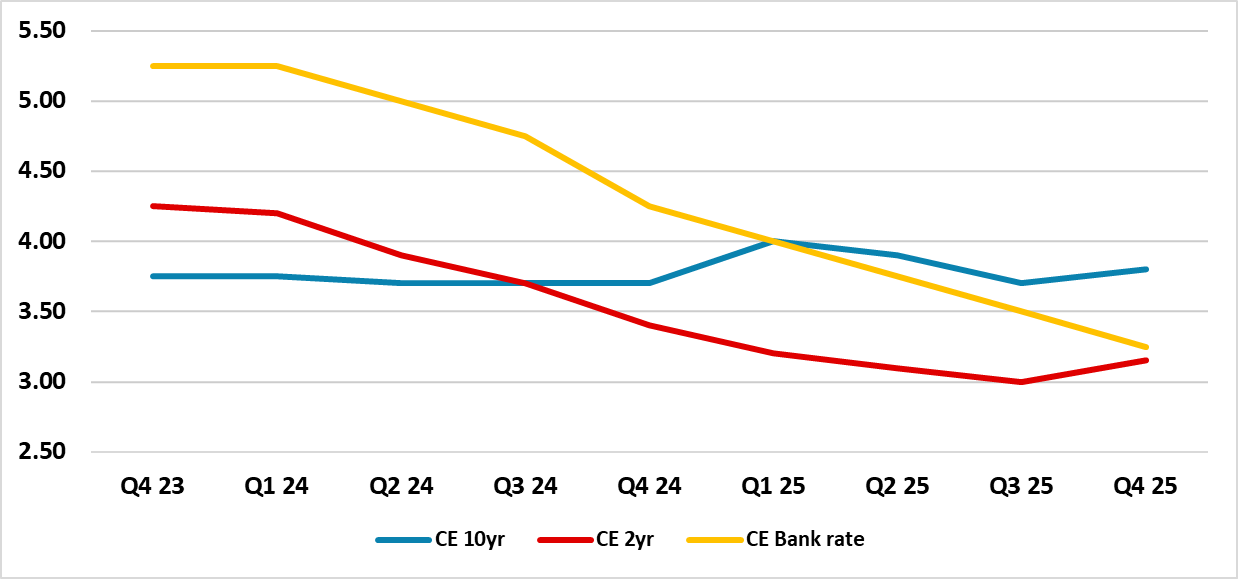
In 2024 the BOE will come to understand that it has overtightened, as real sector data confirms a dip in GDP growth and inflation data starts to come closer to 2% by H2 2024. Q2 2024 will likely see the first 25bps cut from the BOE, followed by a further 75bps of easing later in 2024 (two cuts in Q4). Still less than stellar 2025 growth will likely encourage the BOE to cut a further 100bps in 2025. This should led to a consistent decline in 2yr yields, as future BOE monetary policy report will effectively endorse some further easing embedded in market rates – BOE forward guidance is also better than the ECB for example. Also the current discount of 2yr to the bank rate is not excessive and is similar to numerous discounts seen in the pre GFC period and was much larger in 1998. Thus we can see a decline in 2yr yields to 3.4% by end 2024. We then see 3.15% by end 2025, as 2yr yields tend to swing towards a premia versus the Bank Rate in mid to late part of an easing cycle. Market sentiment by end 2025 will also be split on how low BOE bank rate can go.
10yr yields will decline marginally in absolute terms in 2024 helped by BOE easing and a modest decline in 10yr U.S. Treasury yields. However, the normal yield curve switch to a positive yield will likely mean that the decline is much slower than 2yrs. We do see the BOE slowing the pace of QT and this could come as early as H2 2024 (here). It is fine for the BOE to continue QT in the early stages of an easing cycle, but the BOE have admitted that QT is contractionary and a slowing will likely be evident once the rate cutting cycle speeds up in H2 2024. However, given the size of gilt holdings, the BOE will remain biased to carrying on some QT. Our view is for 10yr Gilt yields to 3.70% by end 2024. For end 2025, we see 3.80% as U.S. deficit concerns spillover and the 10-2yr yield curve steepen further.
Figure 7: CE BOE Bank Rate, UK 2yr and 10yr Yield Forecasts (%)
Source: Continuum Economics
