DM Rates Outlook: Rate Cuts Arrive Except Japan
• For U.S. Treasuries we see a steady easing process from the Fed from September, which can allow 2yr yields to fall consistently. However, the decline in H2 2024 will be slower at the long-end from traditional yield curve steepening pressures and then we see fiscal stress in H1 2025 under either U.S. president that can accelerate 10-2yr yield curve steepening and mean a multi month 30-40bps rise in 10yr U.S. Treasuries.
• ECB easing will likely be at a gradual quarterly pace for a further cumulative 150bps by end 2025. However, 2yr German yields are already discounting most of this and the market will not get clear ECB forward guidance on whether further policy easing will be evident in 2026. This means only modest declines in 2yr yields. 10yr German yields will be choppy, as real Bund yields are lower than the U.S. and can likely not fall much further. A positive shaped yield curve should be seen. Meanwhile, 10yr Italy-Germany can widen to 160-170bps by end 2025.
• We see scope for 10yr JGB yields to rise to 1.30% into H2 2024. However, we feel that the BOJ will be cautious on slowing bond buying over the next 1-2 years. More importantly, we only see a further 10bps in the BOJ policy rate, as Japanese consumers are clearly rejecting price pressures and this mean downside risks relative to the BOJ economic projections.
• The market is underestimating the lagged impact of BOE tightening, which will likely see inflation below target and the BOE consistently easing tight policy by 175bps cumulative by end 2025. 2yr yields will move lower to discount this picture. 10yr yields will likely be stickier due to competition with U.S. Treasury yields. An incoming Labour government will likely maintain the broad fiscal consolidation thrust however, which means no UK specific fiscal worries.
Risks to our views: Persistent inflation and little or no Fed easing causes upward pressure on yields across the curve. Alternatively, stagnation or a small recession in the U.S. would lead to larger than projected Fed easing in 2024, which would bring yields down more across the curve – though still with a swing to a positive shaped yield curve occurring into 2025. The spill over would impact 10yr government bond yields in other DM countries.
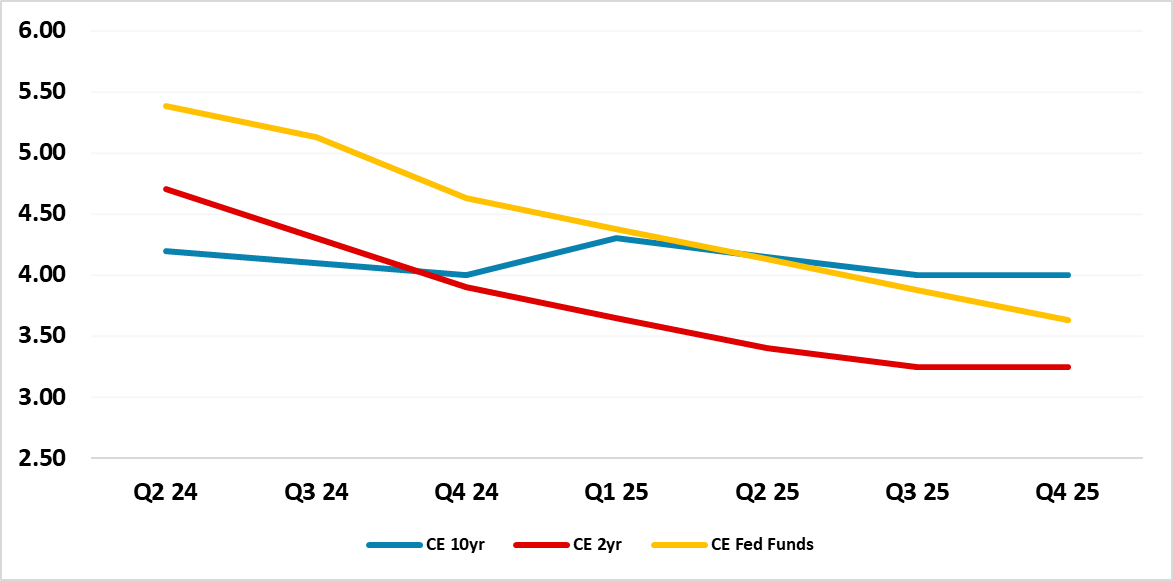
Figure 1: Continuum Economics Forecast Fed Funds, 2 and 10yr U.S. Treasury Yields (%)
Source: Continuum Economics
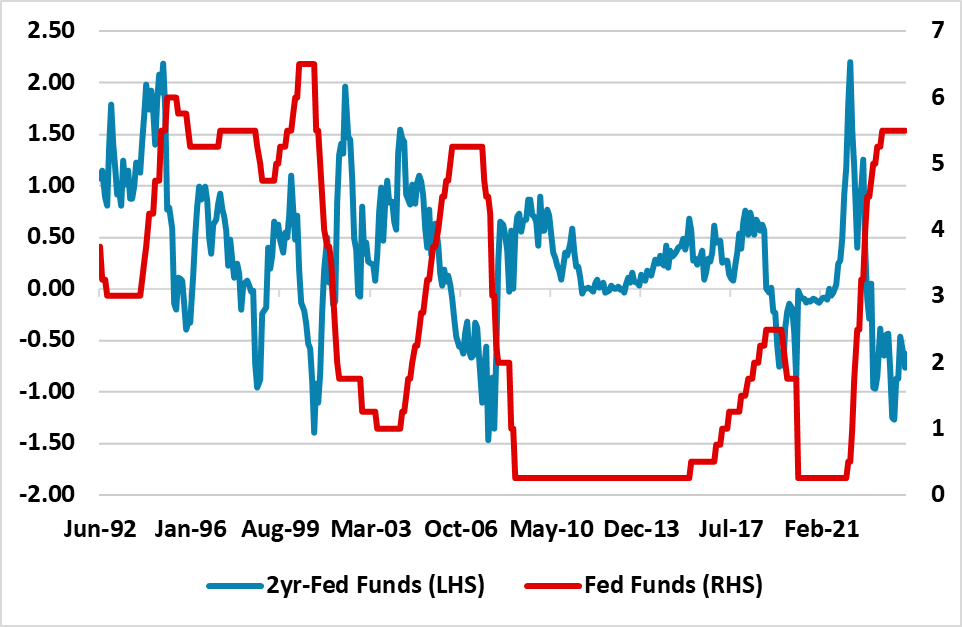
A deeper analysis of the June FOMC meeting (here) suggests the Fed are open to one or two cuts in 2024 followed by four in 2025. However, our GDP forecasts are below the Fed, while we also see inflation slightly below the median dots. Thus we feel that the Fed decision making will actually be between two and three 25bps cuts and on balance we look for three 2024 cuts starting in September. Given this view and our forecast of four cuts in 2025, we feel that 2yr yields have scope to fall in H2 2024 (Figure 1). 2yr yield discount to the Fed Funds is not as large as prior to the 2000 or 2007 easing cycles (Figure 2). Into 2025, the market will also be focused on where the terminal policy rate is, with current expectations of 3.50% or 3.75%. We feel that the market will swing closer to the low 3’s and this can mean that 2yr yields decline in H1 2025, but then a slower decline in H2 2025. Our forecast for 2yr is 3.90% end 2024 and 3.25% end 2025, with the latter more uncertain as it will depend on the economy/core inflation trajectory versus our current projections.
Figure 2: Fed Funds Rate and 2yr-Fed Funds Spread (%)
Source: DataStream/Continuum Economics
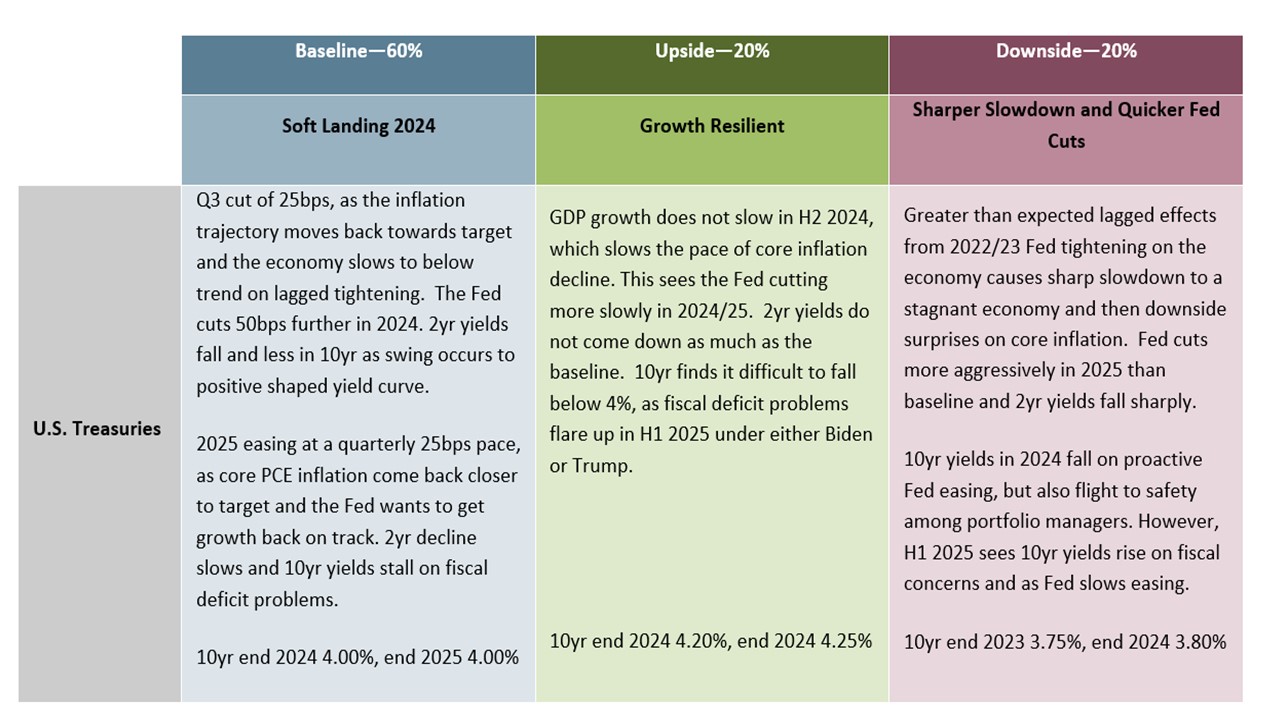
10yr U.S. Treasury yields can decline in H2 2024, as Fed easing hopes turn into reality and we see 10yr yields down to 4.00%. However, we see fiscal stress arising in H1 2025 (here). If Joe Biden is president, then it will likely see problems with the Republicans in raising the debt ceiling that could be acute if the Republicans were to keep the House. If Donald Trump is elected he would likely put priority on making the 2017 tax cuts permanent and widen the budget deficit still further. Either way the rating agencies would not be happy and the U.S. would likely be downgraded. We see this boosting 10yr yields by 30-40bps and leading to clear yield curve steepening. Consistent Fed easing in 2025, should mean that the focus switches back to the Fed in H2 2025 and we can see 10yr yields ending 2025 at 4.0%.
Figure 3: 10yr U.S. Treasury Scenario Analysis
Source: Continuum Economics
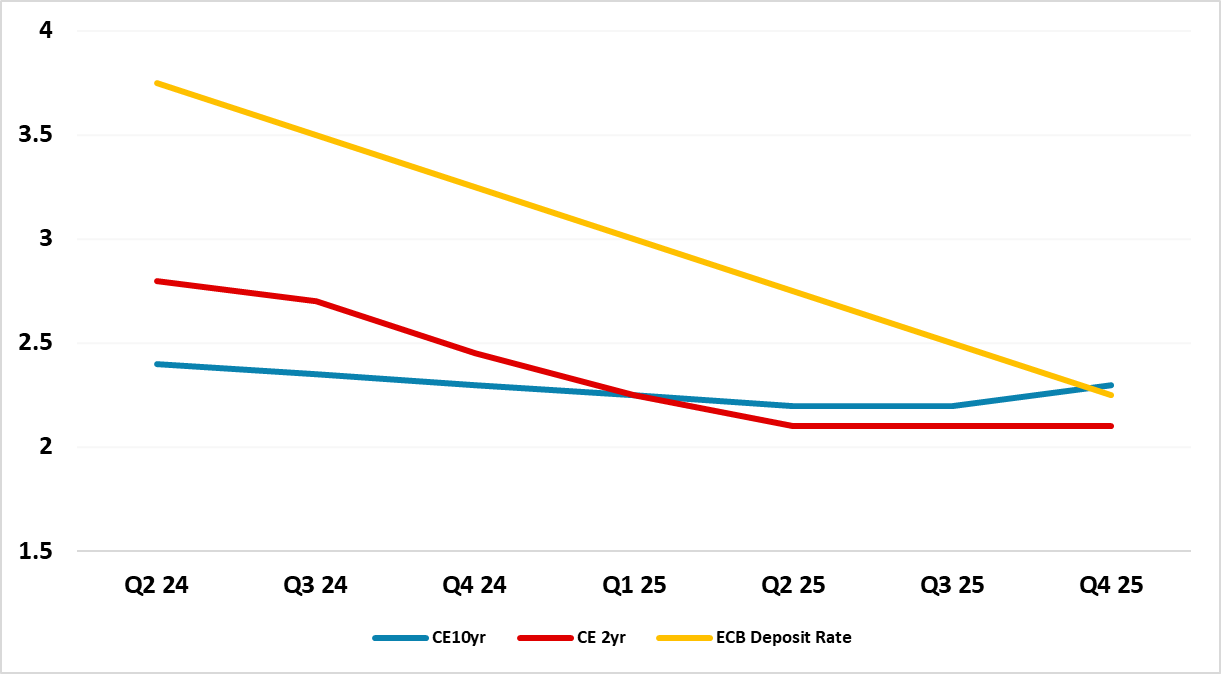
Figure 4: Continuum Economics Forecast ECB Deposit Rate, 2 and 10yr Germany (%)
Source: Continuum Economics
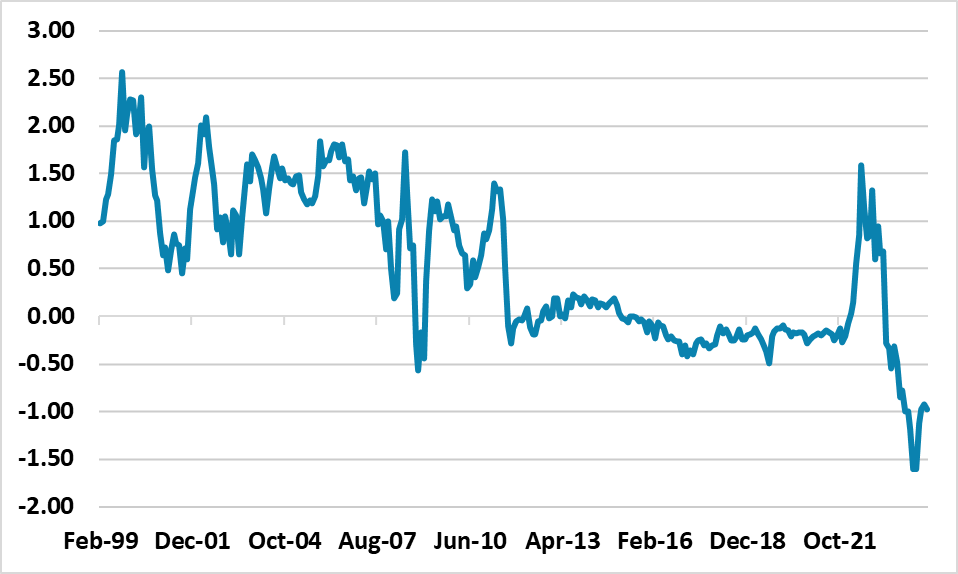
The ECB delivered the first 25bps cut in June (here). While Lagarde did not provide specific guidance, she confirmed the clear message from ECB Lane that the lagged effects of tighter policy will still feed through H2 2024 and 2025 to depress inflation dynamics; policy is now forward looking and real policy rates have risen and need to be lowered. This all means that if inflation comes in broadly as the ECB expects it is likely to undertake 25bps cuts in September and December to get real policy rates back down and reduce the risk of an inflation undershoot. This will likely see 2yr yields ratchetting down, as further policy rate cuts are delivered. However, 2yr German yields are at a big discount to the ECB deposit rate (Figure 5). This reflects the market view that the deposit rate can come down to 2.5% in the next 18-24 months. The market can shift to discounting a 2.0% depo rate, but this will take more ECB rate cuts and inflation data remaining under control or falling below 2%. Thus we see a slow decline in 2yr German yields in H2 2024 and 2025 (Figure 4).10yr German yields can benefit somewhat from the ECB rate cutting cycle, but the impact could be small. Real yields are just above zero using breakeven inflation and well below U.S. real yields. As the EZ recovery broadens into 2025, the 10-2yr yield curve will likely swing to positive as 2yr yields come down. However, we would also suspect that 10yr could rise a little in absolute terms during 2025 (Figure 4). We are not going to return to the ultra-low interest rate era and a serious undershoot of 2% inflation would be required to see the ECB deposit rate falling well below 2%. The ECB will also not quickly scale down QT at circa Eur30bln pm APP and EUR15bln pm (from 2025), as it is concerned that bond holdings are too large. A slowdown in QT could be seen H2 2025, as QT in reality is partially restrictive from a monetary policy standpoint.
Figure 5: 2yr Germany to ECB Deposit Rate (%)
Source: Continuum Economics
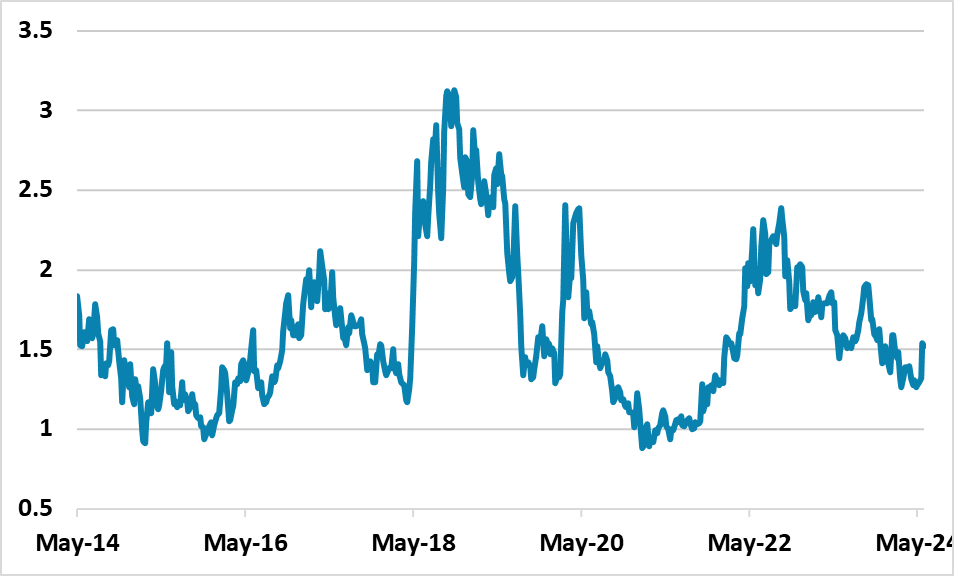
Figure 6: 10yr BTP-Bunds (%)
Source: Continuum Economics
10yr BTP-Bunds has benefitted from anticipation of the ECB easing cycle, but this has now left the spread too narrow versus the medium-term fiscal trajectory in Italy. Next Generation funding from the EU is partially helping Italy’s government funding situation, but spreads should be 160-180bps given the prospect of prolonged political uncertainty in France. National Rally or the left wing Popular Front could have a greater number of seats than centrist parties after the 2nd round of voting, but will not be able to form a majority. Cohabitation will be complex. This suggests an extra risk premia for France in the remainder of 2024. However, National Rally published pre election plans are now modest compared to 2022, while the Popular Front net stimulus is still huge and would do more damage in pure fiscal terms. Meanwhile, French political chaos is not good for the EZ. Combined with economic recovery in the EZ, we see the 10yr spread at 160bps end 2024 and 170bps end 2025.. This assumes stability for the current government and any political crisis could quickly see the spread out to over 200bps – as seen during the 2018 political tensions (Figure 6).
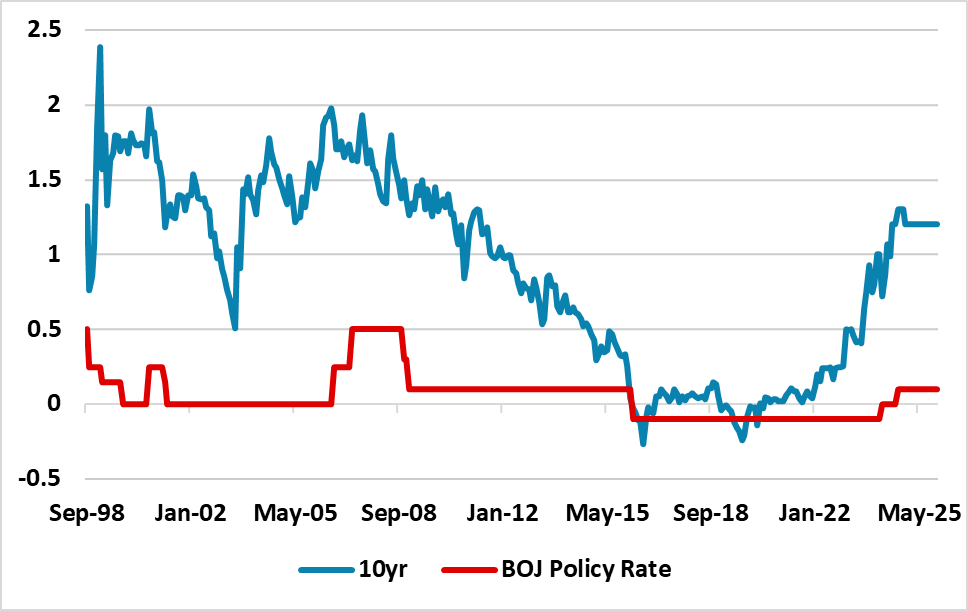
For JGB’s, the July BOJ meeting is crucial, in terms of the announcement on the scale down of bond buying over the next 1-2 years. BOJ Ueda suggests that the slowdown will be cautious to avoid a JGB upset, but does however suggest that current JGB yields are not a concern. We see scope for 10yr JGB yields to rise to 1.30% into H2 2024. However, we feel that the BOJ will be cautious. More importantly, we only see a further 10bps in the BOJ policy rate in September, as Japanese consumers are clearly rejecting price pressures and this mean downside risks relative to the BOJ economic projections. This can mean that 10yr yields do not go much higher in 2025 (Figure 7).
Figure 7: 10yr JGB and BOJ Policy Rate Including Forecasts (%)
Source: Continuum Economics
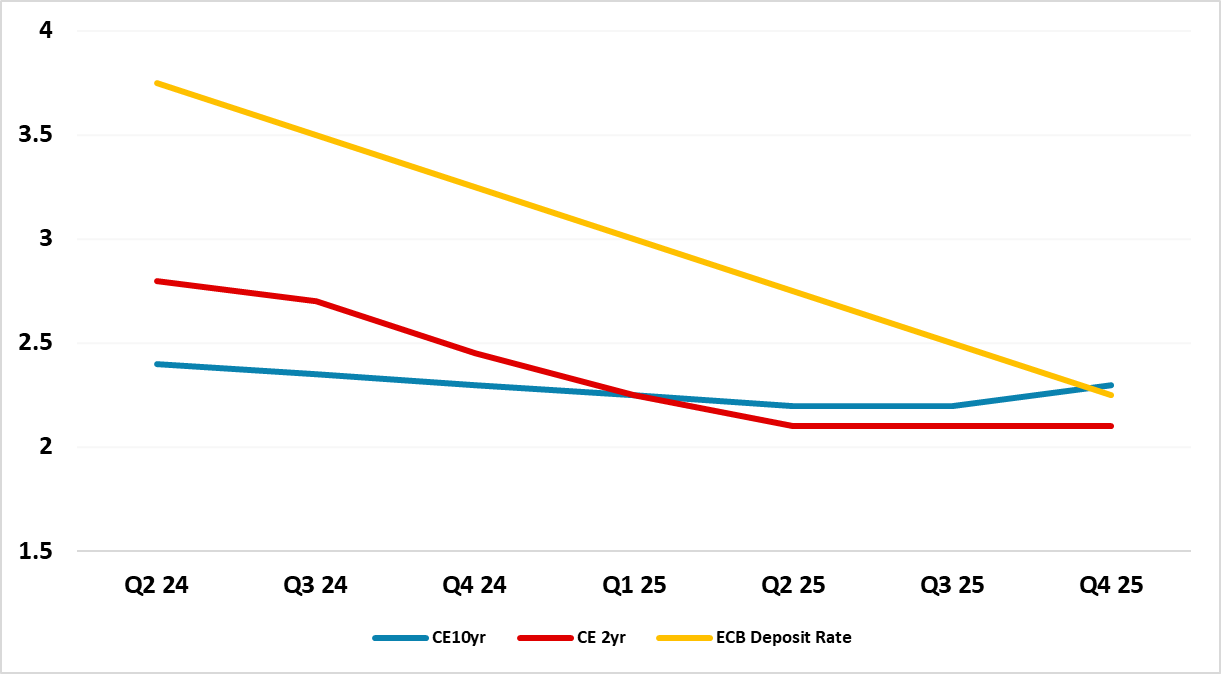
Figure 8: Continuum Economics Forecast BOE Bank Rate, 2 and 10yr UK (%)
Source: Continuum Economics
The BOE rate cutting cycle is likely to follow a quarterly pace, after the 1st cut is delivered at the August MPC meeting – with the June meeting minutes suggesting that the BOE is close to starting the easing cycle but likely delayed due to the election. Market expectations of 3.75% policy rate 2 years ahead looks too high, given that the lagged effects of monetary policy are still feeding through and we project wage and service CPI to come down. As rate cuts are delivered consistently, we feel that the market will swing to discount a policy rate at 3.0% or below into early 2026 and this can drive a structural decline in 2yr Gilt yields (Figure 8). 10yr Gilt yields partially depend on post-election fiscal policy, with a likely comfortable Labour victory likely to follow a broadly similar fiscal consolidation path to the current government – though with a different expenditure/tax mix. Lower policy rates could produce a small decline in 10yr gilt yields, but in 2025 we could see spillover from U.S. fiscal stress (due to yield competition) and more importantly a broader UK recovery reinforcing the traditional swing to a positive shaped yield curve. This could push 10yr Gilt yields back up (Figure 8). The BOE will likely end active gilt sales to avoid money market liquidity problems, but still remain with a passive rundown of the BOE gilt holdings at redemption.
