U.S. Assets and Valuation
The U.S. equity market has returned to be clearly overvalued on equity and equity-bond valuations measures and is vulnerable to a new correction in H2 on any moderate bad news (e.g. further economic slowing and corporate earnings downgrades). In contrast, U.S. Treasuries are at broadly fair on real yield valuations and ready to react to data/policy or higher debt issuance and we favor yield curve steepening. Finally, the USD is still overvalued on a real basis, but could now see some choppy consolidation before renewed losses in 2026. Real yield differentials currently provide some support to maintain some USD overvaluation.
The decline in the USD against DM currencies has been noticeable, but are U.S. assets still overvalued?
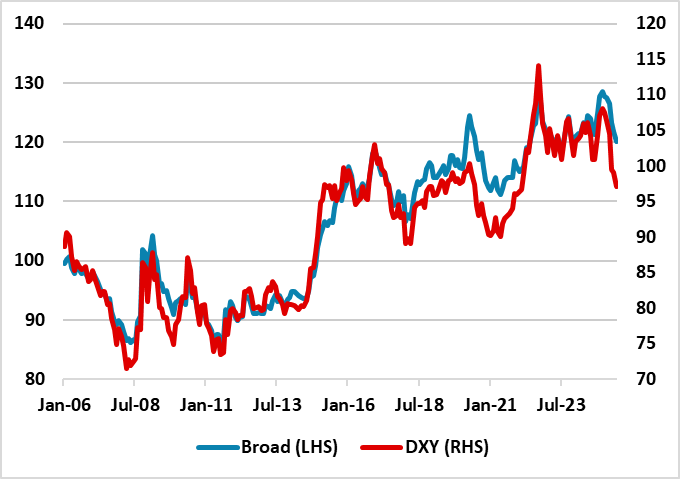
Figure 1: Nominal DXY and Broad USD Index
Source: Datastream/Continuum Economics.
FX and Rates valuations
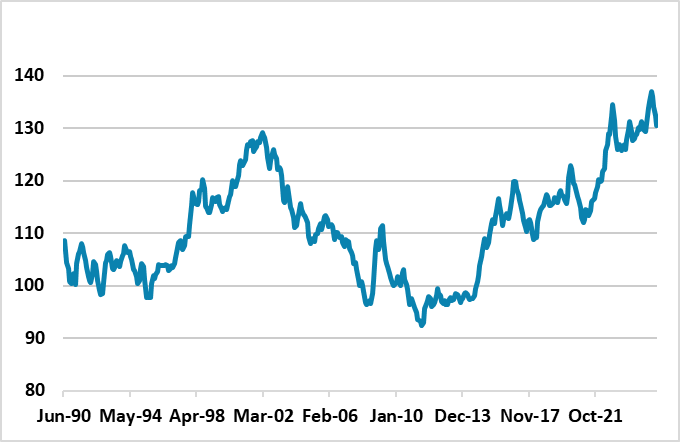
The DXY USD index has shown a sharp decline in H1 2025, due to the heavy weight of the EUR in the index. However, the broad USD index has also shown a clear decline (Figure 1), with resilience of some EM currencies despite Trump trade tariffs. One of the reasons for this decline is hedging of FX exposure, with the U.S. seen to be less exceptional under erratic and sometimes adverse policy decisions. However, net portfolio inflows into the U.S. have also slowed, as global investors seek to diversify away from overweight U.S. positions. This is not just from U.S. equities, but also U.S. Treasuries. April TICS data shows this less friendly view of foreigners, as do numerous investor surveys. While the DXY is back towards the 10yr average, the best long-term measure is the USD REER that is still around 10% overvalued (Figure 2).
Figure 2: USD Real Effective Exchange Rate (%)
Source: Datastream/Continuum Economics.
The USD losses could now see some consolidation before further losses into 2026. Real yields at the front and long-end of the curve are higher in the U.S. than EZ or Japan/China. 10yr real U.S. Treasury yields are now back to the pre GFC average and are well balanced. Though our baseline sees a 20-40bps rise in 10yr yields on budget deficit supply pressures (DM Rates Outlook here), a harder economic landing would produce a sharp decline in yields across the curve. U.S. Treasury yields across the curve are currently at broadly fair valuations and will evolve with the data/Fed policy picture.
For the USD this probably means a period of choppy consolidation, as the July 9 reciprocal tariff drama is digested (here). Though the USD is overvalued on a real basis, this is understandable with current DM real yield differentials. However, the JPY is still clearly undervalued and would rally with any noticeable U.S. equity market selloff (DM FX Outlook here). More generally, we do see renewed USD modest losses into 2026 against DM currencies. In EM, some further H2 2025 spot gains can be seen for the Brazilian Real (BRL) and Indonesian Rupiah, while BRL is attractive for carry trades given the high interest rate differentials (here).
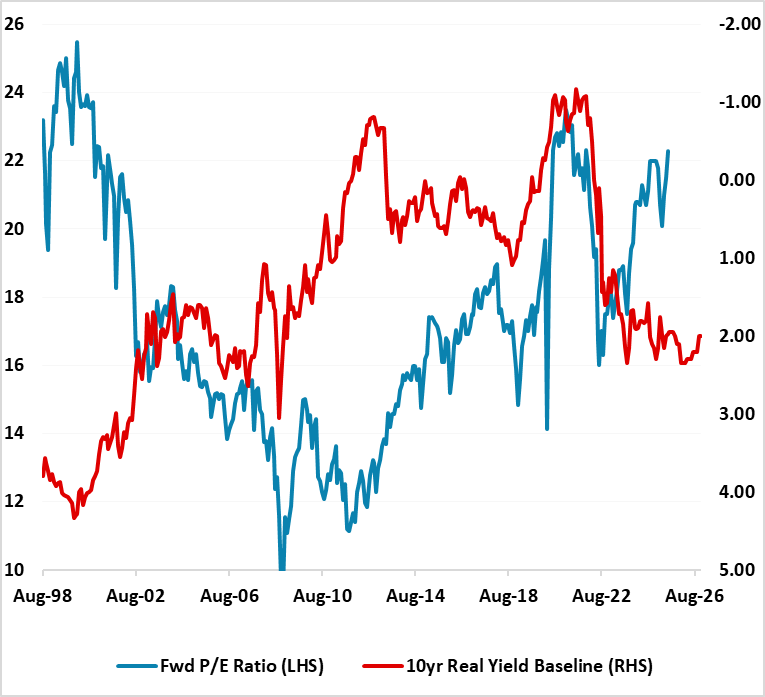
Figure 3: 12mth Fwd S&P500 P/E Ratio and 10yr Real U.S. Treasury Yield Inverted (Ratio and %)
Source: Datastream/Continuum Economics. Using 10yr Index Linked Bonds.
Equity Valuations
Our key concern would be the renewed overvaluation of the U.S. equity market on equity and equity-bond valuations (Figure 3), which reflects less concerns on tariffs after Trump’s partial U turns, AI optimism, buy the dip from retail, and heavy corporate buyback programs. This ingrained optimism means that small or modest bad news is not yet having an impact. However, the valuation is so stretched that an accumulation of moderate adverse news could cause a further correction in the U.S. equity market. The equity market is so far not reacting to the slowing of U.S. consumer spending or reports that U.S. companies are squeezing profit margins and absorbing some of the cost of higher tariffs. These are potential catalysts, along with Trump’s erratic decisions. We would still see scope for a 5-10% correction in the coming months. A harder landing in the U.S. economy would like see a fall to 5000 on the S&P500, as corporate buyback programs slow noticeably and corporate earnings forecasts are slashed – see our Equity outlook (here).
U.S. Treasury Yield Curve
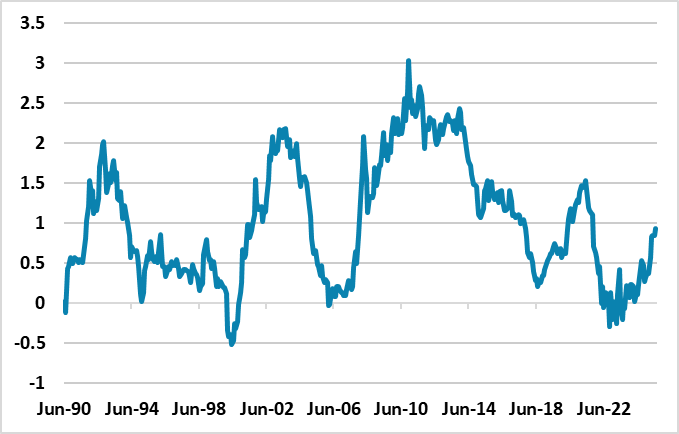
Returning to the U.S. Treasury market, we do see further yield curve steepening. Though U.S. Treasury secretary Bessant is promising to scale back long-dated issuance, an eventual 10yr budget bill will likely mean a 7% budget deficit for 2026-27 if the budget reconciliation gets closer to the House rather than the Senate version of the Big Beautiful Bill. Rating agencies will not be happy with the scale of budget deficit and government debt/GDP trajectory and a real risk exists of a further rating downgrade in the next 12 months. Additionally, foreign accounts have absorbed a lot of U.S. Treasury net issuances in recent years looking at the TICS data and this is could slow. Foreign investors feel they are overweight U.S. assets; biased to a multi-year USD decline and uncomfortable with lax U.S. fiscal policy, which at a minimum can slow inflows into long-dated U.S. Treasuries. Finally, Trump’s nominee for the next Fed president could face a credibility problem, if they are divergent from the majority of FOMC voters. While we see actual decisions still being dominated by data and economic trajectories, the perception of political interference can hurt Fed credibility and this favors a steeper yield curve. Overall, given we are looking for 100bps of rate cuts by end 2025, we see scope for a further 25-40bps of yield curve steepening in the 30-5yr spread (Figure 4).
Figure 4: U.S. Treasury 30-5yr Yield Curve (%)
Source: Datastream/Continuum Economics.