DM Rates Outlook: Rate Cuts Arriving and Positive Yield Curves
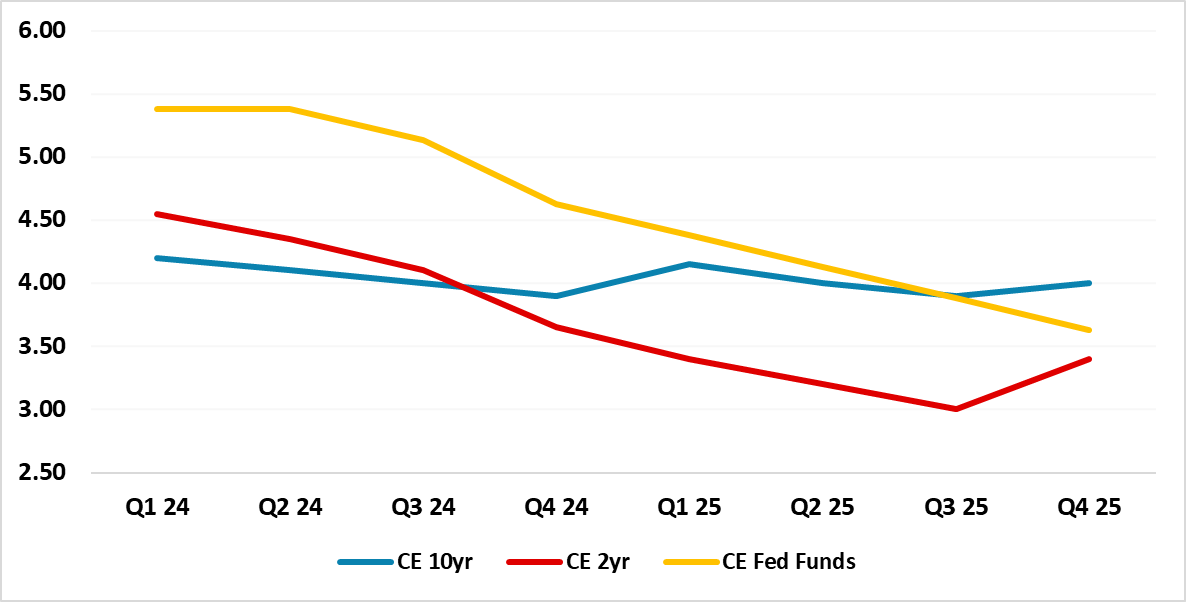
- The strategic trend in government bond markets remains towards less yield curve inversion and a positive shaped yield curve. In the U.S., as Fed easing arrives from Q3, we see this occurring through a gradual decline in 2yr yields. H1 2025 will likely see a fiscal scare, which can see 10yr Treasury yields moving higher when the Fed are still cutting. However, H2 2025 should see 10yr yields coming back down marginally, as cumulative Fed rate cuts get to 175bps by end 2025.
• ECB easing of 75bps in 2024 is already largely discounted, with 2yr Bund yields at a deeper discount to the ECB policy rate than 2009/11 and the 2yr yield decline will likely only be slow. 10yr Bund yields will be choppy and only come down marginally, as the 10-2yr yield curve is still inverted and the ECB does not slow the pace of QT in 2024! 10yr BTP-Bund spread will likely increase, as the Italian fiscal slippage is not discounted in current spreads.
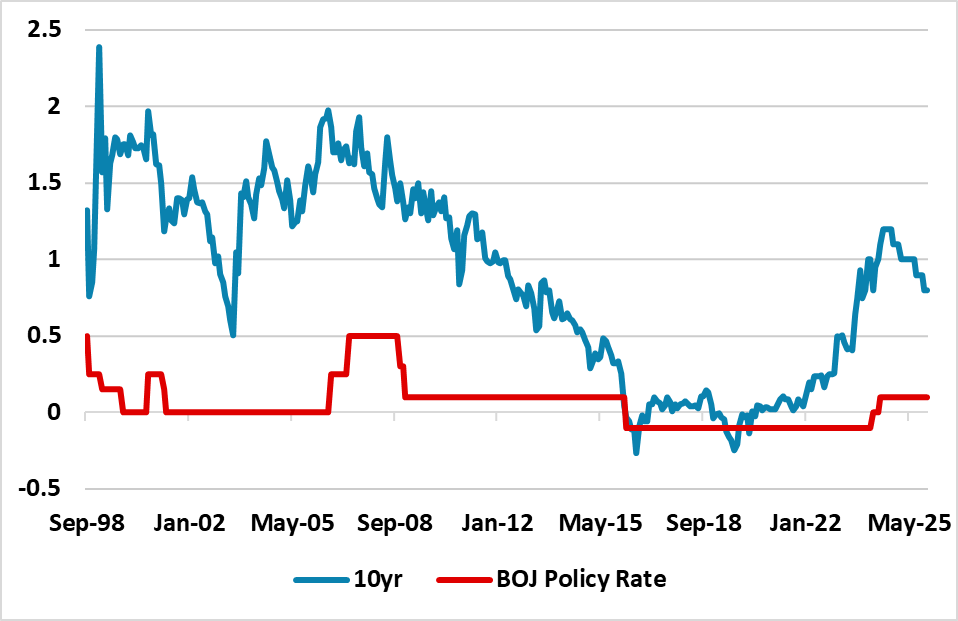
· 10yr JGB yields are set to move still higher, as the BOJ lifts the policy rate slowly by 10bps in Q2 and Q3 and pushes up yields across the curve. The BOJ is also likely to abandon yield curve control. We see 10yr yields rising to 1.2% in 2024, but then falling back below 1% in 2025 as CPI inflation turns out to be less than BOJ forecasts.
Risks to our views: Persistent inflation and little or no Fed easing causes upward pressure on yields across the curve. Alternatively, stagnation or a small recession in the U.S. would lead to larger than projected Fed easing in 2024, which would bring yields down more across the curve – though still with a swing to a positive shaped yield curve occurring into 2025. The spill over would impact 10yr government bond yields in other DM countries.
Figure 1: Continuum Economics Forecast Fed Funds, 2 and 10yr U.S. Treasury Yields (%)
Source: Continuum Economics
Risks for 10yr U.S. government bond yields are now more evenly balanced than end 2023. For 2024, the arrival of Fed easing should still dominate. The 2yr yield discount to Fed Funds has been larger in 2000 and 2007 (Figure 2) and late 2023, while the policy rate is still seen at 3.5% in early 2027. Fed cuts will likely firm up hopes that the policy rate can fall to 3% multi year, especially if our economic story of some H2 2024 economic softening comes through. We forecast that 2yr yields can consistently fall through 2024 (Figure 1) when we see 75bps of easing being delivered by the Fed. As core PCE inflation runs consistently close to 2% in 2025, we feel that the Fed will reduce the degree of restriction by a further 100bps. This can be enough to get 2yr yields eventually down to 3%. 2025 does also depend on the stance of fiscal policy after the presidential and congressional elections in November, as restrictive monetary policy is partially driven the economic effects of loose fiscal policy. This could mean that the terminal policy rate in 2026 is 3% or just above rather than 2.5%, if no fiscal tightening occurs. Indeed, by end 2025 we expect the market to get nervous that a pick-up in the economy could cause renewed labor market tightening and prompt a debate on whether the Fed pause and could tighten into late 2026/2027! In turn 2yr yields could be rising again by end 2025.
Figure 2: Fed Funds Rate and 2yr-Fed Funds Spread (%)

Source: DataStream/Continuum Economics
10yr U.S. Treasury yields have more driving forces. An economic soft landing can hold up yields, but a decline in 2yr yields, alongside a gradual easing cycle, does produce some downward pressure for yields in 2024 – especially when 10-2yr goes positive sometime in H2 2024. Additionally, the March FOMC meeting suggests that the Fed is likely to slow the pace of QT by the summer, which will on the margin improve the supply situation. However, we feel it will be difficult for 10yr yields to decline too much below 4%, unless an economic hard landing is seen or a financial scare (e.g. CRE or further regional bank crisis). Our forecast is for 10yr yields at 3.90% end 2024.
H1 2025 will actually see the U.S. government deficit and debt becoming a driving force for 10yr yields. First, congress needs to address the debt ceiling, which will be trickier if Biden wins and Republicans make life difficult. Secondly, a new president should address the deficit trajectory, but will likely not. This risks downgrades from one or two rating agencies for the U.S. government, which will likely cause a temporary yield premia for 10yr yields. We see 10yr yields at 4.10% by mid-2025, before the consistent Fed easing then help in H2 2025 and brings 10yr yields to 4.00% end 2025. Multi year 10yr yields will likely not go lower (outside of a recession scare), as the supply and fiscal trajectory keeps real yields moderately positive. The relatively short average maturity for U.S. government debt also translates current yields relatively quickly into a high net interest payment/GDP ratio – the Feb 2024 CBO estimates this will be 3.3% of GDP in 2026.
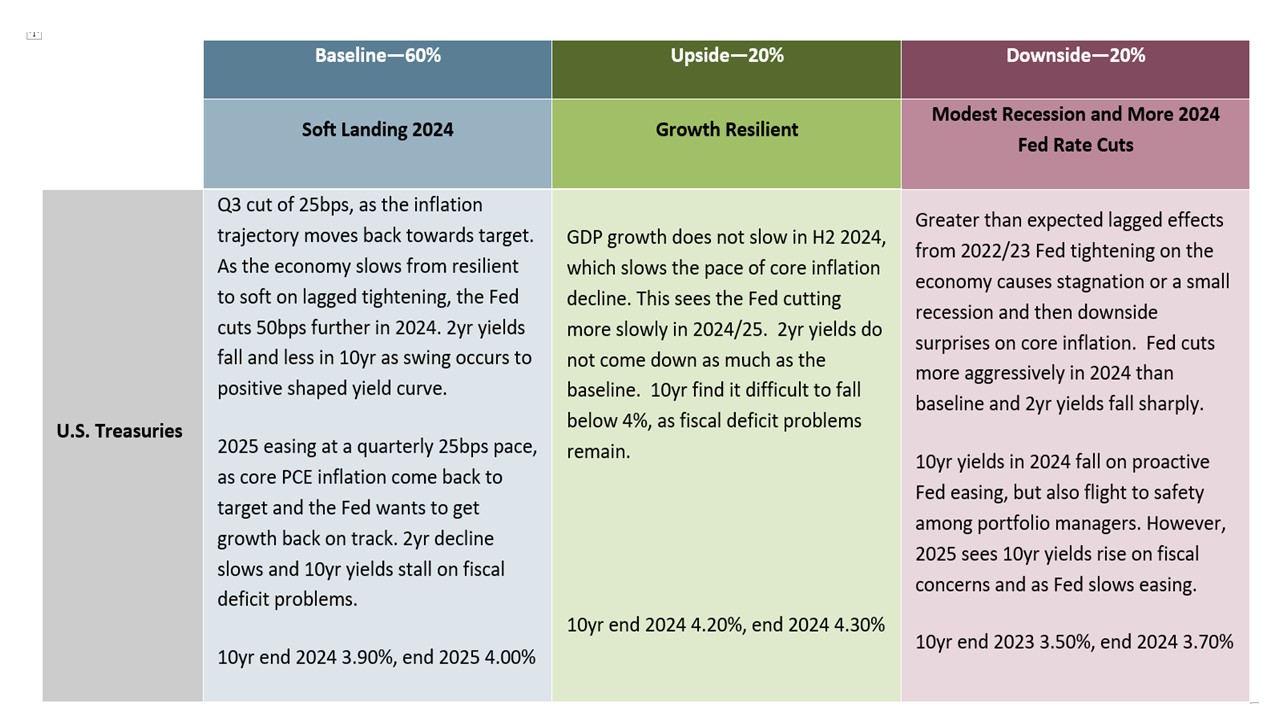
In terms of alternative scenarios for 10yr U.S. Treasury yields around the baseline (Figure 3), the upside and downside scenario are now close to equal probabilities. The U.S. consumer has been resilient in the face of Fed tightening, both as net wealth is very large (no 2008 housing/equity selloff) and as the stock of mortgages is largely locked into previous low rates. Add in a still tight labor market and U.S. consumption could remain resilient and help the economy – this is our upside scenario. The downside scenario centers on the alternative that the lagged effects of the substantive tightening of monetary policy will come through as more households and business have to refinance.
Figure 3: 10yr U.S. Treasury Scenario Analysis
Source: Continuum Economics
We see the ECB starting easing at the June meeting (here) and a total of 75bps in 2024 and a further 100bps in 2025. However, 2yr German yields are already at a larger discount to the ECB deposit rate than 2009 or 2011, with the market discounting a shift to a 2.25% depo rate by end 2025. Additionally, ECB forward guidance will likely remain weak, with the ECB highly reluctant to provide guidance on the terminal policy rate or neutral rate given divisions within the council will likely persist over the scale and timing of interest rate cuts. We do see some decline in 2yr yields occurring through 2024 as easing is delivered, but the government bond market will not go overboard. Though our GDP and inflation forecasts remain below the March ECB staff forecasts, a swing to a 2% ECB deposit rate or below near-term would only occur with data showing a deeper recession – our main alternative scenario given the warning from money and credit numbers. Our baseline sees 2.2% 2yr Bund yields end 2024 and 2.1% for end 2025 (Figure 4).
Figure 4: Continuum Economics Forecast ECB Deposit Rate, 2 and 10yr Germany (%)

Source: Continuum Economics
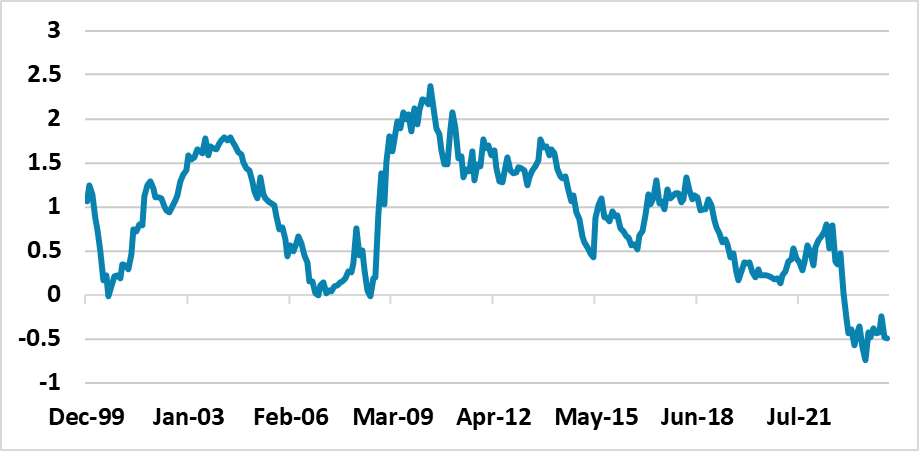
10yr Bund yields are also at a steep discount to the ECB discount rate and the 10-2yr inverted yield curve is still moderate (Figure 5). The normal process of less inversion and then a swing to a positive shaped yield curve should be evident through the course of 2024 and 2025. Additionally, though persistent ECB official rate cuts would argue for slowing the pace of APP and PEPP QT, the ECB will likely be stubborn and try to sustain the current pace of monthly balance sheet reduction through 2024 – though we suspect that it could slow the QT pace in 2025, as funding from EU next generation plan slows and increase net supply in large and peripheral EZ countries. Rate cuts and lower 2yr yields could produce a marginal decline in 10yr bond yields by end 2024 (Figure 4), before turning choppy in 2025 – yield curve steepening is the key story. 10yr real Bund yields also remain lower than the U.S. and low compared to the pre GFC period experience for real Bund yields.
Figure 5: 10-2yr Germany (%)
Source: Continuum Economics
In terms of the 10yr BTP-Bund spread it has now become too narrow due to risk on and yield pickup flows. We are highly unlikely to return to ultra-low interest rates or QE in the EZ, while the 2018-19 period showed that any significant fiscal deterioration or government crisis can blow the spread out. The 7.2% Italian fiscal deficit for 2023 is a clear overshoot and the lax fiscal policy stance leads us to look for a move to 150bps by end 2024 for the 10yr BTP-Bund spread. This can widen still further to 170bps by end 2025. Any major political crisis would make this worse.
In terms of JGB’s, the March 19 BOJ meeting sort to soothe markets after the earlier than expected 10bps BOJ policy rate hike and the scrapping of YCC. However, BOJ forward guidance has been short-term and we see scope for a further 10bps policy rate hike in June. More importantly, the pace of net JGB purchases has slowed dramatically since H1 2023 and we feel likely to slow further by June. We see this as being enough to allow 10yr yields to move above 1% (Figure 6). However, just like other DM economies, inflation in Japan will likely come down quicker than expected both due to a reversal of supply issues and also as higher inflation has already hurt consumption. We see scope for 10yr yields to fall back below 1% in 2025, as the BOJ halts the normalization process for the BOJ policy rate and the market realizes that Japan has not broken out to an era of 2% inflation.
Figure 6: 10yr JGB and BOJ Policy Rate Including Forecast (%)
Source: Continuum Economics
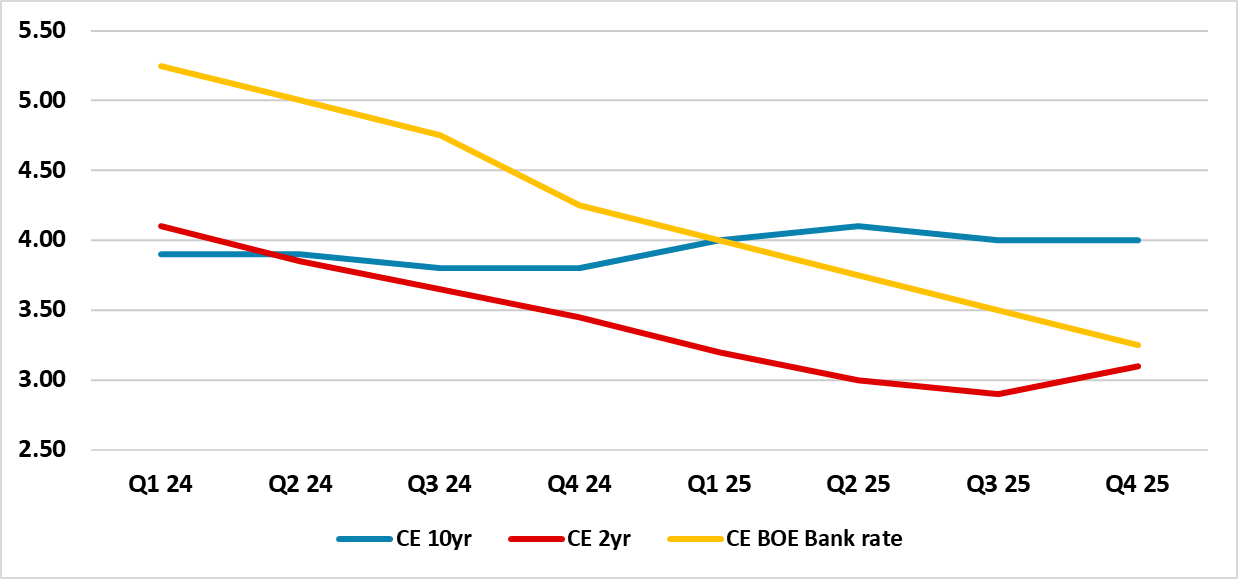
Finally, 2yr gilt yields are already priced for gradual easing in 2024 and will likely only come down slowly (Figure 7). The 2yr yield decline can be greater in late 2024 and through 2025, as the market becomes encouraged that core UK inflation is coming under control and the BOE can consistently reduce restrictive policy throughout 2025 – BOE monetary policy endorsement of market interest rate expectations will provide some implicit forward guidance. 10yr gilt yields will be more difficult, as the BOE will initially be reluctant to slow the pace of QT and the net supply hitting the market will remain heavy – we would forecast that the BOE will slow QT by early 2025. Also the UK is swinging from mild recession to mild recovery, which normally means a move to a positive shaped yield curve. We expect Labour to win the next election (most probably in October), but this will not really change the UK budget deficit trajectory. 10yr Gilt yields will likely remain choppy throughout 2024 and 25. The main story in the UK will be the swing towards a positive shaped yield curve that we see coming through more forcefully late 2024 and through 2025.
Figure 7: Continuum Economics Forecast BOE Bank Rate, 2 and 10yr UK (%)
Source: Continuum Economics
