Equities Outlook: Correction Then Up In 2026
• The U.S. equity market’s bullishness reflects good corporate earnings reality, buybacks and the AI story. However, we feel that the U.S. economy can deteriorate still further in the coming months, as the lagged effects of tariffs boost inflation and restrain spending/hurt corporate earnings growth. All of this can prompt a 5-10% correction in the market and our baseline is for 6100 for end 2025 on the S&P500. We see 6600 for the S&P500 by end 2026, as data eventually backs a soft landing picture and on cumulative Fed easing.
• Other DM equity markets will likely follow U.S. equities, as less stretched valuations are offset by domestic economic and fiscal issues. The EZ economic recovery remains slow, which can restrain earnings and the market. Japanese equities are helped by corporate reform and share buybacks, but we see scope for a further JPY rebound. UK equities are restrained by fiscal and stagflation concerns, though these will likely reduce in 2026.
• In EM equities, the China rally is not built on firm foundations and is at risk of a correction given that nominal GDP is a mere 5% and a major headwind to corporate earnings growth. Some outperformance can occur on a U.S./China trade deal, though strategically we still have concerns over China multi-year. Elsewhere, India is once again expensive and unlikely to outperform in the next 6-9 months, but H2 2026 should be better and scope exists to outperform then.
• Risks to our views: U.S. economy sees stagnation or mild recession hitting corporate earnings expectations and fwd P/E ratio falls noticeably. S&P500 falls to 5000.
Figure 1: 12mth Fwd S&P500 P/E Ratio and 10yr Real U.S. Treasury Yield Inverted (Ratio and %) 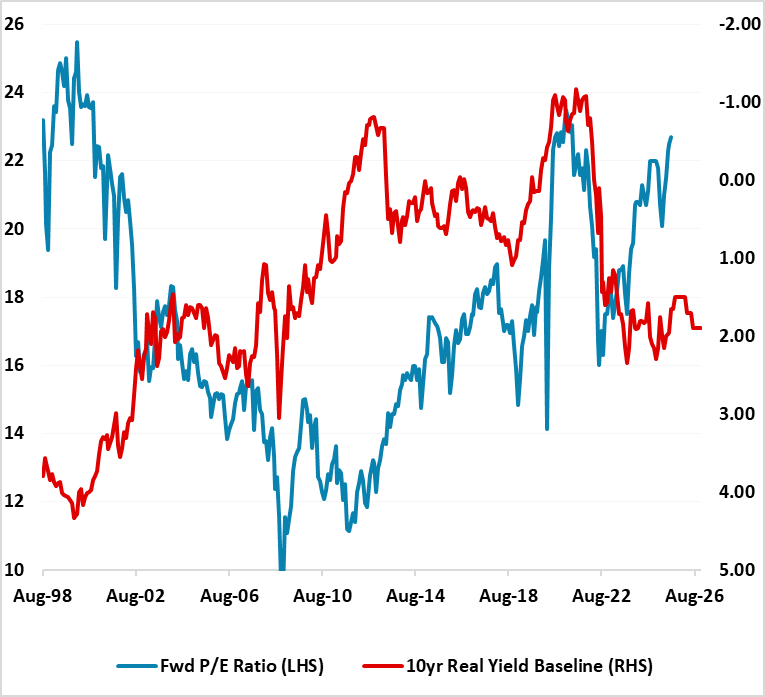 Source: Continuum Economics with forecasts to end 2026
The U.S. equity market bullishness reflects good corporate earnings reality, buybacks and the AI story. Modest bad news is not denting that story as investors are fearful of not being exposed to the market (the market has a non-linearity as major bad economic news would hit the market). Nevertheless, equity valuations have now returned to early year expensive levels. The equity risk premium is low and equity-bond comparisons are stretched (Figure 1). If the U.S. economy stabilises and the Fed cuts gradually, then intermittent consolidation followed by a further up move could be seen and the market could become more stretched.
However, we feel that the U.S. economy can deteriorate still further in the coming months, as the lagged effects of tariffs boost inflation and restrain spending. This will start to cause bumpiness in corporate earnings growth and a widening of tight corporate bond spreads. All of this can prompt a 5-10% correction in the equity market and our baseline is for 6100 for end 2025 on the S&P500. However, we are not forecasting a hard landing for the economy, which means that this is likely to be a correction rather than a more serious selloff.
Meanwhile, the AI story is helping semiconductor chip and cloud based revenue. However, AI application revenue is small, while some also fear destruction to mega tech ad based revenue as search engines reset towards AI based recommendations. This is an issue to watch for U.S. equities in each quarterly results and guidance, rather than an active risk at this juncture.
For 2026, economic data should side more with economic weakness rather than hard landing and this can produce some economic stabilisation and then a rebound in the equity market. A hard landing could trigger a bear market down to 5000 on the S&P500, but our assessment is that this is a 30% probability event. Equities can also be helped by consistent Fed easing. Though we do not see the Trump administration materially influencing the pace of easing, if Trump did control rates it could have positives (lower short rates/faster economy) and negatives (higher long-term rates, USD decline and fewer foreign investors) for U.S. equities. Meanwhile, though non U.S. investors have reduced U.S. exposure, this appears to be portfolio adjustment rather than a major shift away from the U.S.. Finally, domestic bulls will be emboldened by yet another mid cycle slowdown not turning into recession. Valuations will be a restraining influence, but we still see scope for 6600 on the S&P500 by end 2026.
Figure 2: Germany/UK 12mth Earnings Yield minus 10yr Real Government Bond Yield (using 10yr breakeven inflation)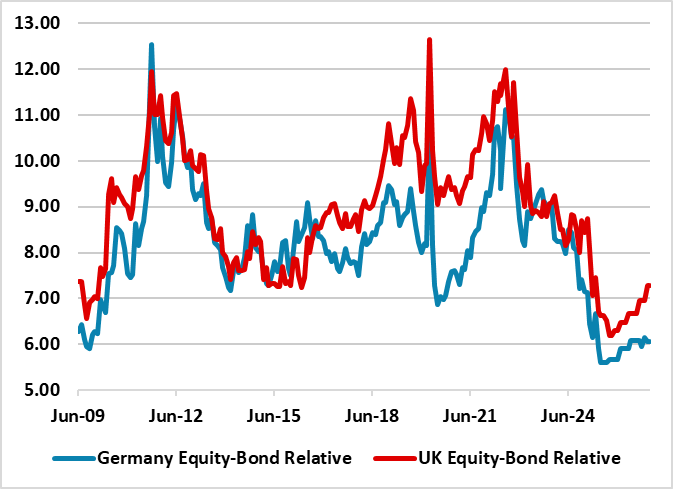 Source: Continuum Economics. Continuum Economics projections until end-2026 using 10yr breakeven inflation and Bund/Gilt yield forecasts.
EZ equities have underperformed the U.S. in the last few months, after the early year outperformance. Concern over the economic recovery, plus corporate earnings downgrades, are restraining the market. Though the ECB has cut rates by 200bps, any boost to the economy into 2026 is projected to be small. Fiscal policy is also a mixed influence, with a boost from German defense and infrastructure spending but France restrained by an adverse budget deficits and political splits – Italy and Spain are also fiscally restrained by multi-year fiscal consolidation. Equity-bond valuations for EZ equities are better than the U.S., but Germany is now tight relative to post GFC history (Figure 2) and the 12mth fwd P/E ratio is towards the top of a reasonable band. Finally, a boost from Ukraine now seems unlikely, as continued war into 2026 appears more likely than a peace deal. Portfolio diversification can mean that EZ equities match U.S. equities in the next 15 months, but outperformance is unlikely unless a proper growth pick-up is evident (e.g. rundown of excess household savings and/or business investment wave). Though we look for two further 25bps cuts from the ECB, this is not enough in itself.
Figure 3: UK 12mth Earnings Yield minus 10yr Real Government Bond Yield Inverted (%)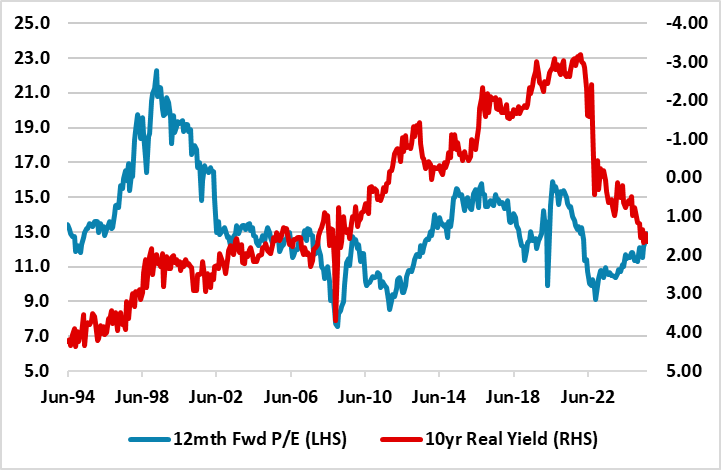 Source: Datastream/Continuum Economics. UK real yield uses RPI instead of CPI.
Japan equities have lagged other major DM equity markets in 2025, given the JPY has rebounded and tempered corporate earnings. However, share buybacks remain large, which support market technicals. The BOJ is also not a constraint on the market, with policy rate hikes at a slow pace/negative real policy rate and equity earnings yields well above bond yields. Even so, we see scope for 125 on USD/JPY by end 2026, as the overvalued USD eases further. This can restrain corporate earnings in 2026. Overall, we can see Japanese equities pushing higher in 2026, but performing in line with U.S. equities. Re UK equities, the FTSE 100 has outperformed FTSE250 on global versus UK factors, as the UK is seen to be fiscally restrained and prone to stagflation risks that both reflects and slows the BOE easing cycle. 2025 corporate earnings growth has also deteriorated through the year, while the labor market is slackening more quickly than other DM economies and risks an economic slowdown. This could mean that despite still attractive valuations, domestic equities continue to lag global equities. However, we see more slowing in service and wage inflation, which should allow more BOE easing than discounted in money markets in the next 15 months. The stagflation fears should ebb and this can see UK equities moving in line with U.S. equities. Overall, other DM equity markets will likely follow U.S. equities, as less stretched valuations are offset by domestic economic and fiscal issues.
Emerging Markets
China equities have outperformed in Q3 helped by China tech; liquidity and a sense that the economy has stabilized. However, valuations are no longer cheap in equity terms or against real government bond yields (Figure 4), though some are looking at earnings yield-nominal government bond yield to support the market. China’s 2025 corporate earnings growth estimates have also been revised down but this also need to happen to 2026 earnings to be more consistent with 5% nominal GDP growth as aggressive disinflation curbs profit margins with the excess of production over domestic demand. This means that the outperformance is not built on solid foundations and a correction could occur.
The China AI story certainly has upside though, as Deepseek breakthrough leaves China pursuing a competitive AI route compared to U.S. tech approach of closed AI and high cost. However, this is a sector story rather than a whole market story, where the macro and policy outlook are more important. A U.S./China trade deal would be a positive catalyst. We still attach a 65% probability (here) to this happening, which could see effective tariffs reduced to 15-20% and see 2.5-5% outperformance versus the U.S. in 2026. However, this is a tactical play and the alternative scenario is underperformance on no trade deal being reached. Multi-year we still do not see the overall China equity market strategically outperforming, given the overhang of the property bust and structural headwinds from population aging/slowing productivity. We do like China tech multi-year however.
Figure 4: China Earning-Bond Yield Relative Cheap Compared to Other Big EM’s (%)
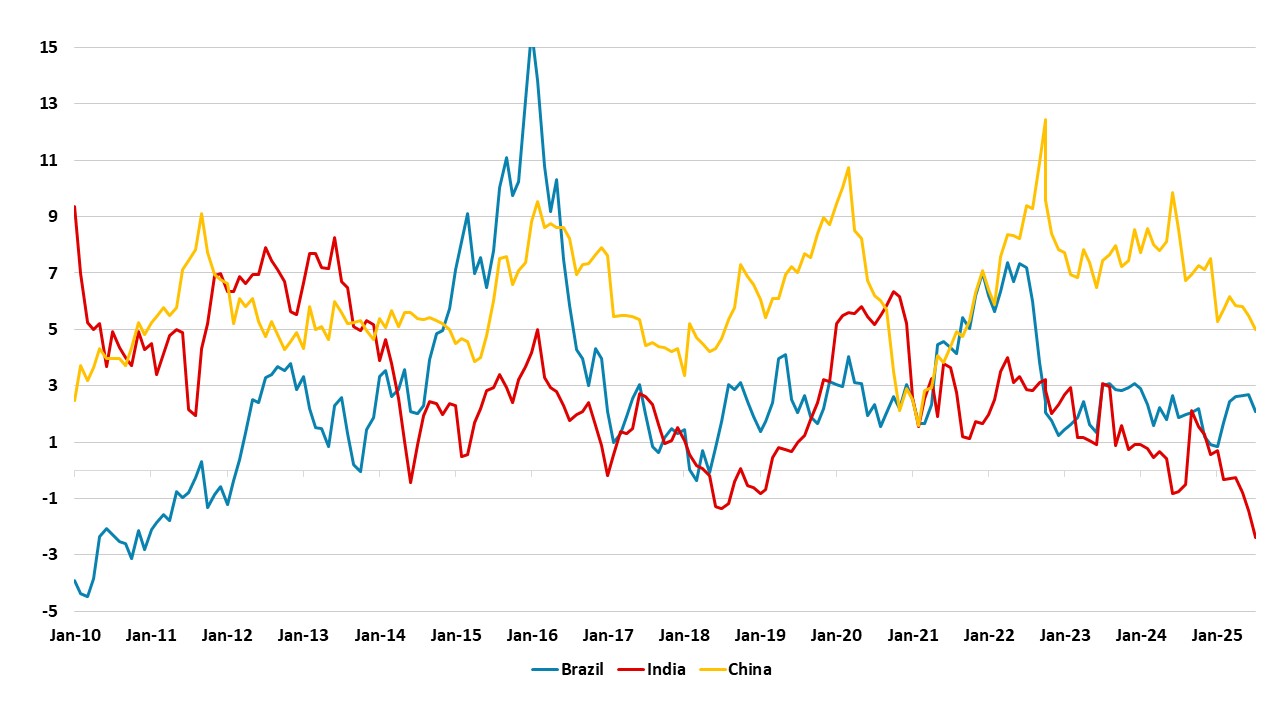 Source: Continuum Economics. CAPE Earnings Yield-10yr Real government bond yield
Indian equities have lagged with the tariff war with the U.S. and also EM equity funds being redirected back towards China. However, U.S. tariffs will only have a modest effect and will likely be counterbalanced for the economy and corporate earnings prospects by RBI and government stimulus measures (here). Indian long-term corporate earnings prospects also mean that global investors will likely tilt towards India in EM portfolios given the USD multi-year downtrend against other currencies. Even so, the 12mth fwd price earnings ratio is back at levels that mean a U.S. selloff would likely be mirrored in India tactically in the coming months, while the Equity to Bond yield spread is now modestly unfavorable (Figure 5). The next 6-9 months could see India broadly mirroring U.S. equity market performance. H2 2026 should be better as the long-term bull factors help and we see scope to outperform U.S. equities by 5% by end 2026.
Figure 5: India 12mth Fwd Earnings Yield-10yr Nominal government Bond Yield (%) 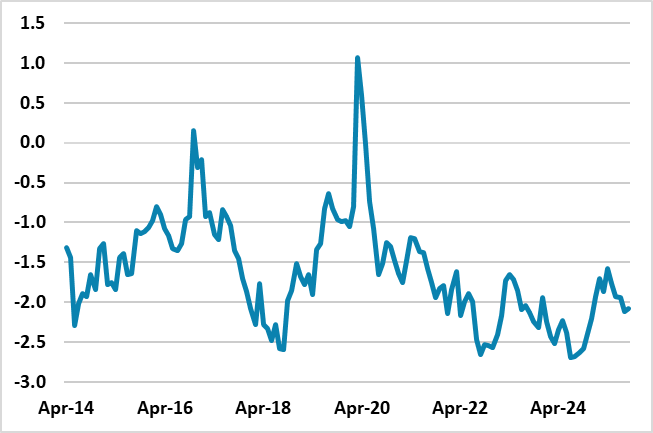 Source: Datastream/Continuum Economics.
Brazil’s equities have had a good 2025 so far, as the policy rate has likely peaked. However, earnings growth has been trimmed as ultra-tight monetary policy feeds into economic slowdown and earnings rebound looks like a 2027 rather than 2026 story. This means fwd earnings yields below fair value are the main bullish argument, but this now requires bond yields and then policy rates to come down to drive outperformance. This will take time as the BCB is on hold until spring 2026 and the bond market remains wary about fiscal policy ahead of an expected close presidential election in Oct 2026. Intermittent phase of outperformance will likely be followed by underperformance on political news. Late 2026 should then be better with consistent BCB easing helping to bring down yields and allowing a fall in fwd earnings yields that sees the price/earnings ratio moving up towards 9-10. 5% outperformance versus the U.S. can be seen in 2026.