DM Household Sluggish Borrowing
· Overall, restrained credit supply from banks; abundant employment/income or wealth for most households but restrained financial conditions for low income households could have restrained household lending growth to GDP. However, the surge in government debt and ensuing fear of future tax increase could also be a constraint in some countries. Since the drivers appear structural this picture is unlikely to change quickly, though some relaxation of tough post GFC banking regulations could help.
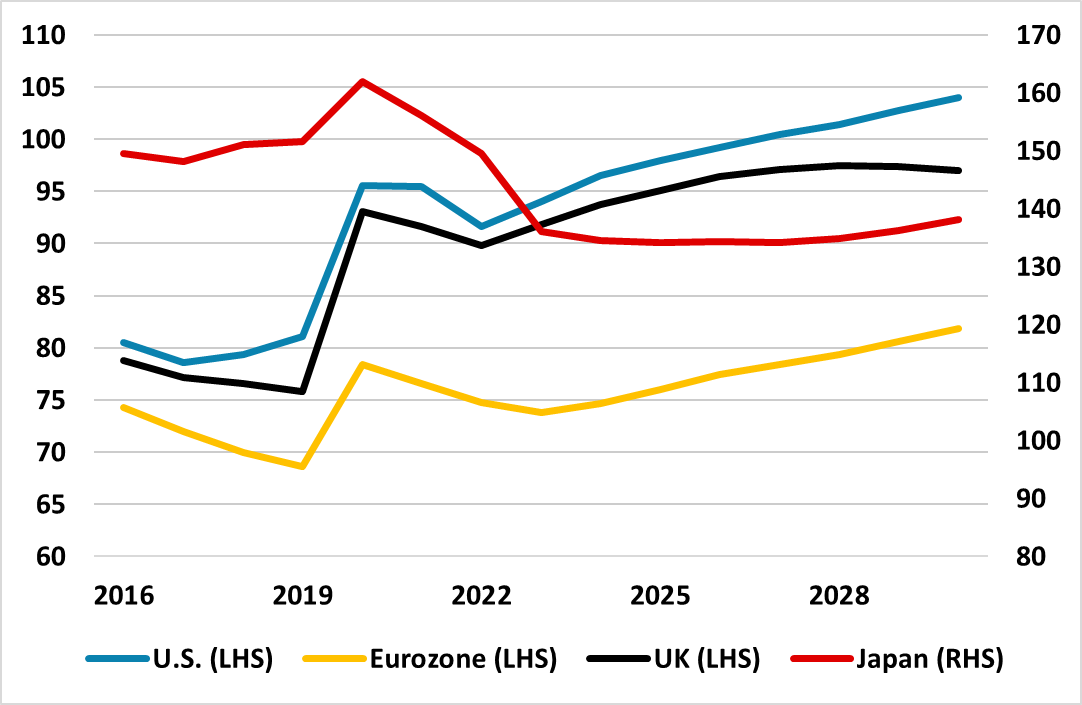
Figure 1: Household Debt/GDP (%)
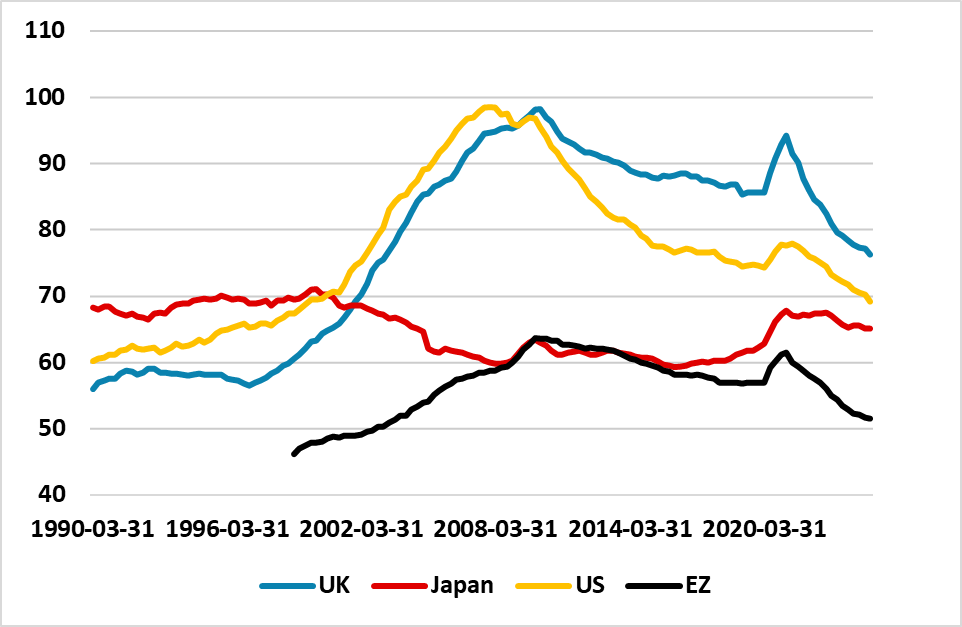
Source: BIS.
One secular trend has been the decline in DM household debt/GDP ratios in the last 10 years (Figure 1). The U.S. and UK decline between 2008-14 had been driven by households desire to deleverage and to be less exposed to debt servicing. However, the reduction in official rates and lending rates post 2008 should have helped 2014-20, before the rise in nominal and real interest rates got back towards pre 2008 interest rate levels in the last 3 years.
A number of factors are likely at play to explain why household lending is growing slower than nominal GDP.
· More cautious banks. 2007-08 prompted major bank deleveraging and a change in attitude towards lending that has been reinforced by central bank stress tests and regulation. In some countries the pendulum could have swung too far and restrained underlying credit supply relative to the pre 2008 period.
· Wealth and income inequality. U.S. household wealth has surged over the last decade with a rising equity market and home values, but this is distributed unevenly. Latest Fed reserve data (here) shows that the top 10% have 67% of net assets in Q1 2025 versus 60% in 1989, with the lowest 50% having a mere 2.5% versus 3.5% in 1989. The bottom 50% only have 23% of outstanding mortgage value versus 35% at the 2008 peak (Figure 2), as the bottom 50% has found it more difficult to access loans. Income inequality has also grown through this period. Though the EZ and UK wealth and income inequality trends are not as great as the U.S. it is still likely a force restrain borrowing by lower income/wealth households. An abundance of wealth and income for households at the high end could have seen borrowing partially replaced by cashflows from income and wealth.
Figure 2: Bottom 50% U.S. Households Share of Mortgages (%)
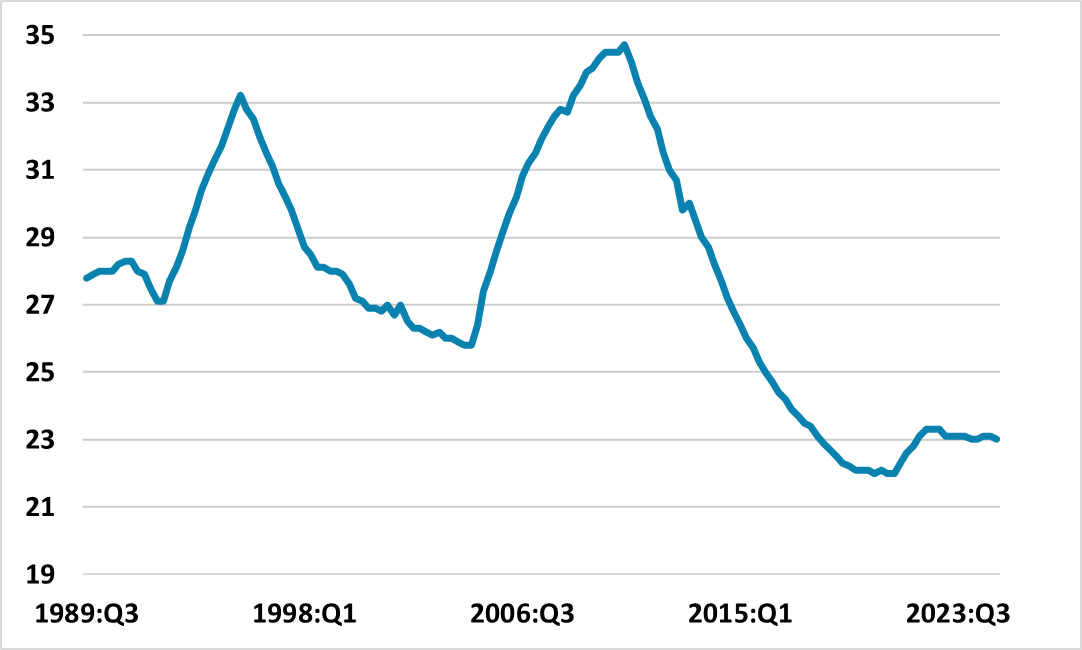
Source: U.S. Federal Reserve
· Better employment on average. EZ/Japan employment (Figure 3) rates are greater in the last 17 years than the pre GFC period, while the UK recovered sharply post GFC and is back to pre GFC levels. EZ/UK income were also supported in the COVID crisis by fiscal transfers. More consistent household cashflow could have reduced the need to borrow. The U.S. employment rate is still lower than the pre GFC period, though having recovered quickly post COVID. However, U.S. median incomes have risen post GFC (Figure 4), while the U.S. gave out large fiscal transfers during and after COVID.
Figure 3: Employment Rate (% of population)
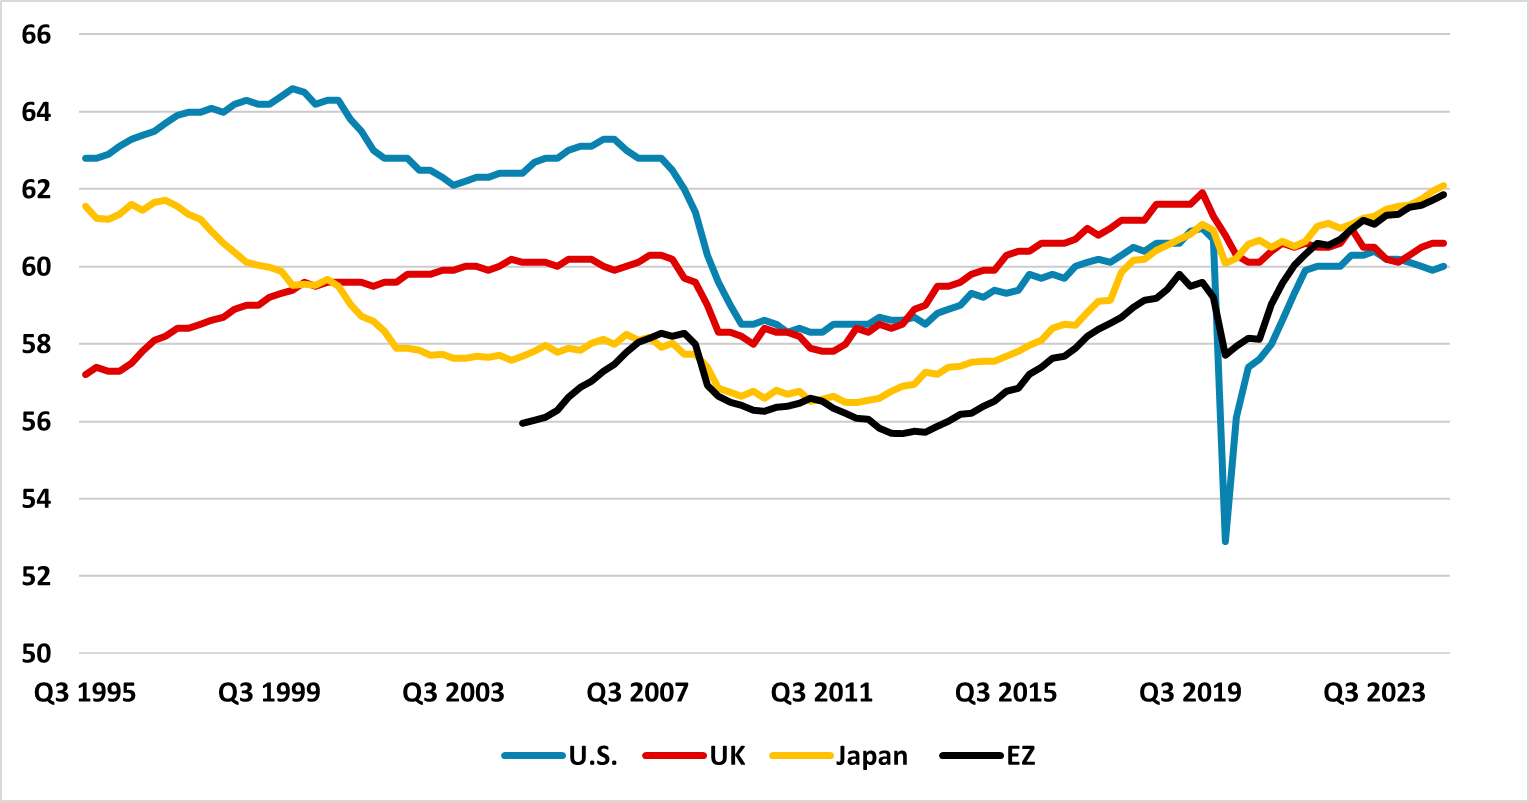
Source: Datastream/Continuum Economics
Figure 4: U.S. Real Median Household Income (USD )
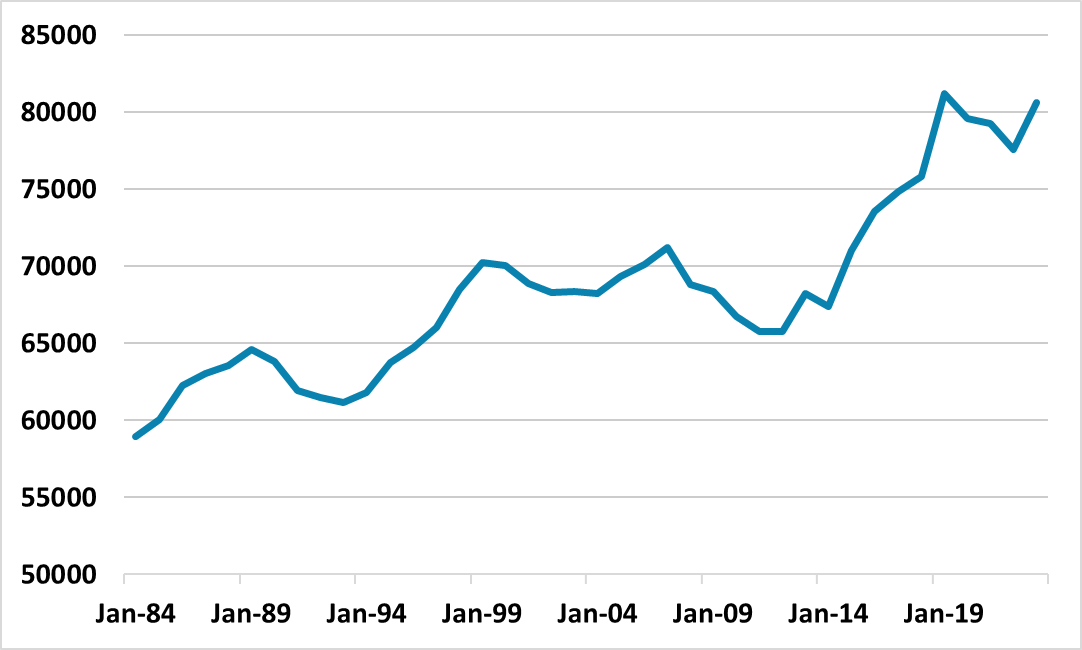
Source: Datastream/Continuum Economics
· Rising government debt and future taxes. DM countries have seen a secular increase in net government debt/GDP, due to fiscal support during the GFC and COVID and also slower secular growth that has slowed tax revenues relative to expenditure commitments. In some DM countries, the fear of higher future taxes on households to curtail government debt growth is likely to have restrained some households from extra borrowing. In fact, it could be argued that the support to households from lower debt ratios on household debt, is effectively being offset by the fiscal fall-out from higher government debt. However, the picture is not clear, with the U.S. Big Beautiful Bill rolling over the 2017 tax cuts from Trump 1.0.
Figure 5: Net Government Debt/GDP (%)
Source: IMF/Continuum Economics
Overall, restrained credit supply from banks; abundant employment/income or wealth for most households but restrained financial conditions for low income households could have restrained household lending growth to GDP. The surge in government debt and fear of future tax increase could also be a constraint in some countries. Since the drivers appear structural this picture is unlikely to change quickly, though some relaxation of tough post GFC banking regulations could help.