Equities Outlook: Choppy Then 2026 Gains
Though the U.S. equity market has rebounded, we still scope for a fresh dip H2 2025 to 5500 on the S&P500 as hard data softens further to feed into weaker corporate earnings forecasts and CPI picks up and delays Fed easing. However, the AI story is still a positive, while share buybacks/corporate bond spreads remain healthy, so we see the market recovering to 6000 by end 2025. End 2026 should see 6500 on the S&P500, as the inflation boost fades and the Fed delivers more easing. The market can also be helped by front loaded fiscal easing and less trade policy uncertainty, as trade deals are concluded.
· Elsewhere, EZ equities now have less scope to outperform the U.S. over the next 3-18 months. With valuations now above fair value, economic recovery needs to drive corporate earnings growth and this will likely only be modest. Actual defence spending will also take time to scale up across the EZ/EU. Finally, the ECB will also likely go on hold once the deposit rate is down to 1.5%. Elsewhere, concerns over limited fiscal space and stagflation will temper the UK equity’s ability to outperform, though 2026 should be better as the market is underestimating the scale and pace of BOE easing. Finally, Japanese equities consolidation will continue in H2 2025, as the Japanese Yen rebounds further and restrains corporate earnings. 2026 should be better helped by buybacks.
· China equity’s main issue is a trade deal with the U.S. We attach a 65% probability to this happening (most likely in Q4), which could see effective tariffs reduced to 15-20% and see 2.5-5% outperformance versus the U.S. by end 2025. However, this is a tactical play and multi-year we do not see the overall China equity market strategically outperforming, given the overhang of the property bust and structural headwinds from population aging/slowing productivity. We do now like China tech multi-year however, as it is the main alternative to the U.S. Elsewhere, India gains can slow in H2 2025 given valuations have pushed higher again, but 2026 should see 5% outperformance versus the U.S.
· Risks to our views: U.S. economy sees stagnation or mild recession hitting corporate earnings expectations and fwd P/E ratio falls noticeably. S&P500 falls to 4800-5000.
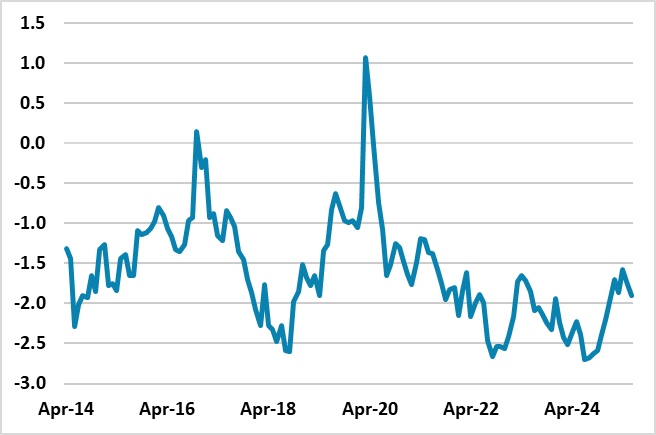
Figure 1: 12mth Fwd S&P500 P/E Ratio and 10yr Real U.S. Treasury Yield Inverted (Ratio and %)
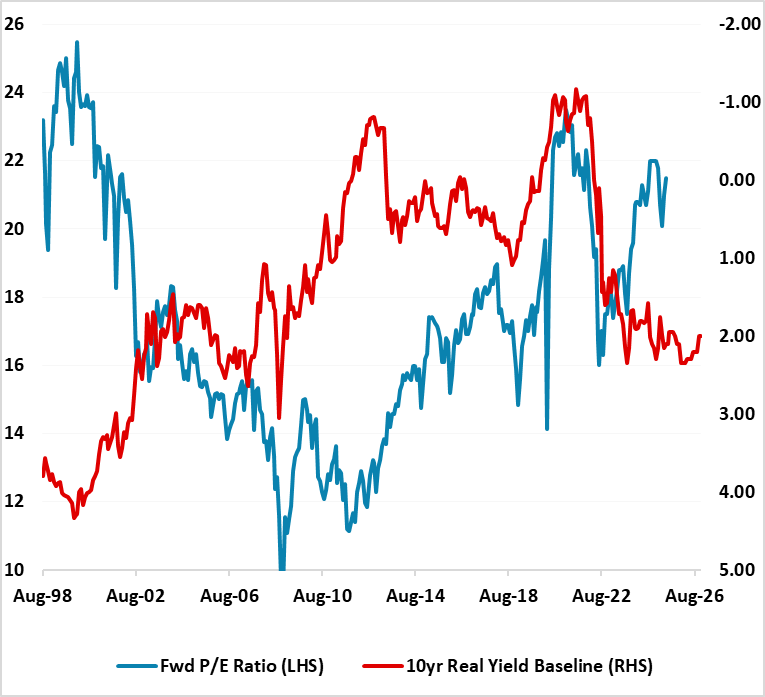
Source: Continuum Economics with forecasts to end 2026
The U.S. equity market rebound since the April reciprocal tariff crisis shows that a bullish mood remains in place. Trump’s ability to shock on trade is now restrained and the effective tariff will likely end at 13-15%. Nevertheless, the market will still have to deal with a further softening in the hard economic numbers, that cannot be dismissed as merely April-May weakness to be followed by June-July rebound. The tariff announcement and trade policy uncertainty will have a longer lasting adverse growth effect into H2, but the boost to prices will likely delay Fed easing until December and into 2026. Corporate earnings expectations still look too high for 2025 and 2026. Trade deals with China and EU will take into the autumn to conclude and Trump will likely introduce some extra tariffs.
Additionally, though domestic U.S. investors are focused on soft vs hard landing, foreign investors are also wondering whether they are too overweight U.S. equities medium-term and TICS and other flow data need to be watched carefully to see whether this translates into a slowing of net inflows. Moreover, the market remains overvalued in equity and equity-bond relatives (Figure 1) and is thus vulnerable to adverse news. This leaves us biased towards the U.S. equity market drifting lower in the next few months and we could see 5500 on the S&P500 again. However, the AI story is still a positive, while share buybacks/corporate bond spreads remain healthy and the market technicals will stop too much of a pullback unless the risk of a hard landing is seen to be higher than the 20-25% probability we attached to the alternative scenario. A fall to 18 for the fwd price/earnings ratio could be evident in this alternative scenario and a return to 4800-5000 on the S&P500.
Towards year-end, as Fed easing starts and monthly CPI numbers increase confidence that any inflation boost will ebb into 2026, we see scope for a rebound and forecast the S&P500 at 6000 by end 2025.
For 2026, the policy narrative will be more helpful for the U.S. economy. Trade deals and settled tariffs will see less focus on trade policy. Meanwhile, the broad outline of the House 10yr bill will be passed, which front loads some stimulus in 2026-28 and this will modestly help the economy. We also see three 25bps cuts from the Fed. Finally, domestic bulls will be embolden by yet another mid cycle slowdown not turning into recession. Valuations will be a restraining influence, but we still see scope for 6500 on the S&P500 by end 2026.
Figure 2: Germany/UK 12mth Earnings Yield minus 10yr Real Government Bond Yield (using 10yr breakeven inflation)
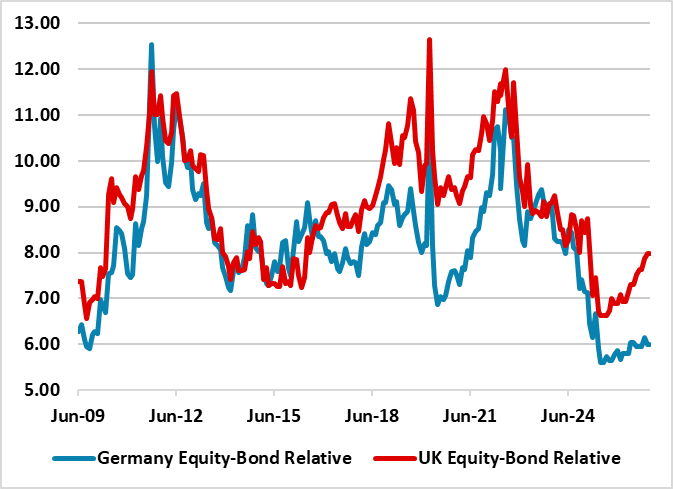
Source: Continuum Economics. Continuum Economics projections until end-2026 using 10yr breakeven inflation and Bund/Gilt yield forecasts.
EZ equities have outperformed the U.S. on portfolio diversification, ECB rate cuts and medium-term commitments on extra defense spending. However, 2025 earnings deterioration suggests that the focus will shift to the timing and pace of economic recovery. We feel that the ECB rate cuts will take time to feedthrough. Additionally, a boost from Ukraine now seems unlikely, as continued war in 2025 appears more likely than a peace deal. Combined with valuations now above fair value, it is time for consolidation and we see no further outperformance versus the U.S. in H2 2025. Equity-Real Bond yield relatives are also now unattractive (Figure 2). EZ equities could be dragged lower by the U.S. in the interim.
For 2026, the recovery should be modest, less than the estimated 1.3% trend growth rate, but this can support the market. Defense and infrastructure spending should also come through. However, with valuations less supportive, upside is likely to be similar to the U.S. and we do not see further outperformance versus the U.S. in 2026.
Figure 3: Japan 12mth Earnings Yield minus 10yr Nominal Government Bond Yield
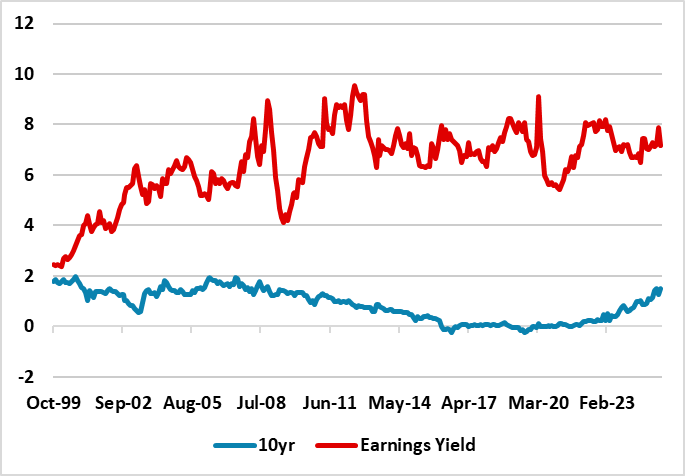
Source: Datastream/Continuum Economics.
Japan equities have been subdued by the slowing of corporate earnings growth, partially due to the Japanese Yen (JPY) rebound. However, share buybacks remains large, which support market technicals. The BOJ is also not a constraint on the market (Figure 3), with policy rate hikes at a slow pace and equity earnings yields well above bond yields. Even so, we see scope for 135 on USD/JPY by year-end and this will likely mean no outperformance for Japanese versus U.S. equities in H2 2025. Though we see further JPY gains in 2026, Japanese equities should be able to push higher helped by global equities and share buybacks. We see Japan equities matching U.S. equities in 2026.
Re UK equities, the mood is less constructive in H2 2025, as the UK is seen to be fiscally restrained and prone to stagflation risks. 2025 corporate earnings growth has also deteriorated through the year. This could mean that despite attractive valuations, we only see circa 2.5% outperformance versus the U.S. in the remainder of 2025. However, we see more slowing in service and wage inflation, which should allow more BOE easing than the 70bps discounted in money markets in the next 12 months. The stagflation fears should ebb and this can see a further 2.5% outperformance. We are less bullish than previous outlooks however, given the restraint from gilt yields – a BOE slowing of QT is likely in September but 10yr yields should remain stuck around 4.5%.
Emerging Markets
China’s 2025 corporate earnings growth estimates have now been revised down to be more consistent with 5% nominal GDP growth and this will be less of a headwind going forward. However, the market needs a catalyst to rally with fwd P/E ratio back to fair value and PBOC cautious easing meaning 1.5% plus 10yr real yields. Economic growth is unlikely to surprise on the upside, with trade and residential investment likely to be 2025 headwinds. Further fiscal stimulus will also be modest as China’s authorities do not want to be aggressive, given multi-year budget deficits and the total non-financial sector debt trajectories – the Yuan2.5trn fiscal stimulus in March was on the low side. The China AI story certainly has upside, as Deepseek breakthrough leaves China pursuing an Open AI/competitive route compared to U.S. tech approach of closed AI and high cost. However, this is a sector story rather than a whole market story, where the macro and policy outlook are more important.
A U.S./China trade deal would be a positive catalyst. We attach a 65% probability (here) to this happening (most likely in Q4, given the ongoing tough negotiations), which could see effective tariffs reduced to 15-20% and see 2.5-5% outperformance versus the U.S. by end 2025. However, this is a tactical play and the alternative scenario is underperformance on no trade deal being reached. Multi-year we do not see the overall China equity market strategically outperforming, given the overhang of the property bust and structural headwinds from population aging/slowing productivity. We do now like China tech multi-year however.
Figure 4: China Earning-Bond Yield Relative Cheap Compared to Other Big EM’s (%)
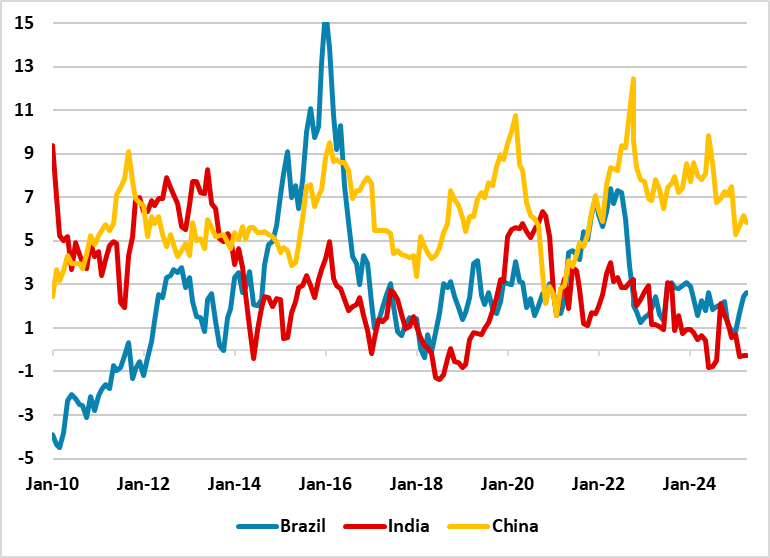
Source: Continuum Economics. CAPE Earnings Yield-10yr Real government bond yield
The Indian equities rally has resumed, as the pullback had been large enough and hopes build of a reasonable trade deal with the U.S. The RBI easing cycle is also helping with a fall in yields across the curve helping bond yield compared to earnings yield comparisons (Figure 5). Indian long-term corporate earnings prospects also means that global investors will likely tilt towards India in EM portfolios and this can help sustain the current overvaluation medium-term. However, the fwd price earnings ratio is at levels that mean a U.S. selloff would likely be mirrored in India tactically in the coming months. The high valuation also means that corporate earnings growth needs to be consistent in H2 2025 and 2026 to help push the market forward. We see scope to outperform U.S. equities by 2.5% in the remainder of 2025 and then a further 5% in 2026.
Figure 5: India 12mth Fwd Earnings Yield-10yr Nominal government Bond Yield (%)
Source: Datastream/Continuum Economics.
Brazil’s equities have had a good 2025 so far, but could now trade in line with the U.S. in H2 2025. Earnings growth has been trimmed as ultra-tight monetary policy feeds into an economic slowdown. However, fwd earnings yields are well below fair value and discount a lot of bad news. We would also see the Brazilian central bank (BCB) finishing its tightening cycle and then swinging to rate cuts in 2026 to avoid too much of an economic slowdown. 2026 should then be better with consistent BCB easing helping to bring down yields and allowing a fall in fwd earnings yields that sees the price/earnings ratio moving up towards 9-10. 5% outperformance versus the U.S. can be seen in 2026.