Japan Aging: Consumption Lessons for Eurozone/China?
· China will likely suffer slowing consumption from population aging in the coming years, as consumption per head falls for over 55’s and large scale immigration is not a likelihood. China’s household wealth is also heavily concentrated in falling illiquid residential property. China’s policymaker efforts to boost consumption also remain slow. This will be a further headwind to China growth in the 2026-30 period.
· EZ consumption for over 55’s and over 65’s is lower than the 45-55 age group, which will be a headwind given the current EZ population aging. However, EZ household wealth can provide a buffer for consumption, while controlled legal immigration/EZ older workers desire for part time work are also viable solutions to help the EZ economy transition.
Population aging is a fact in China and Eurozone in the 2020’s and beyond the 2030’s, which has been overlooked due to the cyclical economic volatility from COVID/Ukraine War and the DM rate hike cycle. Does Japan’s experience provide any lessons for consumption of older people and how this could impact consumption trends in China and the EZ? We will look at the wider China and EZ consumption and growth Outlook in other articles.
Figure 1: Japan Real Consumer Expenditure Growth (Yr/Yr %)
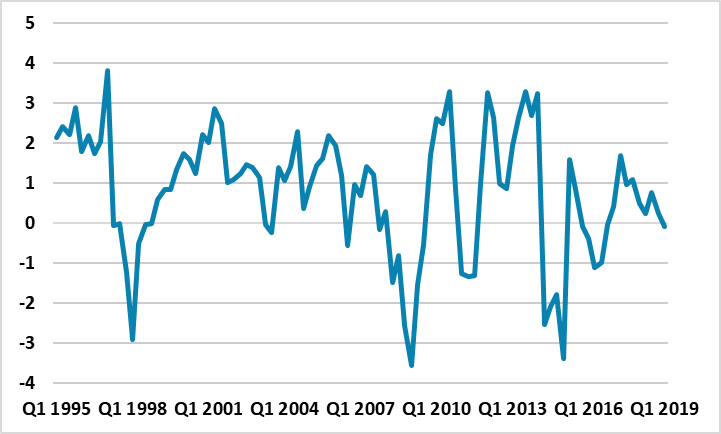
Source: Datastream/Continuum Economics.
Japan consumption trend has been impacted by an aging profile of the population, but does it have lessons for Europe and China that are already facing population aging throughout the 2020’s and 2030’s.
· Lower and more volatile consumption. Trend growth in Japan’s consumer expenditure is down noticeably since the 1980’s. First, population and labor force growth have peaked, which has impacted overall consumption levels and growth rates. Secondly, Japanese over 65’s per capita spend more on essentials (housing/utilities and food) than under 65’s, which means discretionary spending can be volatile. While Japanese over 65’s have also reduced the flow into household savings per annum (that drags down the overall savings ratio Figure 2), they have also spent from their stock of assets. This provides a cushion to consumption, but in recession or shocks (e.g. consumption tax hikes), it can increase consumption volatility.
Figure 2: Japan Household Savings Ratio (%)
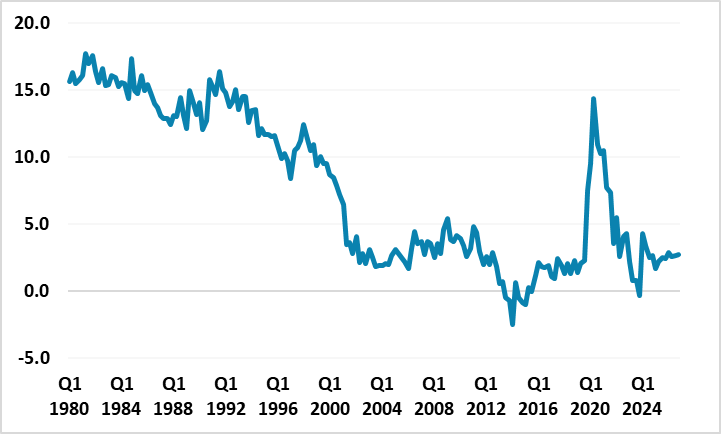
Source: Datastream/Continuum Economics
Figure 3: Japan Employment Levels (Mlns)
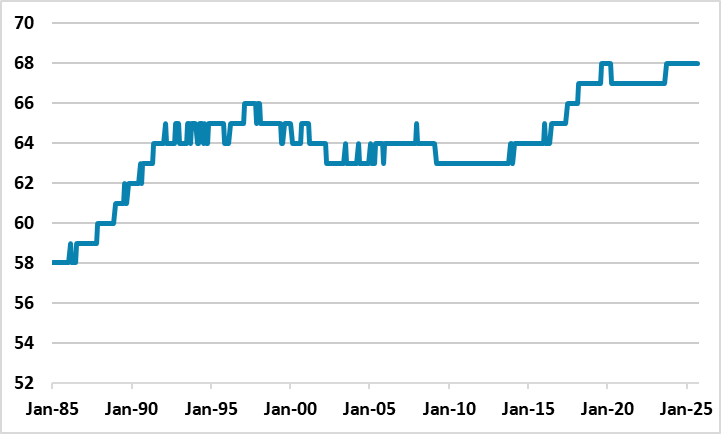
Source: Datastream/Continuum Economics
· Higher female and over 65’s worker participation. Japanese consumption has also been cushioned by the increase in the number of people actually working (Figure 3), despite a shrinking population and labor force. This has occurred as the percentage of female and over 65 workers have increased, due to a big government push and part time/flexible employment practices. In turn, this has helped to broaden the base of income generation across the population. Japan’s per capita consumption for over 65’s is not much different from under 65’s, despite economist’s life cycle theory of consumption that peak consumption per capita should be late 40’s/early 50’s. Japan’s over 65 wealth and residual labor income have helped.
China and Europe: Different from Japan?
China is different as it is a middle income country rather than a high income country like Japan. Consumer services are not as mature as Japan/Europe or U.S. but has scope for secular growth over the next 15 years, including older people. Furthermore, the rural to urban migration has not been complete and this helps some workers achieve higher sustainable incomes and consumption levels – including the over 55’s. Additionally, household savings are very high in China, which could come down if the government undertakes a major expansion of health/unemployment and pension safety nets – though China’s authorities’ 2025 improvement has been modest rather than radical.
Even so, China’s female participation rate is already high, while the government is finding it politically challenging to slowly raise the retirement age. Japan’s high over 65 participation rate is unlikely to be seen in China. China is also unlikely to embrace large scale immigration, which would help make up for population and labor force shrinkage. China’s consumption trend is already slowing due to adverse housing wealth effects and slow employment and income growth, but could also be structurally hurt by population aging 2026-2030. Finally, China’s main household form of wealth is illiquid property, rather than Japan’s older generation wider distribution of deposits/funds and housing wealth. This is one of the reasons that we feel trend growth is down to 4.0% and will fall to 3.0% by 2030, with only moderate fiscal policy expansion likely to help China’s authorities to beat these trend growth forecasts.
In terms of the EZ, the starting point of overall household wealth is good, with a moderate proportion of deposits and financial assets and high wealth to GDP ratio – though wealth inequality leaves some older households struggling. The new inflow to savings (household savings ratio Figure 4) is reasonable but not excessively high and could over the next 15 years trend lower like Japan. However, what is uncertain in France/Italy and Spain is whether the multi-year need for fiscal consolidation will see any action to increase retirement age further or reduce benefits/increase taxes on older age groups. Politics is a restraint in all three countries on change from the status quo. Japan also saw a swing towards risk aversion among the old, with a shift to deposits. Most EZ countries ex Netherlands needs more private pension and investment provision, given the dependence on state and company pension income – though progress on the EZ capital union remains slow. The ECB have also looked at the aging issue in a wider context and note that consumption per capita peaks in the 45-54 age group in the EZ and falls sharply after 65 as income falls (here and Figure 5). As the population profile ages in Europe this decade, it can be a long-term headwind to absolute levels of consumption and growth rates and even pose risks to financial stability.
Figure 4: EZ and UK Household Savings Ratio (%)
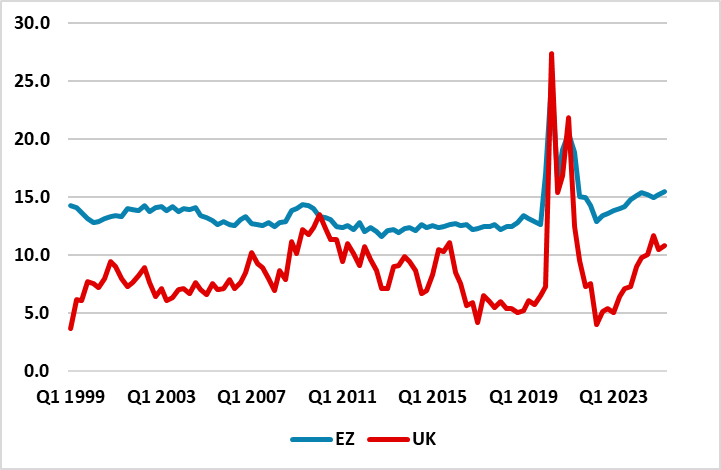
Source: Datastream/Continuum Economics
Figure 5: Euro area households’ median gross annual income and net wealth, by age group (EUR’s 000 2021)
Source: ECB
One solution for the EZ is more female participation/older age working or immigration, which could boost income and sustain consumption. Female participation rates could rise a lot in Italy (here), but in other large EZ countries are high or reasonable. OECD data shows that 60-64 employment rates have increased in major EZ countries since 2010, as older workers decide to avoid hard early retirement and instead extend working lives for a sense of purpose or income and even better health. However, EZ governments are not making a big push to get companies to be more flexible. This has certainly been noticed by Continuum Economics in our reviews of labor market data. However, 2024 employment in the 60-64 age group for France (42%), Italy (49%), Spain (51%) remains below Germany (67%) and Japan (74%), as people rapidly move into retirement after 60. Additionally, over 65’s participation rates are much lower than Japan (Figure 6) and culture and politics suggests that a radical jump is unlikely, though we can see a continued uptrend.
Meanwhile, European voters are clearly against illegal immigration but have welcomed 4.4mln people from Ukraine (here). European politicians are trying to steer towards legal temporary immigration, as a solution to political turbulence and Europe’s labor force needs. It remains to be seen whether controlled immigration can fill the gap from prospective falls in EZ population and labor force.
Figure 6: Over 65’s Employment Rates (%)
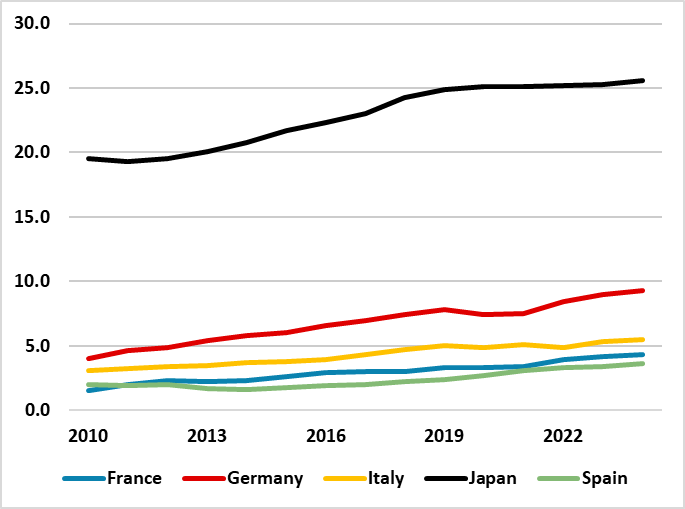
Source: OCED/Continuum Economics