Equities Outlook: Cyclical Recovery Versus Structural Headwinds
· In the U.S., a tug of war between momentum and U.S. exceptionalism on the one side versus valuations and any deviations from the U.S. goldilocks scenario now means volatility and a risk of a correction. We feel that the U.S. equity market recovery can push onto 5250 for the S&P500 by end 2024, but is surrounded by a 25% probability downside alternative of 4800 and 15% probability upside scenario of 5500. 2025 fiscal risks and overvaluation can mean that the S&P500 is 5150 by end 2025, as modest earnings growth all goes into equity earnings multiple derating.
· EZ equities will be helped by consistent ECB easing and hopes of an economic recovery. However, economic recovery will be sluggish, which will restrain corporate earnings and upside potential. We see only small to modest outperformance versus the U.S. in 2024 and 2025 respectively. UK equities can outperform the U.S. by a cumulative 5% in 2024 and 10% in 2025 on larger than expected BOE rate cuts and Labour winning the general election, and the market hoping it will improve the trade deal with the EU in 2025/26.
· Japanese equities benefit from a weak JPY will likely go into reverse, as the JPY continues to rebound from extremely depressed levels. The market is also too upbeat on nominal GDP. Corporate earnings forecasts are too high for 2024 and 2025. Potential ETF sales from the BOJ in 2025 will also become a headwind for the market. We see no further gains for the Nikkei 225 in 2024 and look for a small 5% rise in 2025.
· China’s equity market undervaluation has reached the point that a short covering bounce has arrived, as the economic news is not currently deteriorating. Indeed, a tactical recovery will likely extend and China could outperform the U.S. by a further 5-10% in the next 3-9 months. However, we would not change the strategic underweight view on China in EM portfolios, as the market is too optimistic on corporate earnings growth multi year and the structural headwinds point to just above 5% nominal GDP growth.
· We prefer India due to high nominal GDP growth and corporate earnings growth prospects. With moderate RBI easing likely to be delivered from H2 2024, most of the consensus 14% earnings expectations will likely go into pushing the market up a further 10% by end 2024. A further 10% rise is projected in 2025.
Risks to our views: Larger than expected lagged effects from DM monetary tightening could cause downside surprises on U.S./EZ growth and hurt the global economy and earnings outlook. Equities would see a more volatile 2024, with downside and then a rebound (on more aggressive policy easing).
Figure 1: 12mth Fwd S&P500 P/E Ratio and 10yr U.S. Treasury Yield Inverted (Ratio and %)

Source: Continuum Economics
U.S. exceptionalism exists in the tech sector, where earnings momentum has been good and helped to drive the story. The question is how long will this last? Additionally, the broader U.S. equity rally has been helped by a goldilocks scenario of inflation coming back towards target, with recession avoided and the economic cycle extended. With rate cuts normally meaning good performance, the equity bulls are back in the driving seat in the U.S.
Even so, tech valuations have moved from being average to moderately expensive, though still off the 2000 peaks. The AI story means that structural optimism will likely be sustained in the tech sector in 2024, while neither Joe Biden nor Donald Trump policies provide any risk of material regulatory tightening being implemented in the coming years – the Apple lawsuit has to get through the courts, which is usually very difficult. However, earnings momentum needs to be sustained in the coming quarters to maintain the tech sector optimism, otherwise a correction could be seen.
The non tech sector is also vulnerable to a correction in 2024 and 2025. The goldilocks story is vulnerable in two directions. Firstly, if U.S. economic resilience fades then corporate earnings expectations can be dented and cause concerns that lower corporate earnings forecasts and earnings multiples are required in a weak growth phase. In 2024, the main threat is that the lagged effects of monetary tightening turn out to be greater than expected. In 2025, fiscal policy will likely come back into focus, as congress tries to agree an increase in the debt ceiling and the threat of a credit agency rating downgrade for the U.S. returns. Additionally, with the outcome of the presidential election 50/50, the equity market will likely not discount Trump policies in advance. Financial markets will also want to see whether the Democrats lose the Senate, but potentially win the House. In contrast to 2016, and the prospect of new tax cuts, we would see the scenario of a re-elected Trump as being overall bad news for the equity market: rule of law risks (-ve), Stopping immigration/less labor force growth (-ve); China and global trade war (-ve); end Ukraine war (uncertain impact); extending tax cuts (+ve but less than 2016).
The second risk to the goldilocks story comes if the U.S. economy’s resilience is sustained and means that wage inflation and core inflation do not slow down enough, which causes the Fed to stop easing well above a 3% Fed Funds rate, causing a reality check on valuations. This second risk is more difficult for the equity market, as the current 12mth forward P/E ratio is out of line with 10yr real bond yields (Figure 1) and our baseline forecast for real yields. If 10yr real bond yields got stuck around +2%, then a significant earnings multiple derating could occur. In terms of valuations, we put more weight on the 12mth forward P/E to 10yr real U.S. Treasury yield rather than alternative measures like the yield on U.S. high yield versus S&P500 Earnings yields in Figure 2 (the latter measure is benefitting from current low levels of high yield spreads to Treasuries, which would blow out with any noticeable economic weakness).
Figure 2: U.S. High Yield minus S&P500 Earnings Yield (%)

Source: Bloomberg/Continuum Economics
Figure 3: S&P500 and Magnificent 7 (31/12/2022 = 100)

Source: Bloomberg/Continuum Economics
Overall, this means a tug of war between momentum and U.S. exceptionalism on one side versus valuations and any deviations from the U.S. goldilocks scenario. We feel that the U.S. equity market recovery can push onto 5250 for the S&P500 by end 2024, but is surrounded by a 25% probability downside alternative of 4800 and 15% probability upside scenario of 5500. These economic and policy uncertainties will be different in 2025, but will cause greater risks to a smooth rise in the market. Optimism about Fed easing will also start to be replaced by questions over where the easing cycle will end and whether U.S. labour market tightness might produce Fed rate hike risks in 2026/27. The scale of AI optimism could also start to run out of steam, as the benefits to revenue and earnings will still not have come though and tech earnings turn more normal. Our baseline is actually for 5150 for end 2025 for the S&P500, which is surrounded by a downside scenario with a 25% probability of 4700 and 15% upside scenario of 5750.
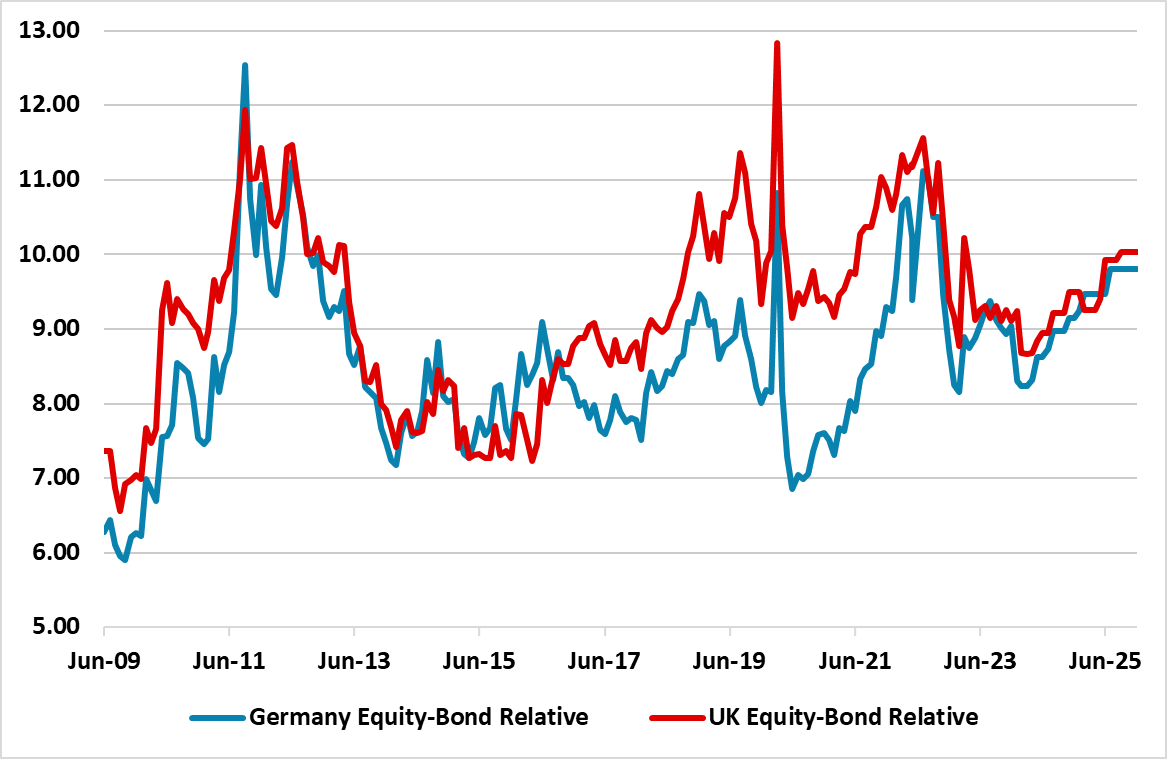
Figure 4: Germany/UK 12mth Earnings Yield minus 10yr Real Government Bond Yield (using 10yr breakeven inflation)

Source: Continuum Economics. Continuum Economics projections until end-2025 using 10yr breakeven inflation and Bund/Gilt yield forecasts. Baseline see 2.20% 10yr yields end 2024, end 2025 2.20% and 10yr gilts 3.80% and 4.00%.
In Europe, the 12mth fwd price earnings ratio for EZ equities is below post GFC average levels, while EZ equities are cheap versus real bond yields using breakeven inflation expectations (Figure 4). We also feel that the ECB will ease consistently through the course of 2024 and 2025 with a cumulative 175bps of cuts. With the EZ economy slowly recovering, this should mean further upside potential as the rally in the market broadens out. However, 2024 corporate earnings prospects are still likely to be low, while our 2025 growth and corporate earnings projections are below market consensus. Even so, some further multiple expansion should help to move the market higher. By end 2024, we look for around 2.5-5% outperformance versus U.S. equities and a cumulative 7.5% by end 2025. However, if Donald Trump were elected president, then it would likely reduce EZ equities upside in 2025. Trump has promised to end the Ukraine war in one day and seriously threatened to withdraw from NATO, which would cause a European political crisis and require a higher equity risk premium in EZ equities.
For the UK equity market, we are constructive for two reasons. Firstly, the market is underestimating prospective BOE easing and we look for a total of 200bps in 2024/25, starting in June. The UK value bias should see the market benefitting from lower interest rates. Secondly, Labour is highly likely to win the general election (most likely in October) and the market will hope that means a closer alignment with EU trade in future years and an ensuing growth benefit. By end 2024, we look for around 5% outperformance versus U.S. equities and a cumulative 10% by end 2025. The undervaluation of the UK equity market will also help as sentiment changes. The upside would be greater if China’s growth sustainably rebounded and boosted the energy and mining sectors, but this is not our baseline view.
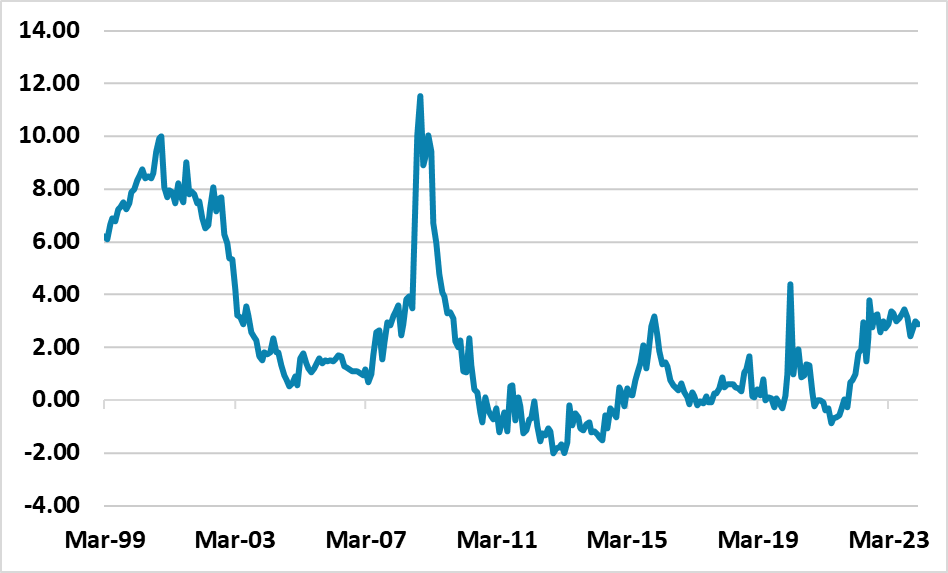
In terms of Japanese equities, the corporate reform story will be a positive for years to come and will help to deliver better earnings per share growth than recent years. However, a fair portion of the recent earnings improvement has been due to Japanese Yen weakness, which we see reversing – we forecast 135 on USD/JPY by end 2024, given that the extreme undervaluation of the JPY will be less sustainable with Fed rate cuts. Additionally, Japanese consumer are still resistant to price rise, as shown by the mild consumer recession. Wage increases will not get passed on fully and domestic corporate margins risk being squeezed. This means downside risks to the corporate earnings story. Meanwhile, the argument that negative 10yr real JGB yields support a higher price/earnings ratio will fade, as we see higher 10yr JGB yields with the BOJ ending yield curve control but then inflation coming down more than expected in 2025 (Figure 5). Finally, BOJ Ueda has indicated that the BOJ could reduce its ETF holdings and potential sales from the BOJ in 2025 will become a headwind for the market. We see no further gains for the Nikkei 225 in 2024 and look for a small 5% rise in 2025.
Figure 5: Japan 12mth Earnings Yield minus 10yr Real Government Bond Yield (using CPI inflation)

Source: Continuum Economics. Continuum Economics projections until end-2025 using inflation and 10yr JGB yield forecasts.
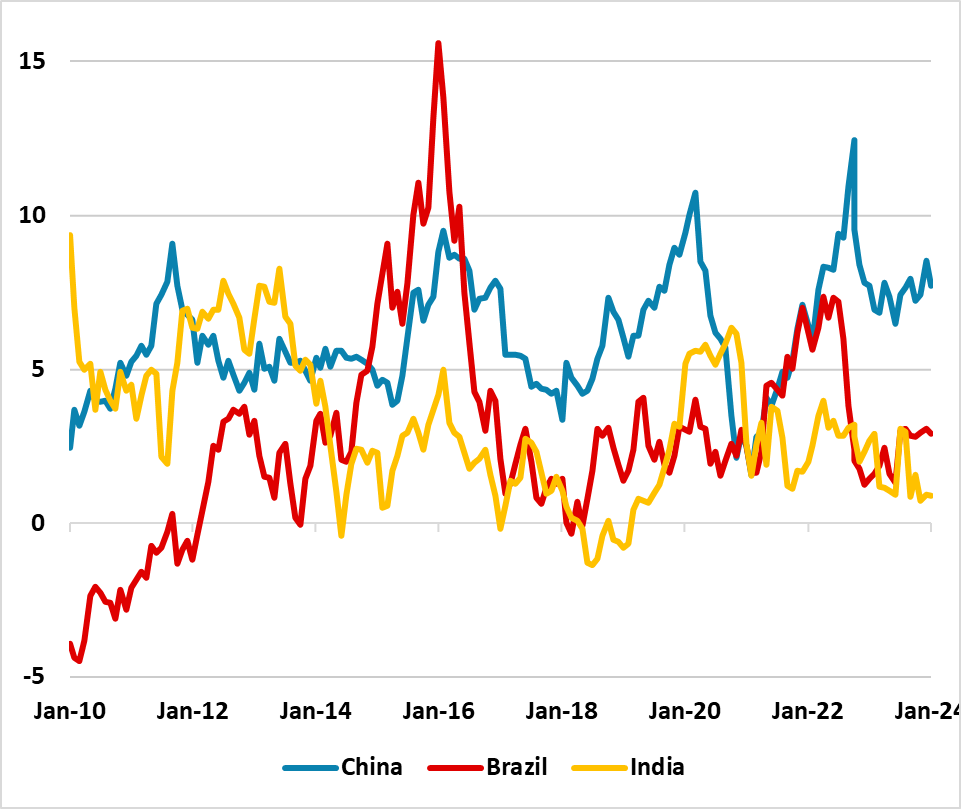
China’s equity market undervaluation (Figure 6) has reached the point that a short covering bounce has arrived, as the economic news is currently not deteriorating. Indeed, a tactical recovery will likely extend and China could outperform the U.S. by a further 5-10% in the next 3-9 months. The market is also too pessimistic on China/Taiwan, given the election of a pro-China speaker in the Taiwan parliament reduces 2024 risks of a major escalation (here). The negative GDP drag from the residential property downturn will also likely be more moderate in 2024 than 2023, while further fiscal and monetary policy easing will likely come through to try to hit the 5% real GDP target. Sentiment and foreign positioning towards China are so bad, that a bit of good news can extend the tactical rally.
However, we would not change the strategic underweight view on China in EM portfolios. We remain concerned that real GDP will struggle to hit 5% in 2024 and 2025, given that net exports are also being hurt by supply chain reconfigurations multiyear and residential property will still be a modest drag in 2025 and beyond. Additionally, private investment is weak, which is a cause for concern on employment, income and consumption growth. Finally, the authorities want to undertake targeted not aggressive action. Nominal GDP will be just above 5%, which is terrible compared to pre 2020. This all means that corporate earnings expectations at 15% per annum in 2024 and 2025 are too high and will likely disappoint. Thus we see only around a further 5-10% upside in 2025.
Figure 6: China Earning-Bond Yield Relative Cheap Compared to Other Big EM’s (%)

Source: Continuum Economics. CAPE Earnings Yield-10yr Real government bond yield
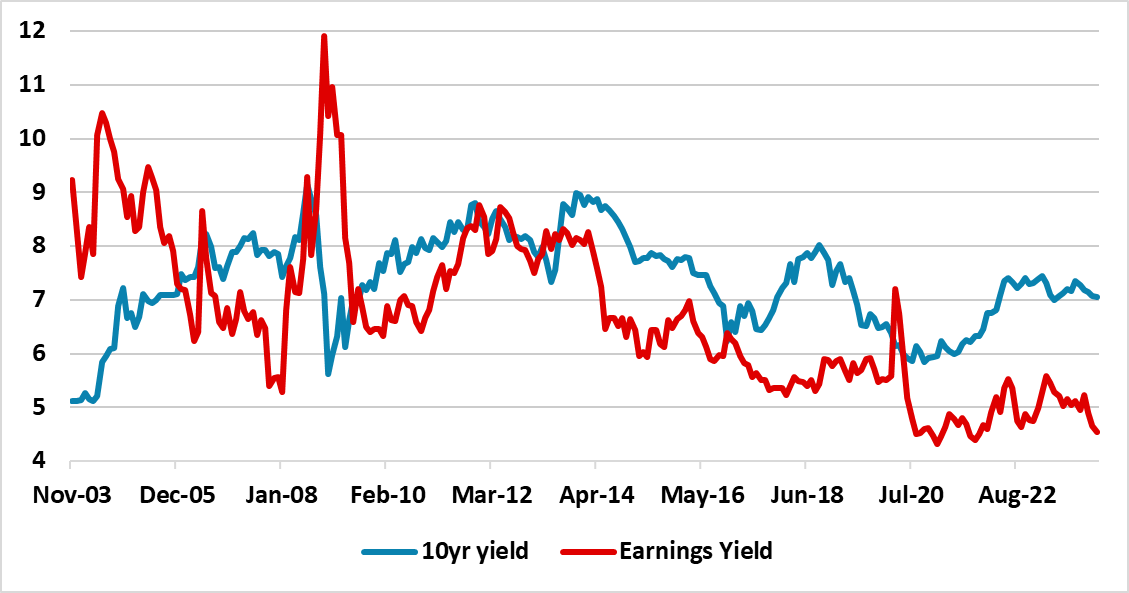
India bullishness sits in contrast to China worries among global EM equity funds. The reelection of PM Modi and recommitment to moderate reforms will likely ensure that real GDP and corporate earnings momentum remains structurally very good in the coming years. With moderate RBI easing likely to be delivered from H2 2024, most of the consensus projected 14% earnings growth will likely go into pushing the market up a further 10% by end 2024 and only a modest portion into reducing the overvalued equity market. The story will likely be similar in 2025. Domestic equity buying has become broader meaning that the market is less dependent on foreign flows. The best long-term corporate earnings outlook of major markets will likely mean that earnings yields remain at a consistent discount to 10yr India government bond yields (Figure 7). India’s inclusion in more bond benchmarks also means that 10yr government bond yields should be capped.
Figure 7: India 12mth Fwd Earnings Yield and 10yr Government Bond Yield (%)

Source: DataStream/Continuum Economics
Finally, the Brazil earnings yield can fall alongside 10yr bond yields, which means a higher 12mth forward P/E ratio. We see the Brazilian central bank easing to 8.50% by end 2025, while the budget deficit situation remains under control and this should translate into decline in 10yr yields below 10%. We see a further 7.5% upside by end 2024 on the rate cuts and then a further 5% in 2025 as the BCB slows the pace of easing. Corporate earnings growth is slow to modest and a restraint to too much optimis