U.S. Strategic Fiscal Comparisons
The U.S. short average term to maturity is a structural fiscal weakness if higher rates lift U.S. government interest costs close to the nominal GDP trend. Hence, Trump’s pressure for fiscal dominance of the Fed to deliver lower policy rates and reduce U.S. government interest rate costs. However, the debate over whether the U.S. is seeing a soft or hard landing is reemerging and this instead will dominate the outlook for U.S. Treasuries in the next 3 months, rather than Fed independence questions.
Figure 1: DM Key Structural Fiscal Indicators
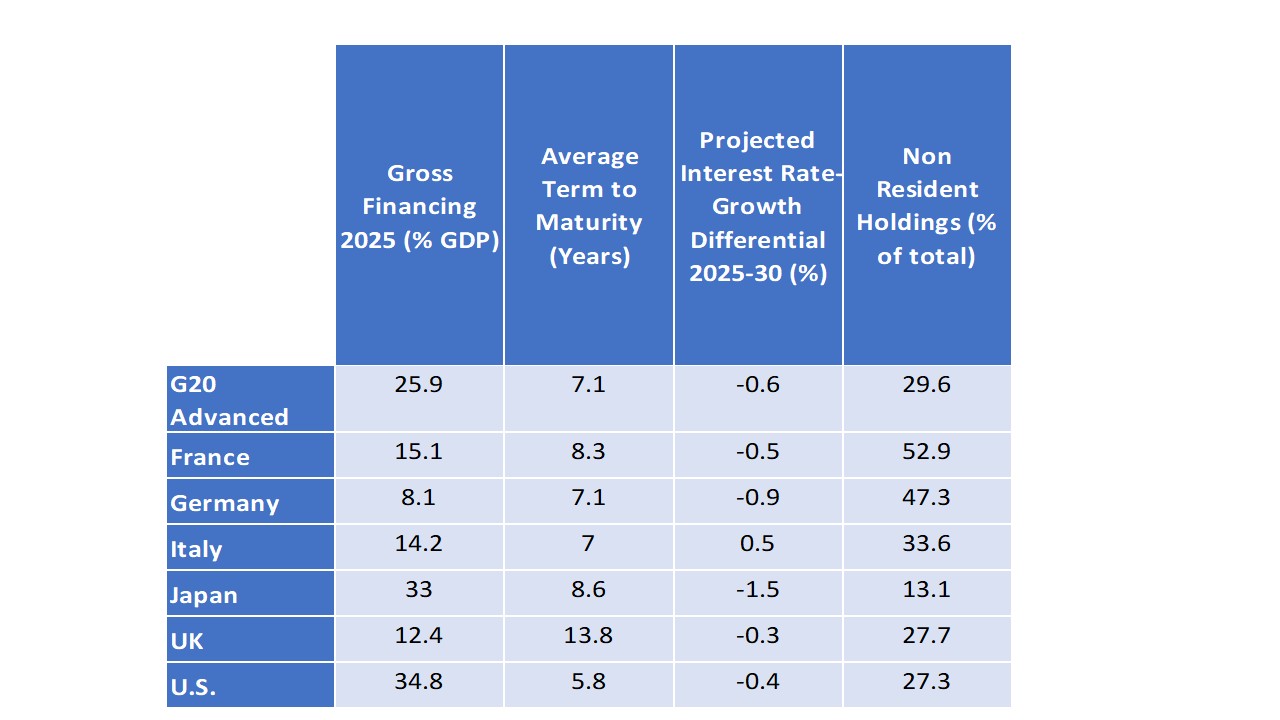
Source: IMF Fiscal Monitor/Continuum Economics. France/Germany/Italy high nonresident holdings mainly other EZ countries.
Figure 2: Net General Government Debt/GDP (%)
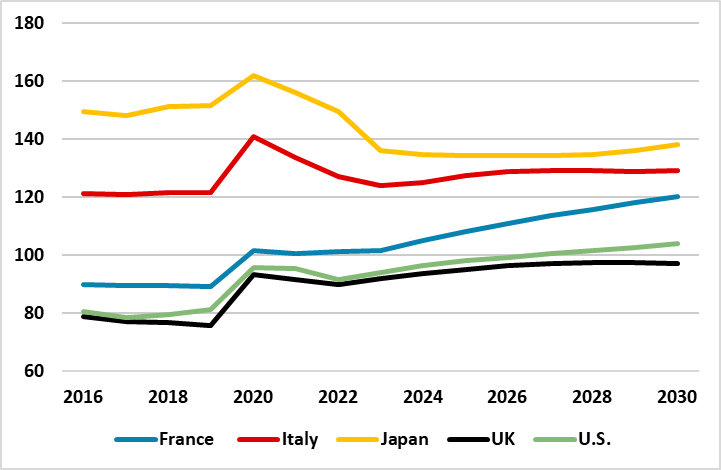
Source: IMF /Continuum Economics
Government bond markets show some risk premia at the 10yr area-plus in U.S./UK in real yield terms that are centered around 2%, but less so in EZ/Germany and Japan. This reflects long-term fiscal concerns, but we have argued this also reflects overall annual supply that needs to be absorbed once QT is added onto the core financing from the budget deficit/GDP (here). However, the persistent size of the U.S. budget deficit has raised long-term fiscal concerns, but how will this impact U.S. Treasury yields?
IMF estimates for U.S. net/debt to GDP from April show other countries with higher levels. Indeed, France’s case is a notably worse trajectory (Figure 2). While the projections do not take account of the big beautiful bill, the U.S. net debt trajectory may not be raised that much if the IMF/CBO take account of the extra tariff revenue being raised. Trump is achieving extra tariff revenues, without countermeasures and in most cases favorable trade deals for the U.S. The downside is if tariffs hurt U.S. trend growth and wider tax revenue.
However, it is also worth looking at other structural fiscal indicators (Figure 1). The percentage of non-resident holders in U.S. Treasuries is just below the G20 advanced economies average. The H1 USD decline, dropping of proposed section 699 tax, plus cyclical slowdown, mean that U.S. Treasury diversification could slow in H2 2025 for tactical reasons. However, if the Trump administration’s action severely damages Fed credibility into 2026, it could impact assessment of strategic holdings of U.S. Treasuries.
The other three measures are interrelated. The U.S.’s short average term to maturity is a weakness, as this then keeps the gross financing/GDP higher than otherwise. Moreover, it means that the higher post 2022 nominal and real interest rate increases filter into U.S. interest costs quicker than say the UK with long average term to maturity. In turn, this can reduce the average gap between interest rate cost and nominal growth differential over the 2025-30 period, those this is still projected to be negative (Figure 1). These latter structural fiscal indicators can cause an initially problematic fiscal situation to become chronic. Italy’s interest costs exceed trend nominal GDP meaning it needs to run primary fiscal surpluses, otherwise deficit and debt trajectories become unstable. In EM, Brazil and South Africa suffer from having to pay high real yields, which means interest costs exceeds trend nominal GDP (Figure 3).
Figure 3: EM Key Structural Fiscal Indicators
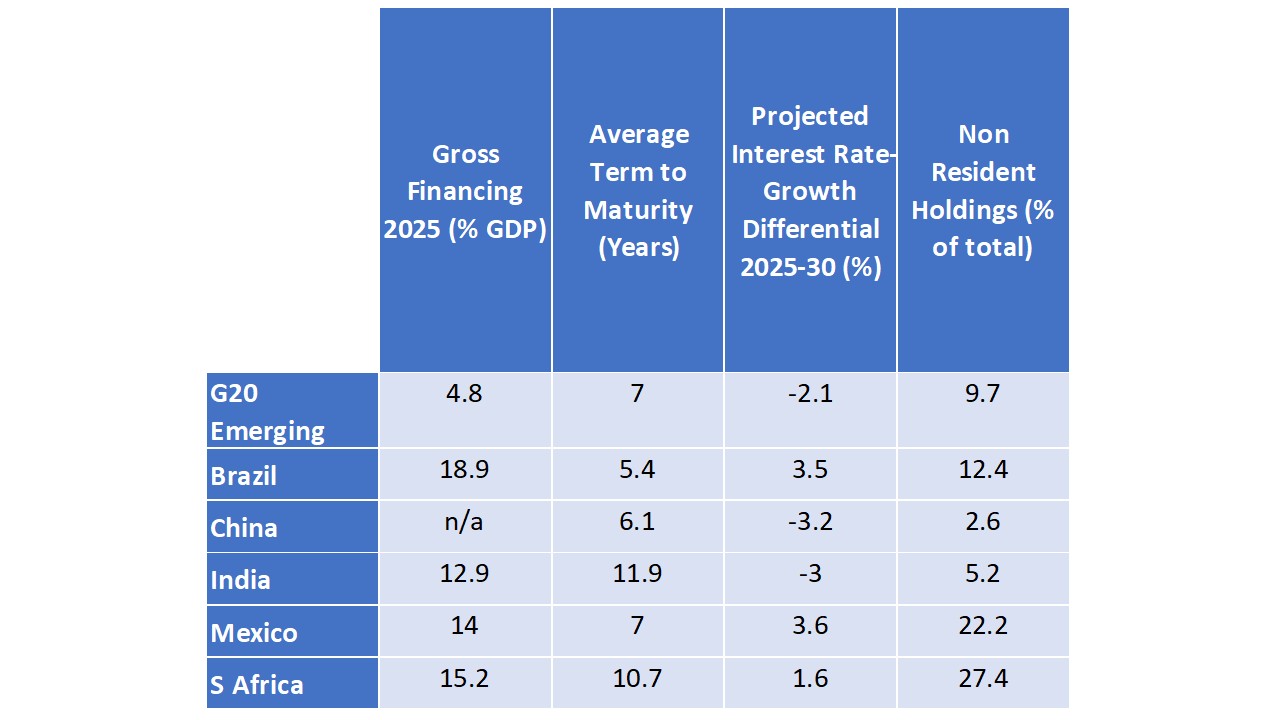
Source: IMF Fiscal Monitor/Continuum Economics
The U.S. is not on the path to interest rate costs exceeding nominal GDP trend yet, as the Fed Funds rate is above the neutral policy rate and Fed easing over the next 18 months of 100-125bps will bring T-bill and short-dated U.S. Treasury note interest costs down. However, it clearly worries President Trump, as he wants ultra-low nominal policy rates to lower debt servicing costs and this is attempted fiscal dominance of monetary policy. If a U.S. recession arrives then the Fed could cut to 2.5% or 2%, but then Trump would be fighting a recession and also a worsening budget deficit for cyclical reasons. What Trump really wants is for the Fed to lower neutral policy rate estimates, which would mean lower average policy rates over the cycle. With the short average term to maturity for U.S. government paper, this would reduce the interest costs per annum. Simply appointing a dovish Fed chair in May 2026 would not deliver this and so Trump’s actions need to be watched closely to see whether more radical Fed options (here) are considered e.g. extra Fed governor seats created for Trump appointees.
Debate over whether the U.S. is seeing a soft or hard landing are reemerging and this will dominate the outlook for U.S. Treasuries, rather than Fed independence and fiscal dominance. If the domestic demand trend slows from just above 1% to stagnation, then the mood can switch in the Fed towards pushing the Fed Funds rate down to 2.5% or below to avoid recession. This can produce more yield curve steepening but a 10yr yield down to 3.5% (see our alternative scenario here) -- though we still look for further yield curve steepening in most scenarios (here).
I,Mike Gallagher, the Director of Research declare that the views expressed herein are mine and are clear, fair and not misleading at the time of publication. They have not been influenced by any relationship, either a personal relationship of mine or a relationship of the firm, to any entity described or referred to herein nor to any client of Continuum Economics nor has any inducement been received in relation to those views. I further declare that in the preparation and publication of this report I have at all times followed all relevant Continuum Economics compliance protocols including those reasonably seeking to prevent the receipt or misuse of material non-public information.