DM Rates: QT adds to Budget Deficits Pressures
· Heavy issuance due to the U.S. budget deficit, plus Fed rate cuts will help further yield curve steepening in H2 2025. In EZ and UK, ECB and BOE QT is large and amplifies the amount of debt that the rest of the market has to absorb, which will also drives yield curve steepening alongside the traditional impact of further easing. In contrast, BOJ tightening would normally see yield curve flattening, but the level of yields is too low and BOJ QT is now a powerful 3% of GDP and we also see JGB yield curve steepening.
Figure 1: G4 Budget Deficit and Central Bank Government Bond Reduction/GDP (%)
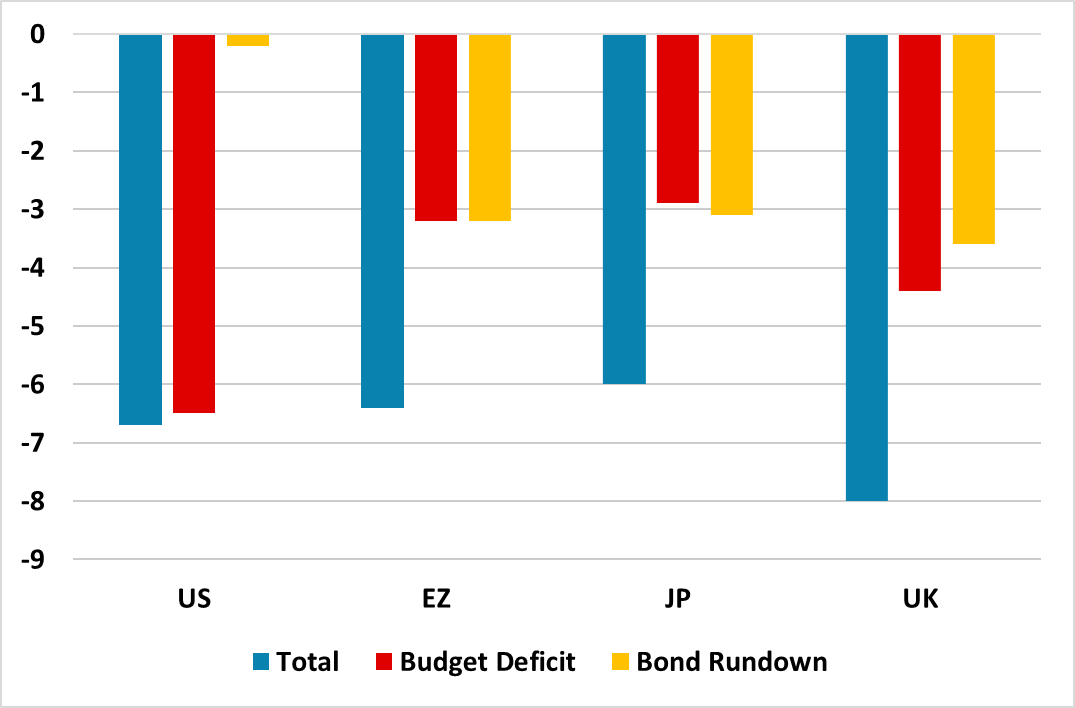
Source: Continuum Economics estimates.
DM government bond markets are seeing yield curve steepening. This is not just due to the traditional force of official rate cuts benefitting 2yr more than 10 or 30yr. It also reflects stickiness of 10-30yr yields and in some country’s intermittent increases in yield. In the U.S., one cause is the large size of the budget deficit, which produces relentless issuance by the U.S. Treasury. Demand has also been curtailed somewhat by foreign accounts becoming more cautious buyers of U.S. Treasuries, with Trump tariff policies and the associated decline in the USD. However, new supply pressures are not just a function of budget deficits. If you add on QT of government bonds to the budget deficit (Figure 1), then other major DM government bond markets have heavy supply after taking account of their central bank operations – this is a proxy, as some countries have noticeable differences between budget deficits and net issuance of bills/bonds to markets.
This yield curve steepening has been most noticeable in 30-2yr (Figure 2), but the prospects are for further steepening. Part of this is the traditional effect of easing prompting a steeper yield curve and we look for 100bps of Fed cuts by end 2026; 50bps from the ECB and 100bps from the BOE (June Outlooks (here)). However, it will also likely reflect the combined effects of budget deficits and QT.
Figure 2: G4 30-2yr Government Bond Yield Curve (%)
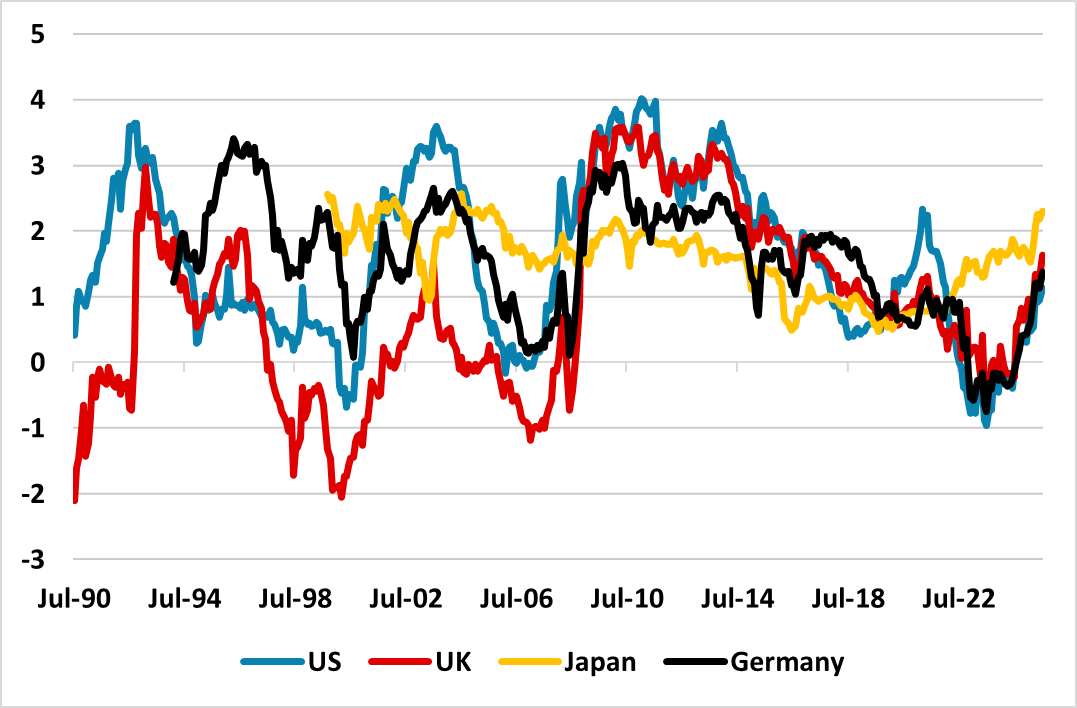
Source: Datastream/Continuum Economics.
The U.S. is set for a budget deficit in 2026 of between 6-7%. The CBO on Monday estimated that the Senate BBB will add USD600bln to the 2026 budget deficit (here), which would be consistent with 7%. However, Trump tariffs will raise some extra revenue, but this will be partially offset by tariffs slowing the economy and hurting broader tax revenue. 6-7% of GDP looks to be fair estimate for 2026. Foreign accounts have already been less aggressive net buyers of Treasuries than 2023/24, while H2 2025 into 2026 will also be dominated by Trump attempts to push the Fed into lower interest rates (here). Our DM Rates Outlook (here) forecasts more yield curve steepening, but with 10 and 30yr remaining close to current levels.
EZ government debt players face net supply that is doubled by ECB APP and PEPP QT (Figure 1), which is help yield curve steepening but also restraining credit growth (here). With Germany ramping up fiscal expenditure into 2026, and our forecast of two more ECB rate cuts in H2 2025, we see 10-2yr going to 100bps by early 2026. However, the ECB could slow the pace of QT later this year or early 2026, both to help credit growth and avoid too low excess reserves in the money market (here). For similar reasons we would also see the BOE slowing annual QT from £100bln to around £75bln from the September meeting (here), though this would still mean budget deficit + off balance + BOE QT would be around 7% of GDP. We forecast UK 10-2yr to 115bps by Q1 2026.
JGB’s are different as the BOJ is in a tightening cycle in contrast to other G4 countries, where the yield curve would normally see a bear flattening trade. However, the outright level of JGB yields is still low, while the BOJ QT is powerful at 3.1% of GDP in 2025 (Figure 1). The JGB market has been used to BOJ QE since 2013 indirectly being equal or greater than MOF net issuance (Figure 3), but now BOJ QT and the budget deficit are 6% of GDP. This has been a force behind the sharp rise in 20 and 30yr yields and we feel will also continue to see further 10yr JGB yield increase. We look for 10yr JGB yields in the 1.75-2.00% area by Q1 2026 and 10-2yr at 90bps.
Figure 3: Fiscal Deficit and Adjusted for BOJ QE/QT (% of GDP)
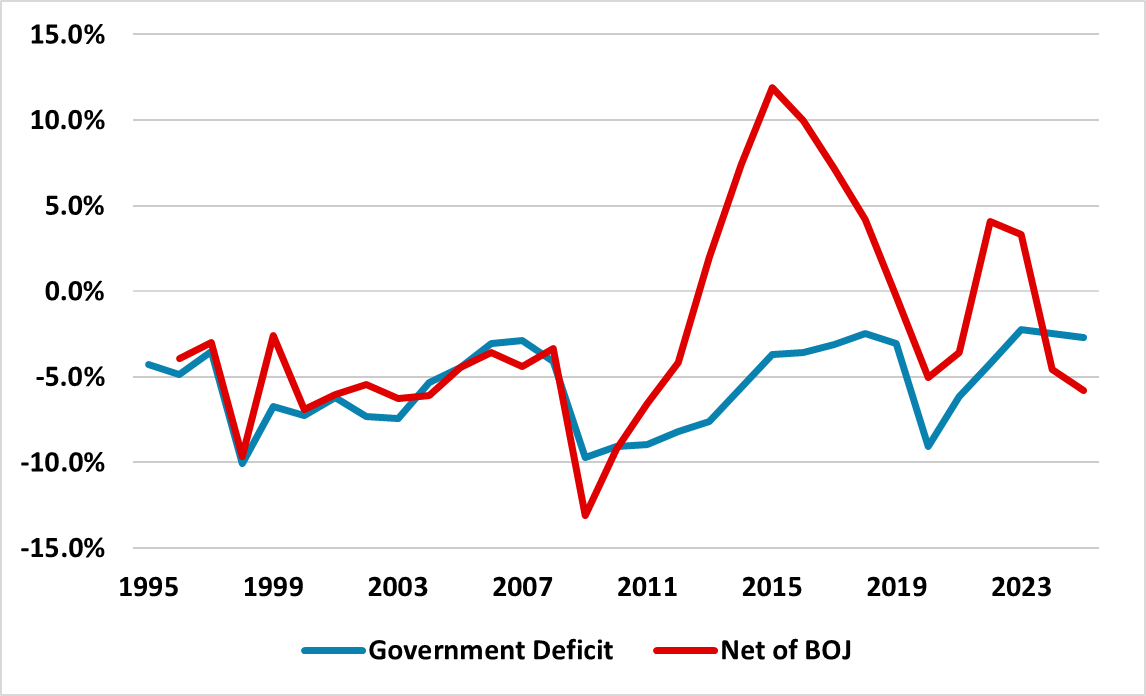
Source: BOJ/Continuum Economics