Equities Outlook: Turbulence Ahead
· U.S. trade wars will likely hurt U.S. growth and raise inflation, with only small to modest Fed easing and a 10yr budget bill that will likely be neutral to negative for the economy. With valuations still very high (Figure 1), we see scope for a correction to extend into mid-year that can bring the S&P500 down to 5200, as yet more tariffs are implemented by the U.S. A late 2025 rally can then be seen, as we see scope for trade deals later in the year and this can soften the worries over the impact of tariffs on the U.S. economy. We forecast 5700 for the S&P500 for end 2025.
· EZ equities will likely have to cope with U.S. tariffs, given President Trump’s strong concern that EU/Germany are taking advantage of the U.S. Combined with a delayed economic recovery, this can restrain the scale of further outperformance, despite ongoing ECB easing. We prefer the UK equity market that faces less direct tariff risks from the U.S. as we also see more BOE easing that discounted by the money market.
· India equity-bond yield relatives have returned to normal and the correction is getting mature. Given long-term earnings prospects, plus a friendly relationship with the U.S., we see scope to outperform the U.S. by 10% in the remainder of 2025. China can see some further outperformance, especially once a U.S./China trade deal is signed in late 2025. However, multi-year we prefer India and EM Asia ex China.
· Risks to our views: U.S. economy sees stagnation or mild recession hitting corporate earnings expectations and fwd P/E ratio falls noticeably. S&P500 falls to 4800-5000.
Figure 1: 12mth Fwd S&P500 P/E Ratio and 10yr Real U.S. Treasury Yield Inverted (Ratio and %)
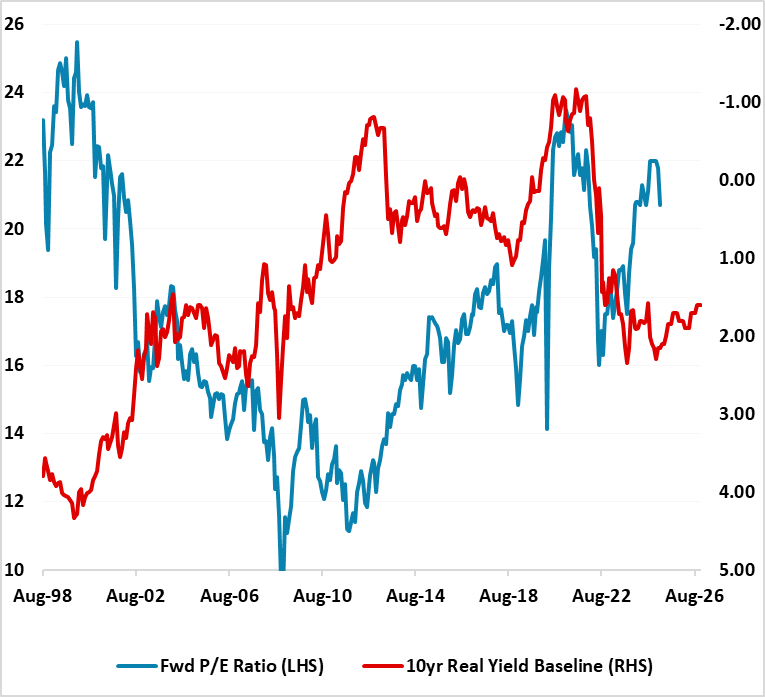
Source: Continuum Economics with forecasts to end 2026
The U.S. equity market has corporate earnings momentum as a support to any price correction, but the question is how much earnings growth will be downgraded with the U.S. economy slowing. The trade war with Canada/Mexico and China shows that President Trump wants to disrupt existing trading patterns and bring production back to the U.S. if partners do not make trade concessions to the U.S. Trump is also keen on tariffs for extra (tax) revenue. This all means that the trade war will likely broaden in the spring and summer, with product tariffs (e.g. cars/pharma) and reciprocal tariffs introduced on some other countries as well. The prospect is for a larger trade shock than in 2018-19 and we see a softening of U.S. growth and some feedthrough from slower U.S. growth and higher inflation from tariffs.
Can other policies help offset the trade shock and curtail a correction for U.S. equities? The fall in new immigrants to the U.S. points to slower employment growth, while DOGE restructuring of government departments is also adversely impacting economic sentiment. The 10yr budget bill should arrive by the summer around the House outlines, but the tax cuts will be mainly extending existing 2017 measures and the net effect could be neutral to negative for the economy given the planned expenditure cuts. Overall, we have switched our view of Trump policies to now be a modest negative for the U.S. economy rather than positive. The Fed will be sensitive to any slowdown in the labor market and this could deliver a rate cut or two in 2025, but unless a hard landing is seen for the U.S. economy the Fed will likely be cautious rather than aggressive.
The U.S. equity market still has the tech sector. The correction in tech stocks this year so far is healthy, given that earnings momentum is good and the AI/technology story will likely continue for the rest of the year.
Overall, with valuations still very high (Figure 1), we see scope for a correction to extend into mid-year that can bring the S&P500 down to 5200, as more product/country and reciprocal tariffs are implemented. A late 2025 rally can then be seen, as we see scope for trade deals late in the year and this can soften the worries over tariffs on the U.S. economy. We forecast 5700 for the S&P500 for end 2025. However, this is based on a soft landing for the U.S. economy that tempers the adverse effects on inflation from tariffs, but also keeps long-term earnings expectations in the 2 half of the decade. An alternative scenario of stagnant growth or technical recession for the U.S. economy would severely dent earnings expectations, and this would be amplified by a noticeable fall in the fwd price/earnings ratio. A fall to 18 or below for the fwd price/earnings ratio could be evident in this scenario and 4800-5000 on the S&P500 i.e. a bear market.
For 2026, the adverse headwinds from the tariff increases should soften, as we now see the bulk of tariffs introduced in 2025. Extra tariffs in 2026 will likely be less and adjustment to new tariffs will be more mature – we can also see trade deals between the U.S. and a number of countries. The Fed will also likely feel more confident that 1 round effects on inflation from tariffs are not feeding through too much to 2 round effects and thus extend the easing cycle. This can gradually lift the mood and our baseline is for a modest recovery to 6000. However, policy uncertainty is substantive in the U.S. While most Trump administration policies were signalled during the campaign, tariffs have been sooner than expected and larger than anticipated for Canada and Mexico.
Figure 2: Germany/UK 12mth Earnings Yield minus 10yr Real Government Bond Yield (using 10yr breakeven inflation)
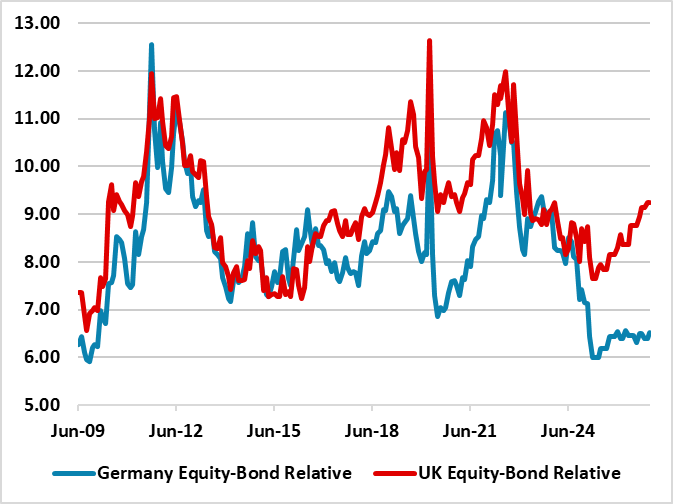
Source: Continuum Economics. Continuum Economics projections until end-2026 using 10yr breakeven inflation and Bund/Gilt yield forecasts.
In terms of other DM equity markets, tariffs are adverse to growth and disinflationary. Counter tariffs against the U.S. will likely be smaller in size and global trade will be hurt by the broad scope of U.S. actions. The EU will likely be hit be some tariffs in the spring, given Trump’s strong concern that the EU and Germany are taking economic advantage of the U.S. The scale and duration remain uncertain however, but a U.S./EU trade deal is unlikely to be reached quickly. This will be a headwind for EZ equities. Additionally, a clean ceasefire and peace deal that means cheap Russian gas for Europe, plus lasting geopolitical stability, is possible but uncertain and the alternative of an ongoing war could be negative for EZ equities if European/Russian tensions escalate and the U.S. becomes focused elsewhere. However, Europe is clearly on a path to a quick increase in defense spending, which will help growth from 2026 onwards (here).
The main positive for EZ equities is that the ECB will likely keep on cutting to a 2% deposit rate this year to offset tariff effects. Previous ECB rate cuts have helped boost the fwd price/earnings ratio. However, fwd price/earnings ratios have now moved up to around fair value. Our 12mth forward price/earnings ratio to 10yr real government bond yields is also projected to become less favorable (Figure 2), as 10yr nominal bund yields remain just under 3%. Additionally, EZ equities need an economic recovery for extended outperformance and this is more a 2026 story than 2025. On balance, we see further modest outperformance on EZ equities by around 2.5% for the remainder of 2025 versus the S&P500. Similar outperformance can be seen in 2026.
Japan and UK equities are less at risk from the direct effect of tariffs, given better relations with the U.S. but trade wars between the U.S. and other major countries will temper global growth and corporate earnings prospects. Japan also has the headwind that the JPY is adjusting back towards more normal valuations against the USD. We would see JPY gains slowing below 135 on USDJPY, but JPY gains can still temper corporate earnings estimates in 2025. We do not see BOJ interest rate normalization as a major problem, given that we only see a further 25bps of hikes. After underperforming other major equity markets, we would see scope for around 2.5% outperformance by Japan versus the U.S. in the remainder of 2025.
Re UK equities, the hit to global trade will likely restrain the FTSE100. However, we still see more aggressive cuts than the money market from the BOE, both to boost the economy and as core inflation pressure surprises to the downside. The UK government spending surge should also help an economic recovery into 2026. FTSE250 can outperform the U.S. by 5% in the remainder of 2025 and a similar performance in 2026.
Emerging Markets
China’s policy-makers delivery of further fiscal stimulation is important for China’s equity market as it provides some economic momentum, but also guards against downside risks in the face of the trade war with the U.S. However, equity only valuations are now back to fair value. Further noticeable outperformance depends on corporate earnings delivery or upside economic surprises. We still feel that 2025 and 2026 corporate earnings growth expectations need to be revised down further, both given 5% nominal GDP and the excess of production over domestic demand. The PBOC also opposes QE for fears that it could impact bank profit margins and this means 2% real 10yr yields – which means that equity to real bond yield ratio is now fair value (Figure 3)! Meanwhile, economic surprises could remain on the downside rather than the upside, as the residential investment inventory hangover remains large and China consumers are cautious. The one bright spot is the AI story in China. We could see a further 5-10% outperformance versus the U.S. by end 2025, but most will come after a revised trade deal is agreed with the U.S. Multi-year we do not see China equities strategically outperforming, given the overhang of the property bust and structural headwinds from population aging/slowing productivity.
Figure 3: China Earning-Bond Yield Relative Cheap Compared to Other Big EM’s (%)
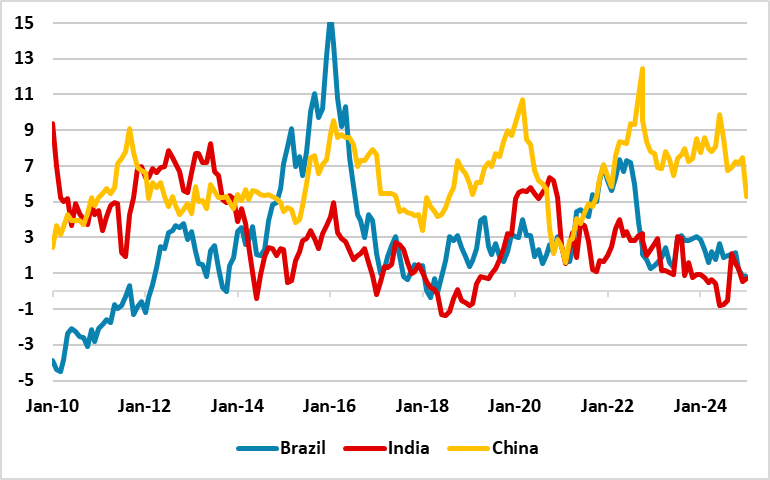
Source: Continuum Economics. CAPE Earnings Yield-10yr Real government bond yield
Indian equities have seen a correction from overvalued levels and the fwd price/earnings ratio is now less overvalued. The question is whether this needs to swing back to fair value or a small undervaluation for Indian equities before a bottom is seen. However, Indian bond yields have edged lower, which means that that 12mth fwd earnings yield to 10yr government bond yield is now back to fair value (Figure 4). India long-term corporate earnings prospects also means that global investors will likely return in the coming months. Thus we look for Indian equities correction to end in the coming months and outperformance to resume in H2. We see scope to outperform U.S. equities by 10% in the remainder of 2025 and then a further 10% in 2026. India is now once again our favorite market.
Figure 4: India 12mth Fwd Earnings Yield-10yr government Bond Yield (%)
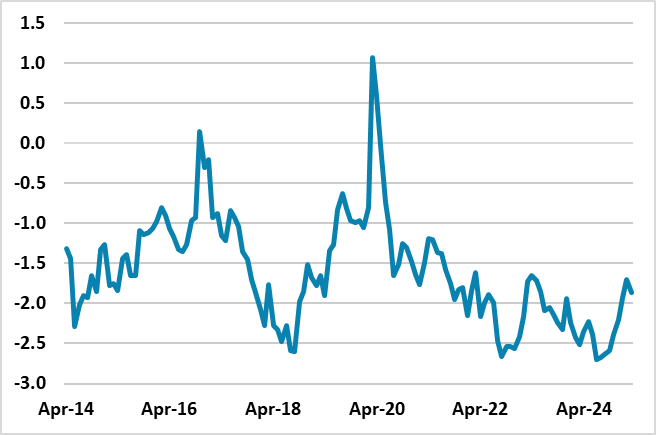
Source: Datastream/Continuum Economics.
Brazil’s equities are facing the challenge of high policy rates that risk slowing the economy still further and hurting the corporate earnings outlook. Additionally, the U.S. centric trade wars will spillover to hurt commodity demand and prices. However, fwd earnings yields are well below fair value and discount a lot of bad news. We would also see the Brazilian central bank (BCB) finishing its tightening cycle and then swinging to rate cuts in 2026 to avoid recession. This can help Brazil equities outperform the U.S. in H2 and we see scope for a 5% outperformance in 2025. 2026 should be better with consistent BCB easing helping to bring down short-dated yields and allowing a fall in fwd earnings yield that sees the price/earnings ratio moving towards fair value. 10% outperformance versus the U.S. can be seen in 2026.