DM Central Bank Signals Awaited
· Fed/ECB and BOE meetings will likely see concern over the potential 2nd round inflation effects from the Iran war, but forecasts seeing inflation coming down in 2027 and no imminent signals of tightening from the ECB/BOE – our baseline remains for easing later in the year, as energy prices see a partial reversal. However, a good prospect remains of a 25bps BOJ rate hike on April 28 (here).
DM central bank meetings at the end of April will provide new signals on the Iran war macro impact.
Figure 1: U.S./EZ/China Forecasts on a 4-8 Week War Scenario (%)
| 2026 GDP | 2027 GDP | 2026 CPI Inflation | 2027 CPI Inflation | End 2026 Policy Rate | End 2027 Policy Rate | |
| U.S. | 2.2 | 1.8 | 3.2 | 2.2 | 3.13 | 3.13 |
| EZ | 0.6 | 1.2 | 2.2 | 1.9 | 1.75 | 1.75 |
| China | 4.2 | 4.2 | 1.4 | 0.1 | 1.3 | 1.2 |
Source: Continuum Economics.
We are starting to get more official forecasts of the impact of the Iran war, with the IMF WEO on Tuesday (Figure 2) – for contrast we have our forecasts from the March outlook in Figure 1 (more details see here). The IMF forecasts have a lot of similarity to the OECD forecasts on March 26 in terms of 2027 GDP, though the OECD is lower on 2026 GDP especially for the EZ and U.S. (0.3% for each). The GDP impact is small to modest. However, greater diversity exists over CPI inflation forecasts, with the IMF at 3.2% for 2026 U.S. inflation but the OECD at 4.2% -- though the OECD forecasts 1.2% for 2027 U.S. CPI as high 2026 energy prices ease. The ECB have already released macro forecasts on March 19 that incorporate the initial take on the Iran war (here), while the BOE on April 30 will provide new forecasts. The Fed will publish FOMC members median forecasts in June, rather than April 29 and this leaves the onus on communications from the Fed and chair Powell. What will central banks consider?
Figure 2: IMF GDP and CPI Forecasts (%)
| Real GDP | CPI Inflation | |||
| 2026 | 2027 | 2026 | 2027 | |
| U.S. | 2.3 | 2.1 | 3.2 | 2.3 |
| Eurozone | 1.1 | 1.2 | 2.6 | 2.2 |
| Japan | 0.7 | 0.6 | 2.2 | 2.3 |
| UK | 0.8 | 1.3 | 3.2 | 2.4 |
| China | 4.4 | 4 | 1.2 | 1.5 |
| India | 6.5 | 6.5 | 4.7 | 4 |
| Brazil | 1.9 | 2 | 4 | 3.4 |
| Mexico | 1.6 | 2.2 | 3.9 | 3.4 |
Source: IMF WEO (here)
Figure 3: OECD Core CPI Inflation Estimates (%)
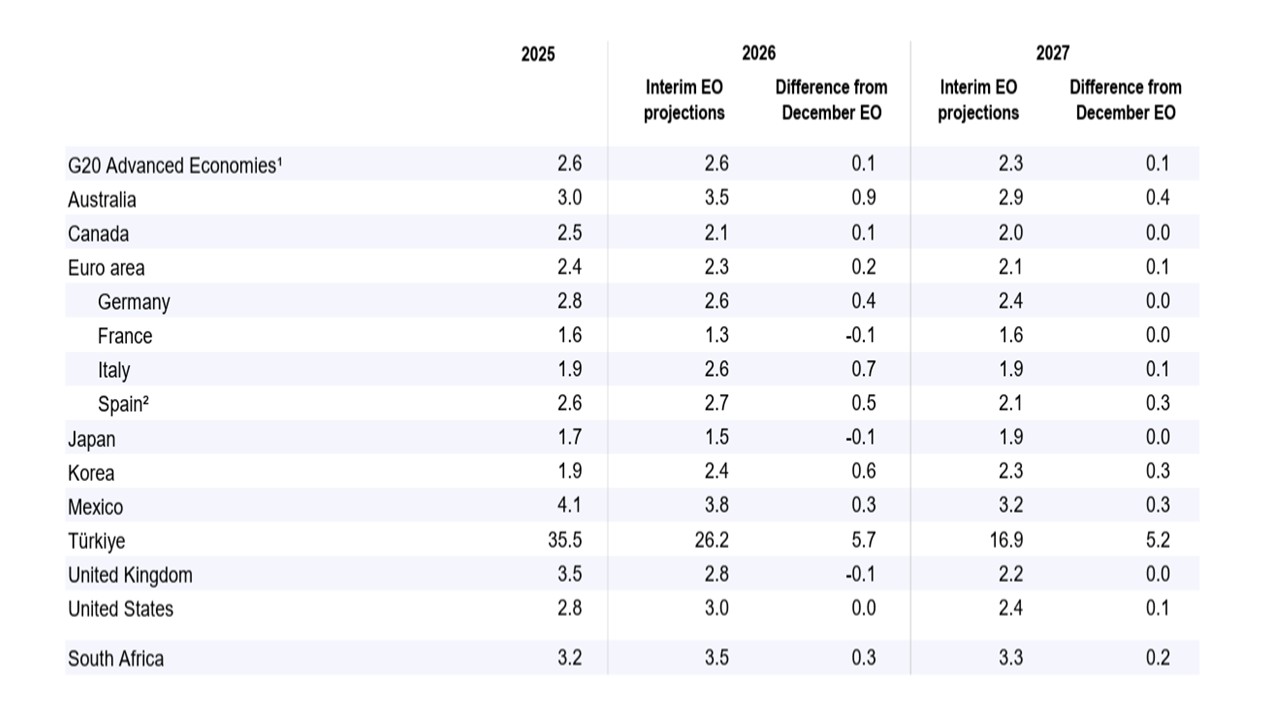
Source: OECD (here)
DM central bank forecasts will probably be in the same ballpark as the IMF/OECD forecasts, but with differences from some of ours e.g. EZ 2026 GDP growth. However, communications on forward policy guidance will also need to take account of alternative scenarios. Figure 4 shows our forecasts based on a 2-6 month scenario (for more see here), which are presented as ranges given they encompass a complete closure of the Straits of Hormuz and could include extra energy infrastructure damage. This is the assessment that central banks will have to go through. Diplomatic developments over the next 2 weeks will be a crucial input, as we feel that the U.S. and Iran are looking for ways to end the war and allow a gradual reopening of the Straits of Hormuz (here). The ECB and BOE will likely leave open the option to tightening but equally emphasize that nothing is imminent and that a reopening of the Straits of Hormuz could lead to no hikes. But also expect policy preference differences to be aired further in the interim. The Fed, without new median DOTS, will likely keep a neutral policy view for the next few months, with the lack of gasoline taxes meaning a bigger relative jump in gasolines prices than in Europe. Our individual previews will follow in the next week. However, it is also worth watch incoming data. One problem with oil futures curve at the moment is that spot oil deliveries are much higher in some countries, which could mean a higher initial impact than suggested by future curves.
Figure 4: U.S./EZ/China Forecasts on a 2-6 Month War Scenario (%)
| 2026 GDP | 2027 GDP | 2026 CPI Inflation | 2027 CPI Inflation | End 2026 Policy Rate | End 2027 Policy Rate | |
| U.S. | 1.6-2.0 | 1.0-1.7 | 3.6-4.2 | 1.8-2.4 | 2.5-3.5 | 2.0-4.0 |
| EZ | 0.0-0.5 | 0.6-1.0 | 2.8-3.4 | 1.6-2.3 | 1.5-2.5 | 1.5-2.0 |
| China | 3.9-4.2 | 3.8-4.0 | 1.8-2.8 | -0.6-+1.0 | 1.2-1.3 | 1.1-1.2 |
Source: Continuum Economics.