Markets: Less U.S. Recession Risk, But Trade Headwinds
Though we had expected a U.S./China trade truce, the terms are more favorable to U.S. growth than we anticipated. Combined with the UK framework deal, we have revised down the probability of a U.S. recession from 35% to 20%. In turn we have revised up the end 2025 and end 2026 S&P500 forecasts to 6000 and 6500. However, trade headwinds will remain, both as the effective tariff rate has jumped since 2024 and a high risk exists of the Trump administration pivoting to raise strategic product tariffs to 25% e.g. Pharmaceuticals. U.S. equities are also overvalued again versus equity history and versus real and nominal bond yields.
The U.S./China trade truce (here) is better than we had expected. What are the market consequences?
Figure 1: 12mth Fwd S&P500 P/E Ratio and Inverted 10yr Real U.S. Treasury Yield (%)
Source: Continuum Economics
The U.S./China trade truce ended up with a 90 day floor of 10% for reciprocal tariffs, with the risk that 34% could be imposed if U.S./China trade talks breakdown, according to U.S. Treasury Bessant after the weekend’s negotiations. However, this is PR spin and negotiations will continue to keep some pressure on China in the coming months. This is a lower reciprocal rate than we expected. The eventual reciprocal tariff for China could be 15-20%. Meanwhile, the 20% fentanyl rate could be lowered to 10% or zero depending on China’s actions. Additionally, Bessant talked about the 2019 phase 1 deal with China as being a good starting point, which is softer than the previous position of a tough phase 2 deal with penalties if targets are not met and a desire to eliminate the bilateral deficit. Combined with the UK deal (here), the odds of a persistent trade hit for the U.S. economy are now lower and we reduce the probability of a U.S. recession in the next 12 months from 35% to 20%.
For the U.S. equity market, we still look for April and May data to show some impact from liberation day tariffs/trade uncertainty and erratic policymaking. The Trump administration is also pivoting towards strategic product tariffs, with a high risk of a 25% pharmaceutical product tariff to be announced in the coming weeks – though implementation will likely be later in the year to allow production to shift to the U.S. Additionally, progress on other trade framework deals will likely drag on towards the July 9 deadline, which will be a headwind – though in reality the Trump administration will likely extend the deadline in a crunch. This can soften up the U.S. equity market and we still see scope for a pullback to the 5200-5400 area in the coming months on the S&P500. However, the downside will be less than we previously thought. Moreover, the progress on trade deals in late spring/summer will likely help market sentiment in H2. Additionally, the agenda will likely shift to the anticipated stimultive effects of the 10yr budget bill and deregulation efforts. We see scope now to 6000 by end 2025 and 6500 for end 2026 from 5500 and 6000 respectively. However, the U.S. equity market is overvalued still and out of line with real 10yr Treasury yields (Figure 1), which will also be a headwind to the market. Additionally, although US investor home bias is rebooting U.S. exceptionalism talk, foreign investors long-term confidence has been significantly dented (see below).
Though a recession is now less likely, the U.S. equity market also has some risk if the U.S. Treasury market ends up with higher yields than our baseline. Our central view has one 25bps cut from the Fed in 2025 and two in 2026, which results in a choppy pattern centered around the 4.00-4.50% area for 10yr U.S. Treasuries. An alternative scenario is that 10yr Treasuries end up around a further 60bps higher. This could come from Congress adopting a 10yr budget bill that boosts the 2026 budget deficit to more than the 6.5-7.0% of GDP in our baseline. Alternatively it could come from foreign investors reducing new portfolio flows into Treasuries and/or trimming existing large holdings. Foreign investors’ sentiment has been hit harder than U.S. investors, both as the USD has declined and trust in the U.S. has been eroded by aggressive and erratic tariff policies (here). In this alternative scenario, 10yr real yields would be higher and the gap with fwd price/earnings ratio still more stretched – yellow line in Figure 1. We currently attach a 20% probability to this alternative scenario.
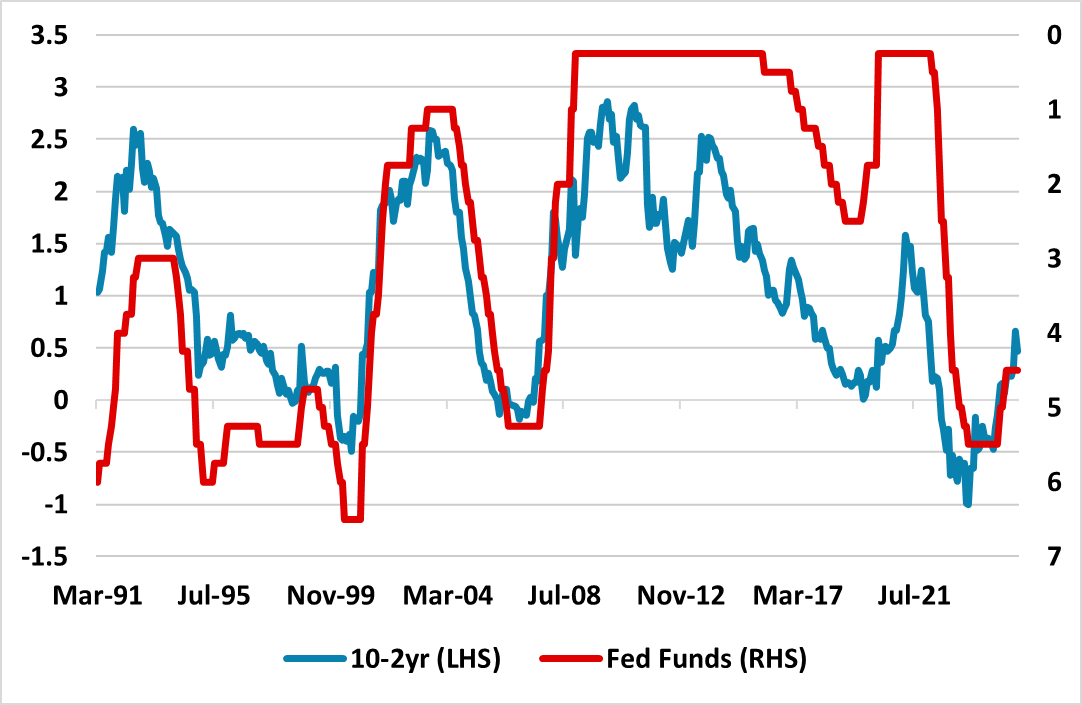
In terms of our U.S. Treasury baseline view, one other issue we are watching is the 10-2yr yield curve slope, which has swung into positive territory from the June 2023 inversion (Figure 2). We see this going to 70bps by early 2026, as current nominal and real 10yr yields prove attractive enough to investors. However, the current 10-2yr is not steep by historical standards.
Figure 2: 10-2yr U.S. Treasury (%)

Source: Datastream/Continuum Economics
In terms of the USD, a bounce has been seen since the April low point (Figure 3), as the Trump administration has undertaken partial U turn on tariffs and the market has discounted less Fed easing. However, foreign investors view of U.S. exceptionalism in the equity market has been dented by the erratic nature of policymaking under the Trump administration. This has been noticeable in Europe, where the past 10 years have seen large positions being built up by end European investors in U.S. equities. The annual TICS breakdown shows that EU27 plus UK/Norway and Switzerland held US8111bln of U.S. equities end June 2024 versus US974bln by Japan (here). These huge inflows could slow as U.S. exceptionalism is less embraced by European investors and also some of the existing huge holdings could be redistributed outside the U.S. The Trump administration is also pivoting to pressure Europe on the trade front, while Trump will likely make big demands of the European military before the key NATO summit June 24-25. This may not matter to U.S. investors, but it will to Europeans. The USD is also overvalued in nominal and real terms. We still maintain the 1.20 view on EUR/USD for end 2025.
Figure 3: Nominal Dollar Index Against Major DM Currencies (Index)
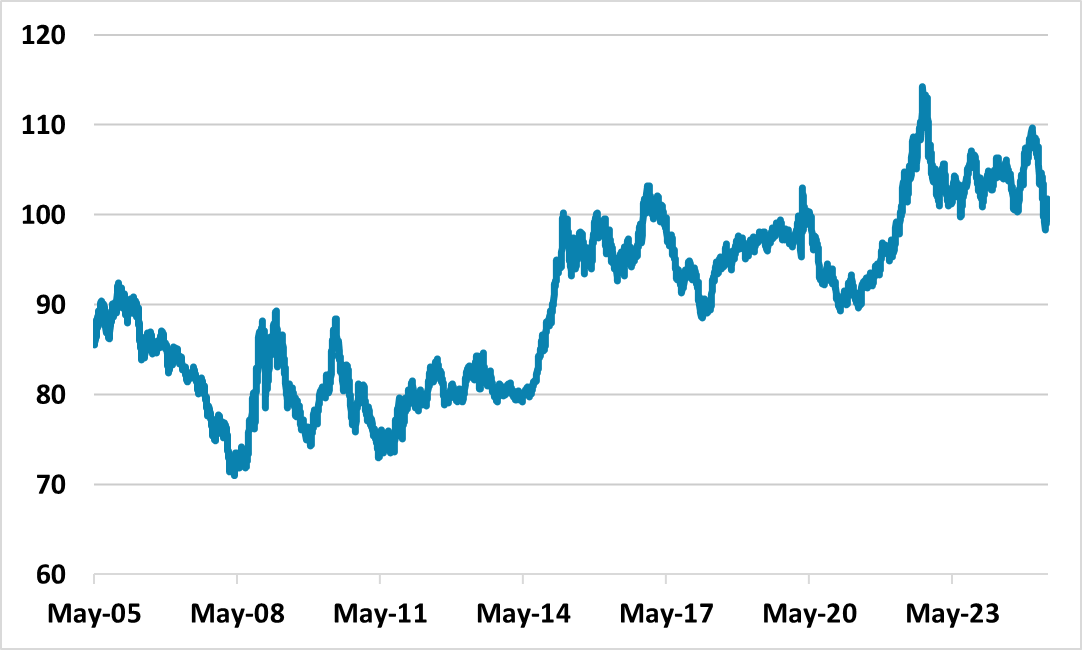
Source: Datastream/Continuum Economics