Big EM’s: Cyclical Tariff Hit V Structural Drivers
China, India and Brazil are all seeing cyclical slowdown for varying reasons, with China likely to be hardest hit by adverse net exports due to Trump’s tariff wars. Though financial repression in China can allow further fiscal stimulus, the household sector and residential property investment are structural headwinds to growth. In contrast, most structural forces in India are tailwinds, that can likely support the economy in a cyclical slowdown. Brazil cyclical slowdown is driven by high interest rates to curb inflation, which can produce a soft landing in H2 2025. The key structural challenge remains the high government debt/GDP level, which will come into sharp focus ahead of the October 2026 election.
The impact of the Trump tariffs on large EM countries not only varies with the tariff imposed by country, but also the underlying structural position and policy changes.
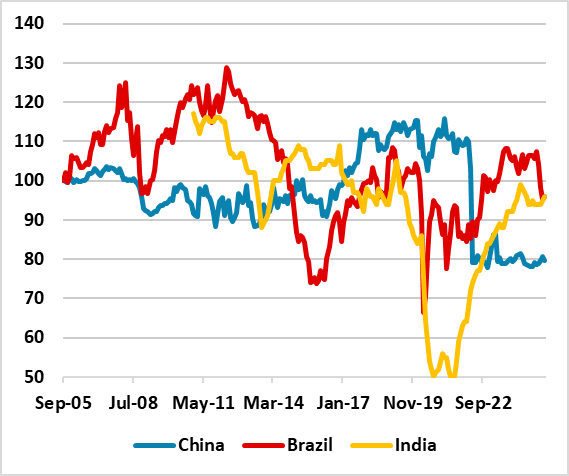
Figure 1: Consumer Confidence in Selected Big EM’s (Index)

Source: Datastream/Continuum Economics
Big EM economies face contrasting fortunes and this is not only the current and/or future tariffs rates that the U.S. will impose. By way of contrast, we look at Brazil, China and India reviewing cyclical and structural momentum and policies. The U.S. current reciprocal rates are 10% for Brazil and India; and we feel India should be able to agree a trade deal in the next few months with the U.S. that avoids extra reciprocal rates. China will likely see a postponement of most of the 125% reciprocal tariff but the U.S. will likely want to set the minimum around 20%, while trade negotiations carry on. However, a trade deal with China will likely take longer than with India and other big Asia EM’s and it could be H1 2026 before a deal is struck, given the divergent positions between the U.S. and China. China risks a bigger net export hit than most Asian countries.
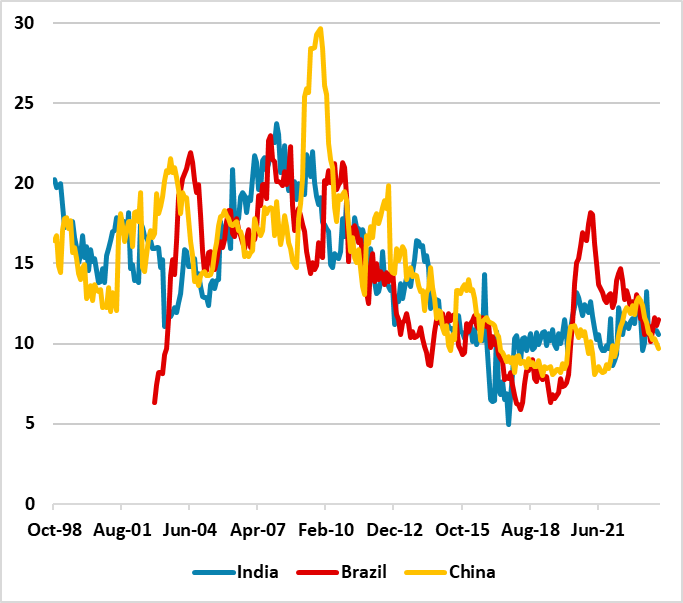
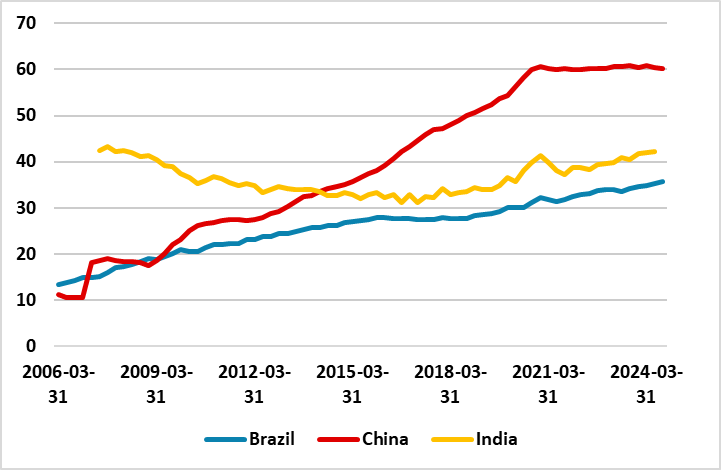
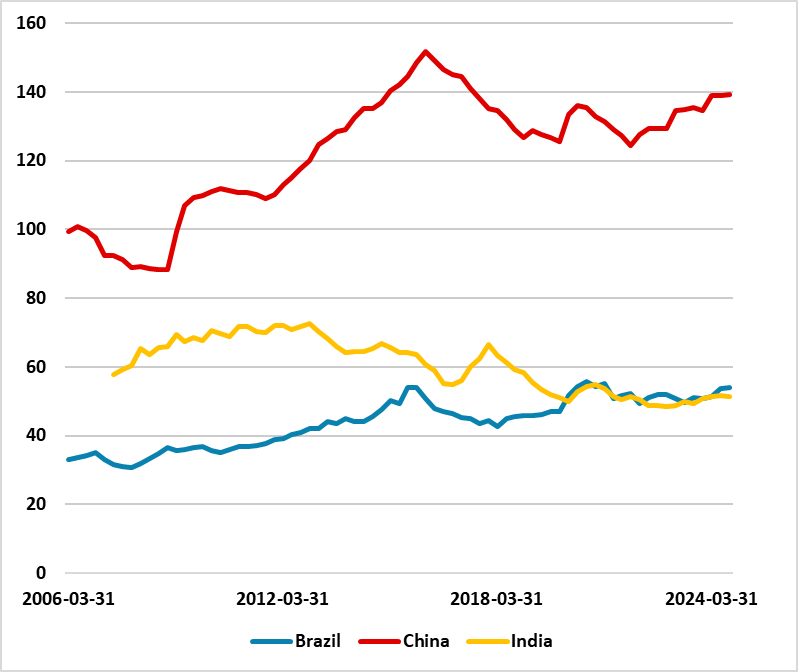
However, China is also in a weak cyclical economic position, with modest consumption and subdued private sector investment. Consumer confidence (Figure 1) has taken a structural hit due to the property market downturn, but China’s households are also worried about jobs and income that is restraining consumption. M2 growth (Figure 2) by China’s standards is also weak, due to subdued credit demand. Though China authorities have taken steps to ease monetary policy (here), the private sector is unlikely to materially increase borrowing until the property market starts to properly rebound. China’s household debt/GDP is excessive for an EM economy (Figure 3) and we think balance sheet considerations could dominate for the next few years. This leaves China’s growth unbalanced and dependent on government spending/SOE’s and high tech manufacturing – high corporate debt (Figure 4) is mainly LGFV and SOE while financial repression will see it rolled over at low financing costs. We still feel that further fiscal stimulus will be delivered, but the hit from the U.S. tariffs will likely mean 4.2% GDP growth in 2025.
Figure 2: Money Supply Growth (%, Yr/Yr)

Source: Datastream/Continuum Economics (M4 India/Brazil M2 China)
India also has some cyclical headwinds that has seen the market edging down growth forecasts (here), with the RBI set to gradually ease further. However, we believe the structural situation remains the best among big EM economies. High real GDP growth helps absorb the population dividend and drive employment growth, while inflation is not too high. This all mean low double digit nominal GDP, with M4 growth is still consistent with this picture (Figure 2). Household and corporate debt (Figure 3 and 4) could rise at a modestly faster pace than nominal GDP in the next 5 years decade, without causing balance sheet problems. In turn the nominal GDP trajectory means that expansive fiscal policy does not really push up the government debt/GDP trajectory. We envisage India eventually needs to make land reform progress, and increase the low female participation to sustain high growth into the 2030’s, but the structural tailwinds are still good this decade. Our 2025 and 2026 GDP growth outlook are 6.5% and 6.6%, respectively and while some risks exist around these forecasts, they are modest rather than large. India remains our favorite equity market for the remainder of 2025 and 2026 (here).
Figure 3: Household Debt/GDP in Selected Big EM’s (%)

Source: BIS/Continuum Economics
Figure 4: Corporate Debt/GDP in Selected Big EM’s (%)

Source: BIS/Continuum Economics
Finally, we think Brazil is starting to lose momentum, as the BCB swings to a really restrictive interest rate starts to feedthrough. However, credit growth (Figure 2) shows that the structural credit cycle (here) is not over and this argues against a hard landing, as does the prospect of fiscal stimulation before the October 2026 election. Brazil households and corporate debt/GDP ratio (Figure 4) are not at levels that would likely cause major credit constraints. We forecast 2.0% for 2025 real GDP growth. With inflation forecasts still above the BCB target, easing is unlikely until 2026, and this will reinforce the cyclical slowdown into 2026.
Brazil structural problem is the high level of general government debt/GDP, with the IMF measure at 92% of GDP, which is estimated to hit 99% by 2030. Debt servicing costs are so large that the government needs to increase the primary surplus to even try to stabilize the government debt/GDP ratio. This is hard to increase the primary surplus with extra taxes as government revenue to GDP is already high by EM standards at 39%, which means spending cuts, and we believe this is politically difficult. Domestic players are concerned and forcing the government to pay high real rates to ensure rollover of debt, but the situation is unlikely to significantly worsen or improve before the election. Fiscal policy action will however come into sharp focus after the October 2026 election.