DM Rates: Steeper Yield Curves: More to Come?
Steeper yield curves are a function of monetary easing cycles, budget deficits, lower central bank holdings of government bonds, a move towards pre GFC real rates and shifting demand from pensions funds and life insurance companies. Scope exists for further steepening in the U.S., EZ and UK with more easing likely to be delivered in the next 12 months, but this could become a bumpier process if the U.S. slowdown turns from a soft landing to a hard landing that causes a drop in long-dated bond yields.
Figure 1: 30 and 2yr U.S. Treasury Yields (%)
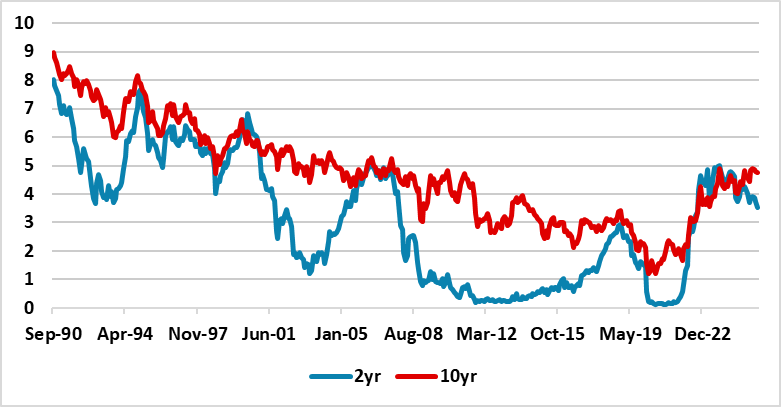
Source: Datastream/Continuum Economics
It usual for government bond yield curves to steepen during easing, with a sharp fall in 2yr yields and 10 and 30yr yields seeing less of a fall (Figure 1 and 2 for the U.S.). However, 30yr yields have seemed elevated this year until the drop over the last week. What are the driving factors and what will happen in the next 12 months?
Figure 2: 30-2yr U.S. Treasury Yield Curve (%) 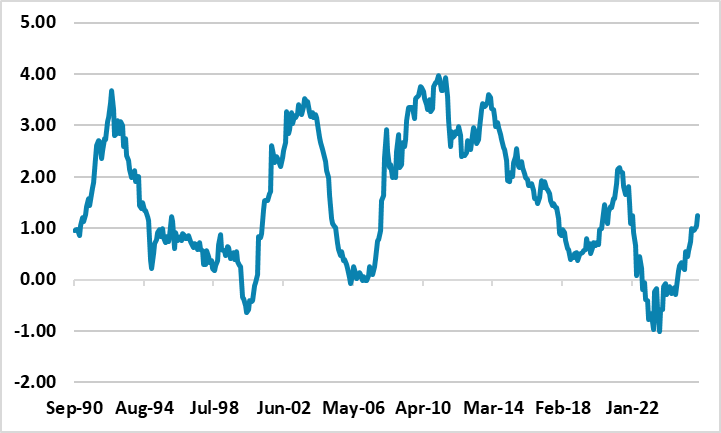 Source: Datastream/Continuum Economics
• More easing. We see the Fed cutting in September/December and three more 25bps cuts in 2026. Meanwhile, we are non-consensus in forecasting a further 50bps of ECB easing by spring 2026 and 75bps of BOE easing by summer 2026, though perhaps not consistently with quarterly monetary policy reports. This should all help traditional yield curve steepening (Figure 3) – we see 10-2yr U.S. to 100bps by H1 2026. Though we forecast two further 25bps BOJ hikes before pausing, the JGB curve is not seeing bearish yield curve flattening due to the low level of JGB real yields and aggressive BOJ QT (see below) and (here).
Figure 3: 10-2yr U.S. Treasury and Fed Funds Inverted (%)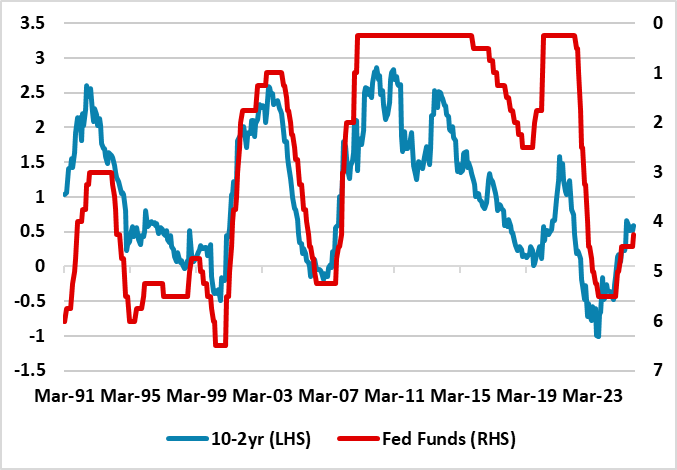 Source: Datastream/Continuum Economics
• Budget deficits. The U.S. continues to run larger budget deficit than other DM countries, both due to voters’ resistance to higher taxes and congressional reluctance to upset voters. The CBO however estimates USD4trn of tariff revenues, which should limit the budget deficit in 2026 to around 5.5%! Though EZ and UK are following a multi-year fiscal consolidation path, bond investors are concerned that voters are reluctant to see real expenditure reined in, r entitlement cuts or to accept extra taxes. In France and the UK this is causing difficulties in meeting fiscal rules. Finally, the resignation of PM Ishiba (here) likely herald a laxer fiscal policy stance to rebuild voters support for the LDP.
• Lower government bond holdings by central banks. Government bond yields are higher due to ongoing heavy QT in EZ, UK and Japan. We forecast a 25% cut in ECB QT in the next 12 months, a shift to £75bln in BOE QT and gross JGB bond buying slowdown ending at Y2500bln pm in June 2026. It is worth mention that with massive maturing JGB holdings that net QT will likely by a huge 6% of GDP in 2026 and far exceeding ECB and BOE (Figure 4). QT does boost bond yields; reducing bank lending and in some cases can cause money markets to be too tight. The Fed already accepts this and has shifted to a tiny U.S. Treasury rundown. Once our 2026 QT estimates are added to budget deficit figures, then EZ/UK and Japan could see the market having to absorb more bonds as a proportion of GDP than in the U.S.
Figure 4: 2026 Budget Deficit and QT to GDP (%)
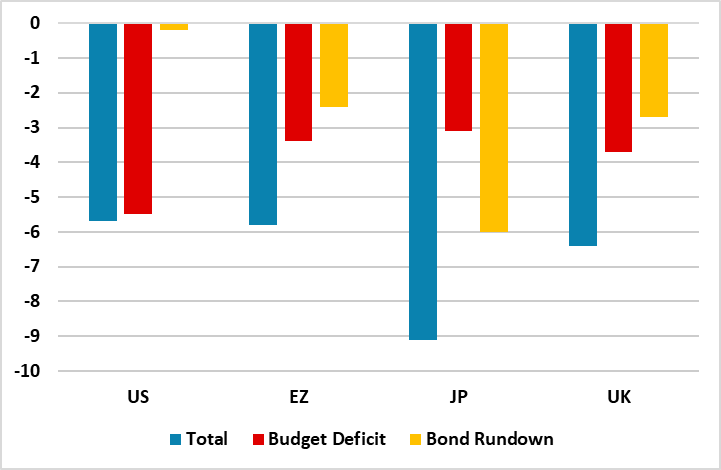
Source: IMF /Continuum Economics
• Pre GFC real yields? A more subtle process is establishing long-run equilibrium 10 to 30yr real yields now that the ultra-low interest rate period has ended. Though most of this occurred in 2021-22 with post COVID tightening cycles, some investors were locked in and are now demanding higher term premia with higher terminal policy rates and also given the fiscal deterioration since 2019. Around 2% U.S. real yields could be the right structural real yield equilibrium if the economy/inflation are on target, but it could be 2.25-2.50%. However, this issue could also be overtaken by cyclical conditions. If the U.S. slowdown turns from soft landing to hard landing and causes a drop in long-dated bond yields, then real and nominal yields could drop – in a mild recession we would forecast 3.50% 10yr yields.
• Pension fund and Life insurance demand. The long-end of the curve in some countries (e.g. Japan and UK) is also suffering from population aging. With more people in or near retirement, asset/liability matching argues for mid-maturity bonds rather than long bonds for domestic pension funds and life insurance companies. This leaves long-dated issuance more dependent on other investors that could demand a higher risk premium e.g. non-residents.
Overall, we see these forces as pointing towards further yield curve steepening 10-2yr and 30-2yr for U.S./EZ/UK in the next 12 months, given our forecast of additional easing. However, this does not mean that 10 and 30yr yields will move up, as 2yr yields move down. 10 and 30yr yields can decline at times, especially if the U.S. soft landing turns into a hard landing and a flight to quality occurs from the overvalued U.S. equity market. Our baseline or alternative harder landing scenario both point to yield curve steepening.
I,Mike Gallagher, the Director of Research declare that the views expressed herein are mine and are clear, fair and not misleading at the time of publication. They have not been influenced by any relationship, either a personal relationship of mine or a relationship of the firm, to any entity described or referred to herein nor to any client of Continuum Economics nor has any inducement been received in relation to those views. I further declare that in the preparation and publication of this report I have at all times followed all relevant Continuum Economics compliance protocols including those reasonably seeking to prevent the receipt or misuse of material non-public information.