Asia/Pacific (ex-China/Japan) Outlook: Slower Trade, Softer Inflation, and Looser Policy
· Asia’s growth profile in 2025 reflects a region navigating structural transition amid external strain. Investment-led economies like India are benefitting from infrastructure spending, industrial policy momentum, and political continuity. In contrast, trade-reliant markets such as Vietnam, South Korea, and Indonesia are increasingly exposed to tariff uncertainty, a slowing global tech cycle, and weaker Chinese demand.
· Domestic demand has become the region’s most consistent growth pillar. However, a full-fledged consumption rebound is being held back by uneven wage dynamics in India, tight credit conditions in Southeast Asia, and persistent household caution. In many markets, the post-pandemic fiscal space has narrowed, forcing a shift toward more selective, efficiency-driven public spending.
· Inflation has broadly moderated, creating room for monetary policy support. India’s disinflation trend has deepened, Indonesia’s CPI is running below target, and Australia’s price pressures are easing faster than expected. However, climate volatility, fuel subsidy shifts, and exchange rate sensitivity present upside risks—especially for food and transport costs. Central banks are adopting front-loaded, data-sensitive easing cycles, but will remain cautious in economies vulnerable to imported inflation or capital flow reversals.
· The external environment remains uncertain and fragmented. Weak Chinese domestic momentum, oil market volatility, and persistent US tariff unpredictability are reshaping trade patterns. India and Malaysia are leveraging industrial upgrading to reposition in global supply chains, while Indonesia’s export profile and external balance are under pressure from energy price shifts and fading trade surpluses. Across the region, 2025–26 will be defined by cautious monetary easing, fiscal recalibration, and growth resilience shaped more by internal policy agility than global tailwinds.
· Forecast changes: Given slowing growth momentum in Q1, we have revised down our growth forecasts for Indonesia and Malaysia. Meanwhile, inflation remains subdued across Asia, which has prompted downward revisions to our inflation forecast for India, Indonesia and Malaysia. Meanwhile, given increased headroom for central banks and slowing real GDP, monetary outlooks have been revised to reflect expectations of front loading of rate cuts.
Our Forecasts
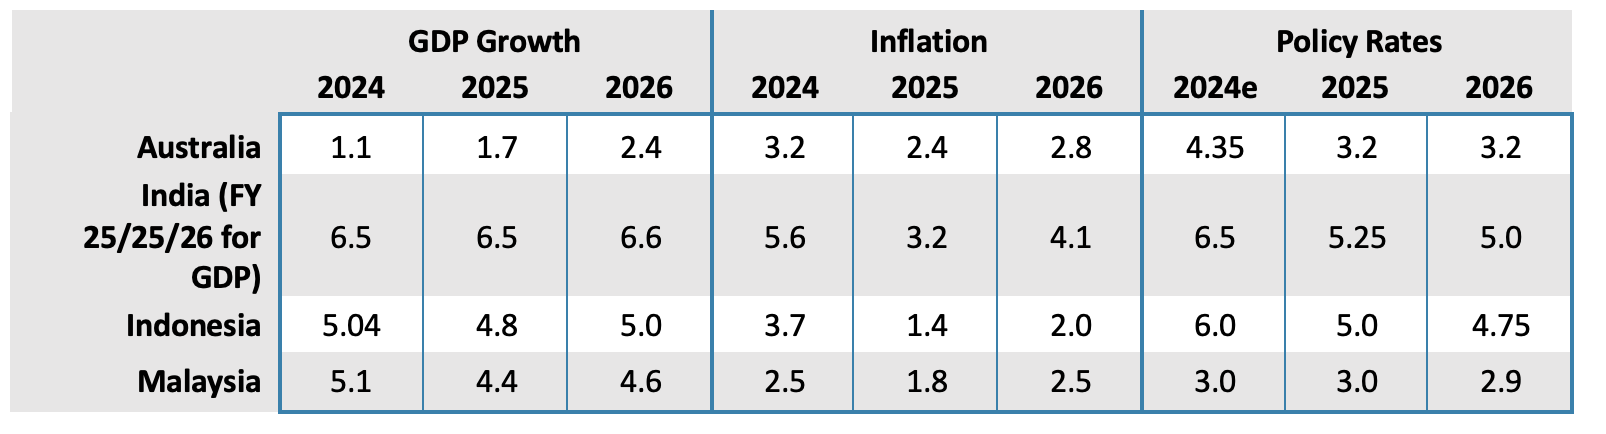
Source: Continuum Economics
Risks to Our Views
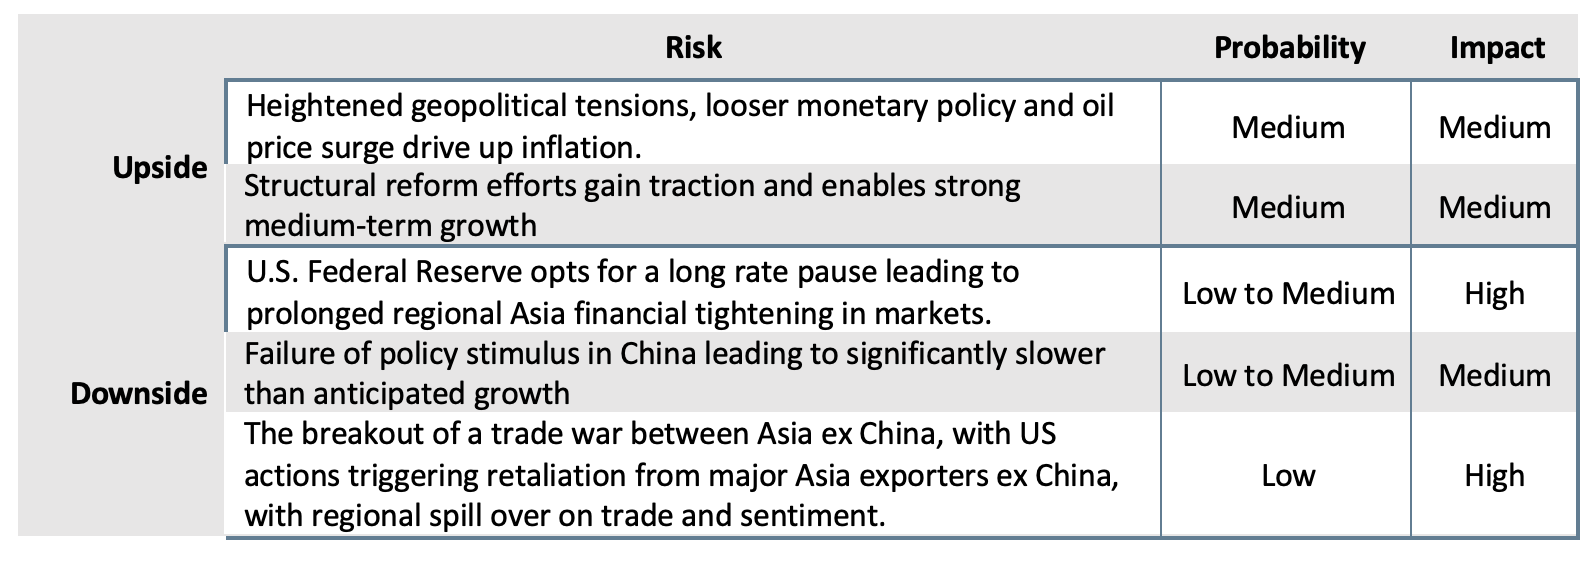
Source: Continuum Economics
Regional Dynamics: Growth Realignment Amid Trade Shocks
Asia is entering 2025 with economic momentum under strain. A cocktail of trade tensions, softening global demand, and policy recalibration is reshaping the region’s macro landscape. While headline growth will remain respectable, the region is now navigating a slower, more uneven cycle marked by cautious consumption, volatile trade flows, and policy fine-tuning.
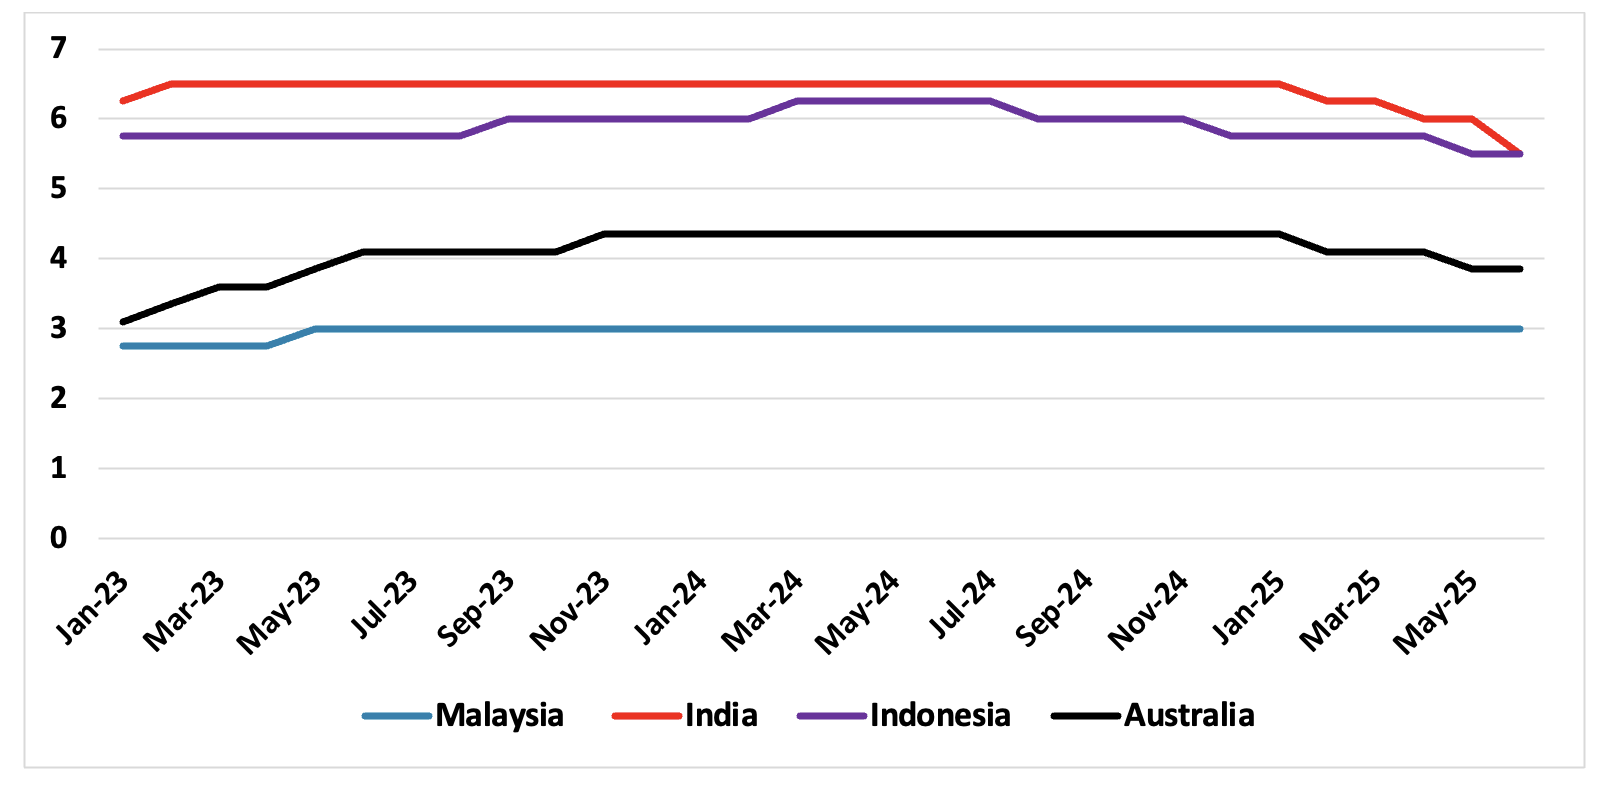
Figure 1: Real GDP Growth Forecast (% yr/yr)
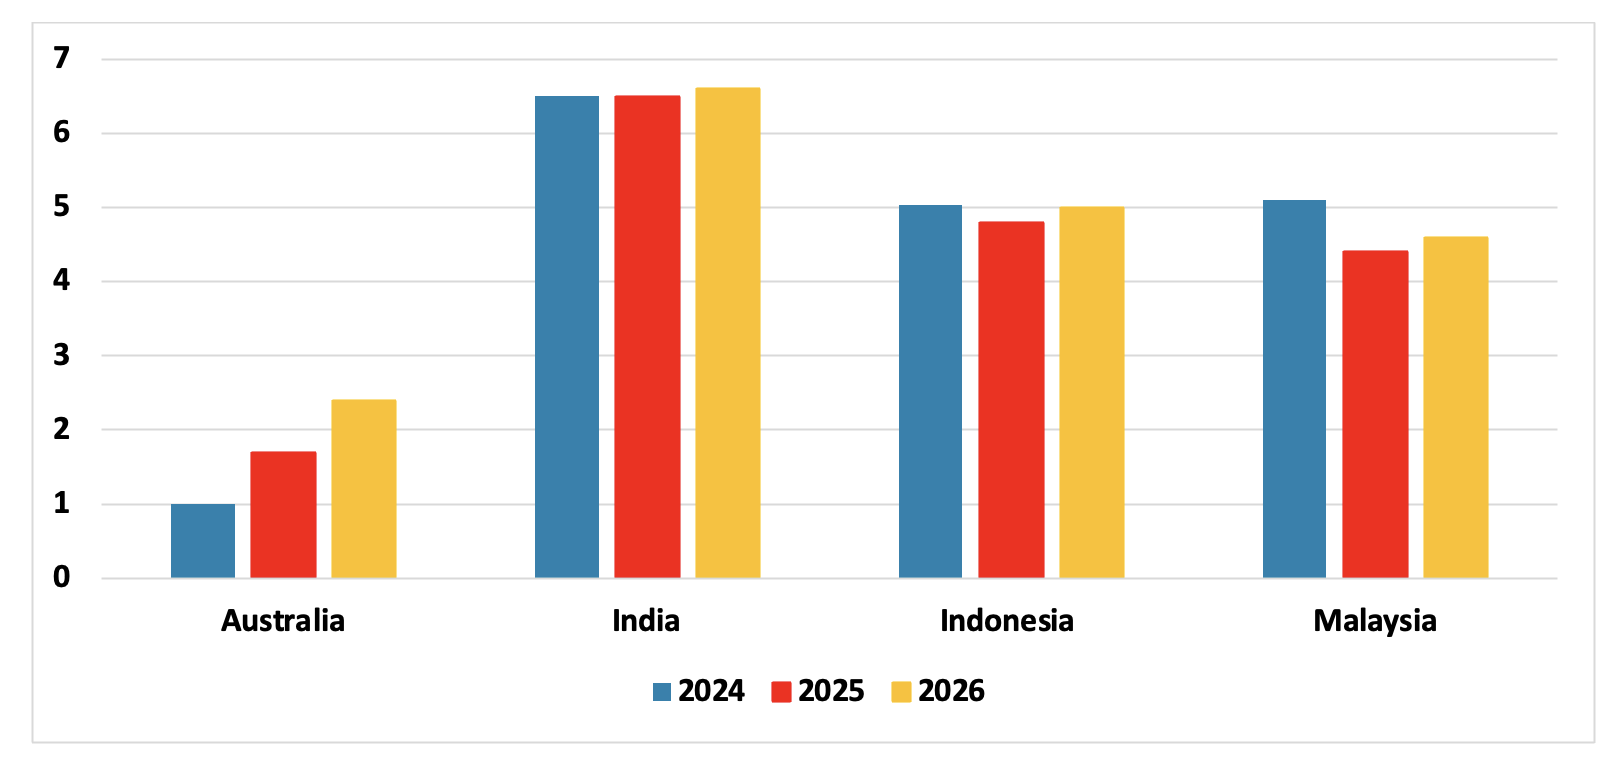
Source: Continuum Economics
Growth: Shifting From External To Domestic Anchors
Asia’s growth story in 2025 is increasingly defined by resilience in domestic engines as global trade volatility deepens. The front-loading of exports in early 2025—aimed at beating tariff deadlines—offered a temporary lift, but the second half will expose the full weight of weak global demand and rising protectionism. In response, countries are leaning more heavily on infrastructure investment, services growth, and local consumption. Industrial policy momentum in South and Southeast Asia, for example, is allowing economies like India and Malaysia to decouple modestly from global cycles. Meanwhile, in more trade-exposed markets like Vietnam and South Korea, growth is adjusting downwards as electronics demand slows and investment decisions become more cautious.
Inflation: Broadly Contained, Selectively Volatile
The inflation narrative across Asia has turned more favourable, but risks remain nuanced. Headline inflation is moderating in much of the region, allowing for policy recalibration. Yet, underlying volatility persists—especially around fuel and food, where climate risks and subsidy reforms are reintroducing uncertainty. Price dynamics are also increasingly localised: India is watching monsoon-linked food prices; Indonesia faces energy-related uncertainty; and Australia is seeing a drop in services inflation driven by rent and insurance that may not be sustained. The common thread is that inflation is no longer the dominant threat—but neither is it entirely subdued. Given the heightened tensions in the Middle East and the impact on global oil prices, the risk to inflation remains titled to the upside.
Figure 2: Asia Inflation Trajectory (% change, yr/yr)
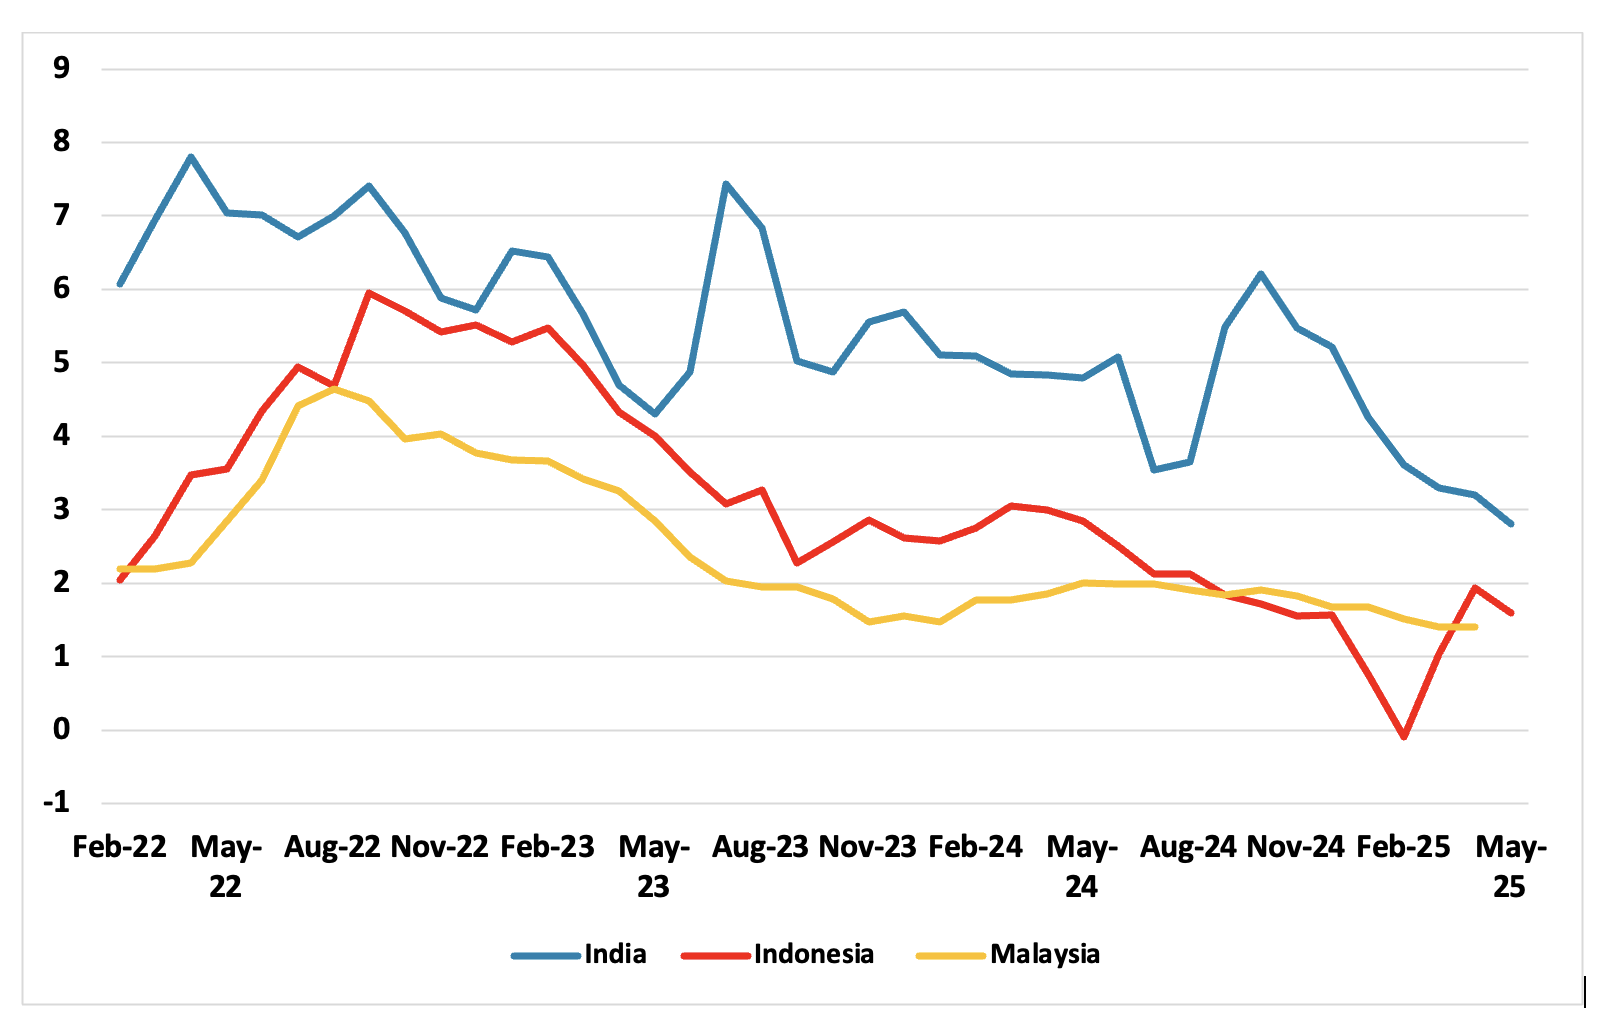
Source: Continuum Economics
Monetary Policy: Easing With Caution
Asia is in a measured easing cycle, shaped by divergent growth needs and persistent currency sensitivities. The shift from inflation control to growth support is evident—but central banks are proceeding carefully. Rate cuts are unfolding faster in economies with strong real sector buffers and stable capital flows. Where currencies are vulnerable or inflation could rebound from reforms (as in parts of ASEAN), the pace of easing is more data-bound. Central banks are increasingly adopting a “cut when you can, pause when you must” approach, making monetary flexibility a key asset in navigating external shocks. Some economies like India are front-loading rate cuts, but Indonesia for instance, remains cautious given currency concerns.
Figure 3: Benchmark Policy Rate (%)
Source: Reserve Bank of India, Bank Indonesia, Reserve Bank of Australia, Bank Negara Malaysia
Public Spending: Reprioritising Within Constraints
Governments across Asia are adjusting their fiscal strategies—not by spending more indiscriminately, but by targeting where it matters. With buffers worn thin by the pandemic, fiscal space is constrained. Still, infrastructure remains a priority, and selected social spending continues where political mandates are strong. India’s ability to balance capex with consolidation, or Indonesia’s drive to fund flagship welfare schemes while watching deficits, reflects a broader trend: fiscal policy is becoming more strategic, not expansive. In advanced markets like Australia, spending is more reactive—tightened earlier but likely to respond if domestic momentum fades.
Trade and Policy Headwinds
US monetary and trade policy shifts, along with strategic industrial realignment, continue to influence capital flows and export positioning. While India and Malaysia face exposure to tightening US trade rules, Australia is temporarily benefiting from China's commodity demand—though China’s muted domestic recovery and property sector overhang temper its regional growth contribution. Across Asia, supply chain diversification and trade reconfiguration are central to economic strategy. As targeted fiscal support, cautious monetary easing, and uneven consumption recovery unfold, Asia’s resilience in 2025–26 will depend on how effectively it adapts to these evolving external shocks—particularly from the US and China. Our baseline view remains that the trade truce between U.S. and China (here) will see a trade deal eventually agreed by Q4 2025 (65% probability), but our two alternative scenarios are for no deal. In terms on other Asian countries, the U.S. negotiations are challenging, but Trump needs to show success and this suggest deals should be done with Japan/India/S Korea and Taiwan over the summer – Vietnam negotiations like China could fail.
India: Inflation Falls, Policy Support Deepens
India’s macroeconomic outlook for 2025 remains robust, even as signs of softening momentum prompt a calibrated policy response. We retain our real GDP growth forecast at 6.5% yr/yr for FY26 (April 2025-March 2026)—aligned with the Reserve Bank of India’s (RBI) latest downward revision—as growth remains broadly supported by public spending, easing inflation and expanding private investment. India will retain its position as one of the world’s fastest-growing large economies over 2025 and 2026, though the quality and composition of growth will remain under close investor scrutiny. While headline growth is strong by global standards, it masks uneven performance across demand drivers and sectors, with consumption—the traditional backbone of the Indian economy—showing signs of fatigue, particularly in urban centres.
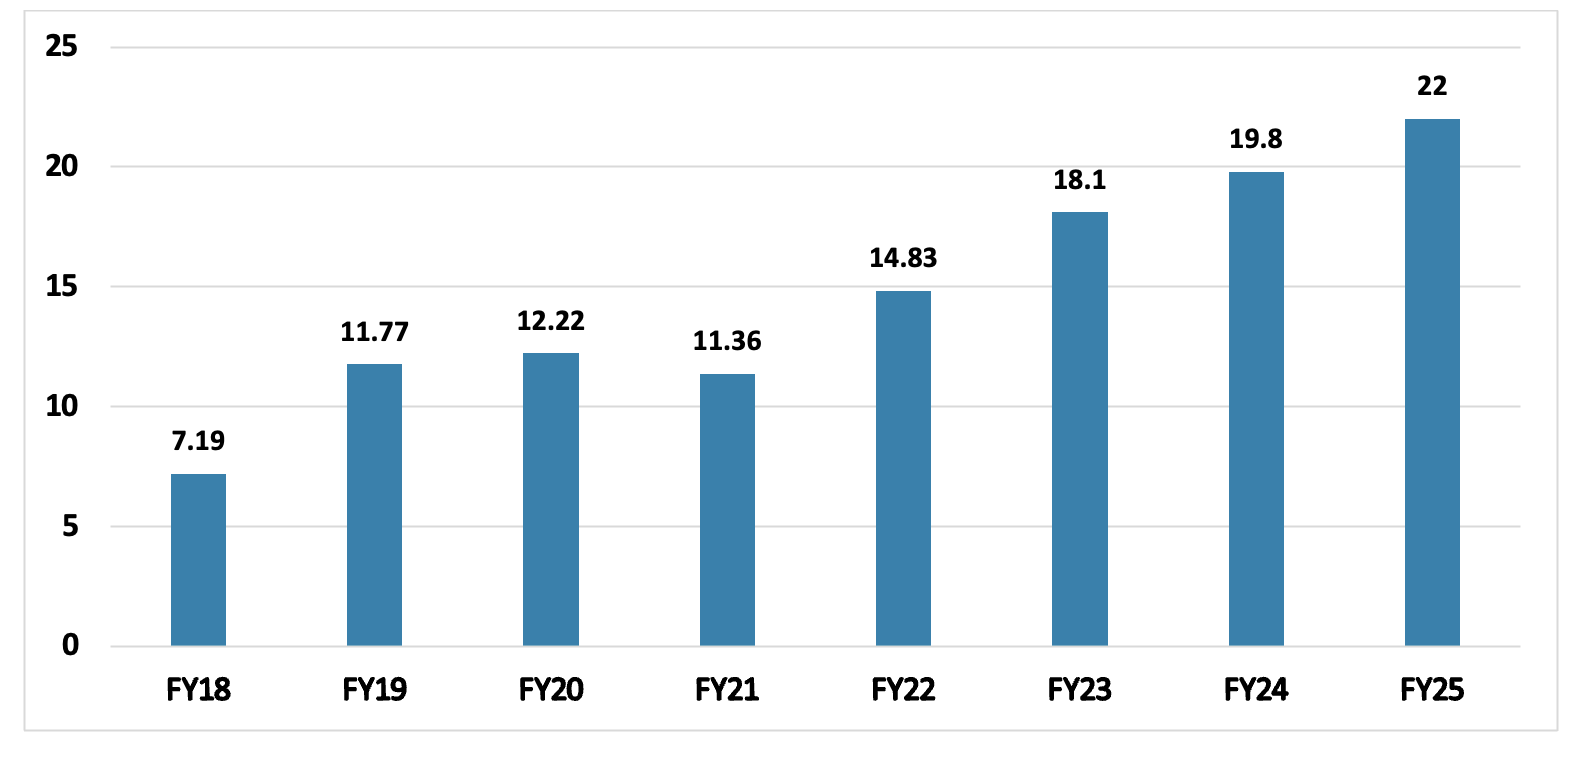
Figure 4: India GDP Forecast (% change, yr/yr)
Source: Continuum Economics
India’s economy grew 7.4% yr/yr in Q4 FY25, with full-year GDP growth coming in at 6.5% yr/yr. The latest quarterly print revealed signs of a broad-based recovery: construction, financial services, and public administration all posted strong gains, while agriculture rebounded and private consumption rose 6% yr/yr. However, underlying dynamics suggest continued dependence on government expenditure and a still-fragile private investment cycle. Notably, fixed capital formation rose 9.4% in Q4, but indicators such as slowing industrial output and uneven manufacturing gains point to a tentative private sector recovery. Industrial production rose just 2.7% y/y in April—its slowest pace in several months—dragged by weak basic metals, chemicals, and refined petroleum. Further, rural consumption appears to be strengthening while urban remains subdued.
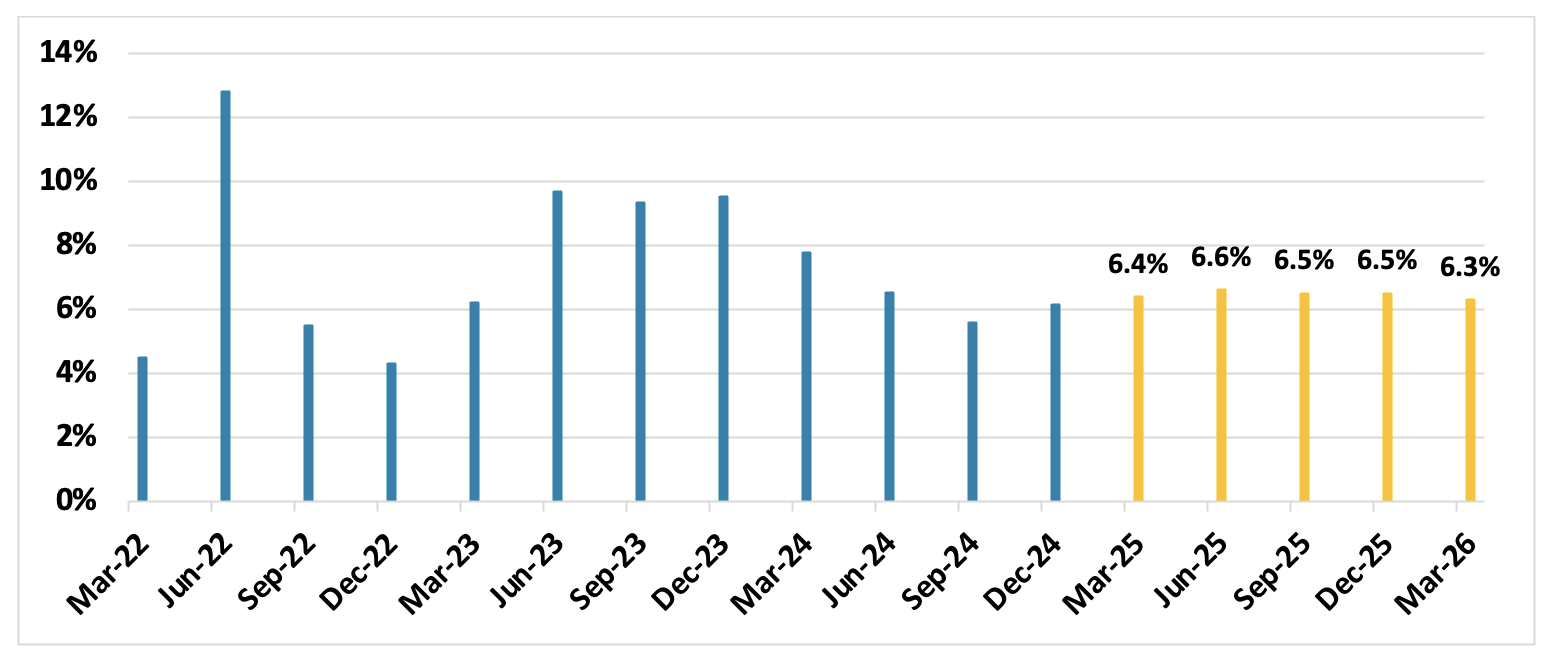
Figure 5: India Goods and Services Tax Collection (INR tn)
Source: Ministry of Finance, Continuum Economics
GST collections remain robust—up 16.4% y/y in May—reflecting broad-based domestic activity. Services activity, particularly in IT, telecom, and financial services, continues to drive output and job creation. Meanwhile, Foxconn’s USD 1.5bn display factory announcement underlines the growing role of electronics manufacturing in India’s investment story. The move supports a rising trend of China+1 diversification, even amid global trade tensions. Negotiations with the US on tariff resolution are reportedly progressing, with a first-phase deal likely by July. If successful, this could pre-empt broader export disruptions later in the year. Still, trade tensions and Middle East geopolitical risks remain key downside risks to India’s external position. The external environment will continue to influence export demand, portfolio flows, and rupee stability.
India’s recent military campaign—Operation Sindoor—highlighted a growing emphasis on indigenous defence capability. The successful deployment of domestically designed defence systems and missiles will likely prompt greater investment in defence manufacturing, supported by Make in India and PLI schemes. The government is expected to ramp up both defence spending and production in FY26, creating tailwinds for the industrial sector. Separately, the Asian Development Bank’s USD 10bn urban infrastructure initiative will support metro, rapid transit, and water projects. This complements India’s own push toward housing, transportation, and urban services, providing a strong medium-term multiplier on growth and employment.
Private investment also shows tentative signs of traction. Capital goods imports, bank credit growth, and strategic FDI announcements point to a gradual recovery. However, weak global capex appetite, trade-related uncertainty, and still-moderate consumer sentiment will keep the recovery uneven. On the fiscal side, India’s position has strengthened. The FY25 fiscal deficit came in at 4.7% of GDP, slightly better than revised estimates. The large RBI dividend provides the government with headroom for either deficit reduction or growth-supportive spending in H2. We expect a mix of both: the government is likely to allocate some of the windfall toward infrastructure and subsidy support in light of evolving geopolitical and weather-related risks.
Figure 6: India Inflation and Policy Rate Trajectory (%)
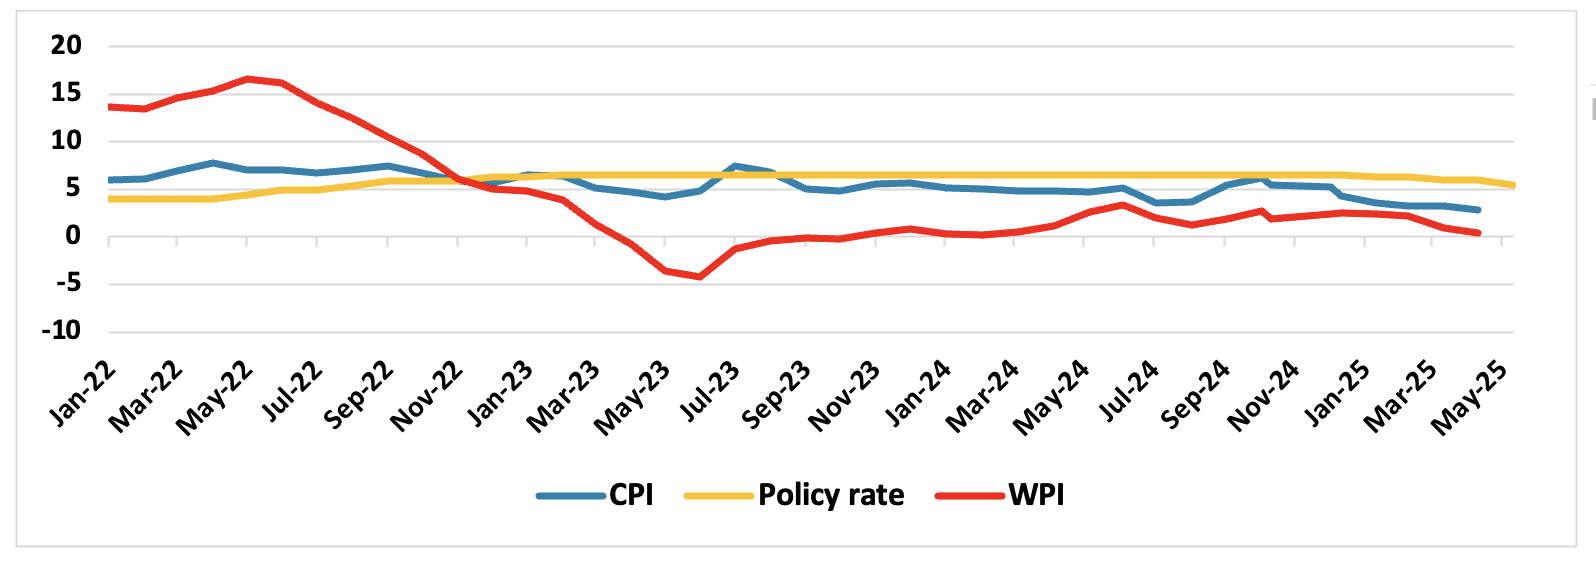
Source: Continuum Economics
On inflation, we sharply revise our forecast lower, with headline CPI expected to average around 3.2% yr/yr in 2025, reflecting a favourable monsoon and steep correction in food prices. India’s consumer inflation fell to a six-year low of 2.82% yr/yr in May (here), marking the fourth consecutive month below the RBI’s 4% target. Food inflation moderated sharply to just 0.99% y/y, led by double-digit declines in vegetables. Urban and rural inflation prints also eased, supporting a broader disinflation trend. With monsoon rains arriving early and the India Meteorological Department forecasting above-average rainfall (106% of the long-period average), the agricultural outlook is bright. The RBI expects improved kharif sowing and strong reservoir levels to suppress food price risks through H2. Upside risks remain from uneven rainfall distribution, oil price volatility and potential core inflation pressures, but the current disinflationary environment allows for policy flexibility.
In June, the RBI delivered a surprise 50bps rate cut—its third consecutive since February—bringing the policy rate to 5.5%. The monetary policy stance was also revised to ‘neutral’ from ‘accommodative,’ signalling greater data dependence going forward. The move reflects the central bank’s intent to front-load easing, given early signs of slowing momentum and subdued inflation risks. Our base case is for one final 25bps rate cut in August, followed by a prolonged pause. Liquidity support will also come through the phased reduction in the cash reserve ratio (CRR) by 100bps, which will free up lending resources for banks from September onward. The CRR cut, alongside the INR 2.69tn dividend transfer from the RBI to the government, will help sustain systemic liquidity and fiscal support. The RBI’s policy path for 2026 will depend on external shocks and fiscal conditions, but a further 25bps cuts over that year remains plausible, bringing the repo rate to 5%.
Overall, India remains on track to be the fastest-growing large economy in 2025. With inflation cooling and fiscal buffers improving, policy space is ample to support growth. Risks remain, however. US trade policy, monsoon variability, and geopolitical tensions in the Middle East could weigh on growth.
Indonesia: Bank Indonesia To Watch Growth Signals
Indonesia’s macroeconomic outlook for 2025 has dimmed amid deepening global trade uncertainty, subdued domestic activity, and ongoing fiscal reprioritisation. We now revise our real GDP growth forecast down to 4.8% yr/yr for 2025, from 5% yr/yr, as the impact of weak exports, faltering consumption and a structural shift in public spending weighs on the economic trajectory. Meanwhile, we lower our average inflation forecast for 2025 to 1.5%—the lower bound of Bank Indonesia’s (BI) target range—amid weak price pressures, electricity subsidies, and deflationary risks in select months.
Figure 7: Indonesia Retail Sales (%, LHS) and Consumer Confidence Index (RHS)
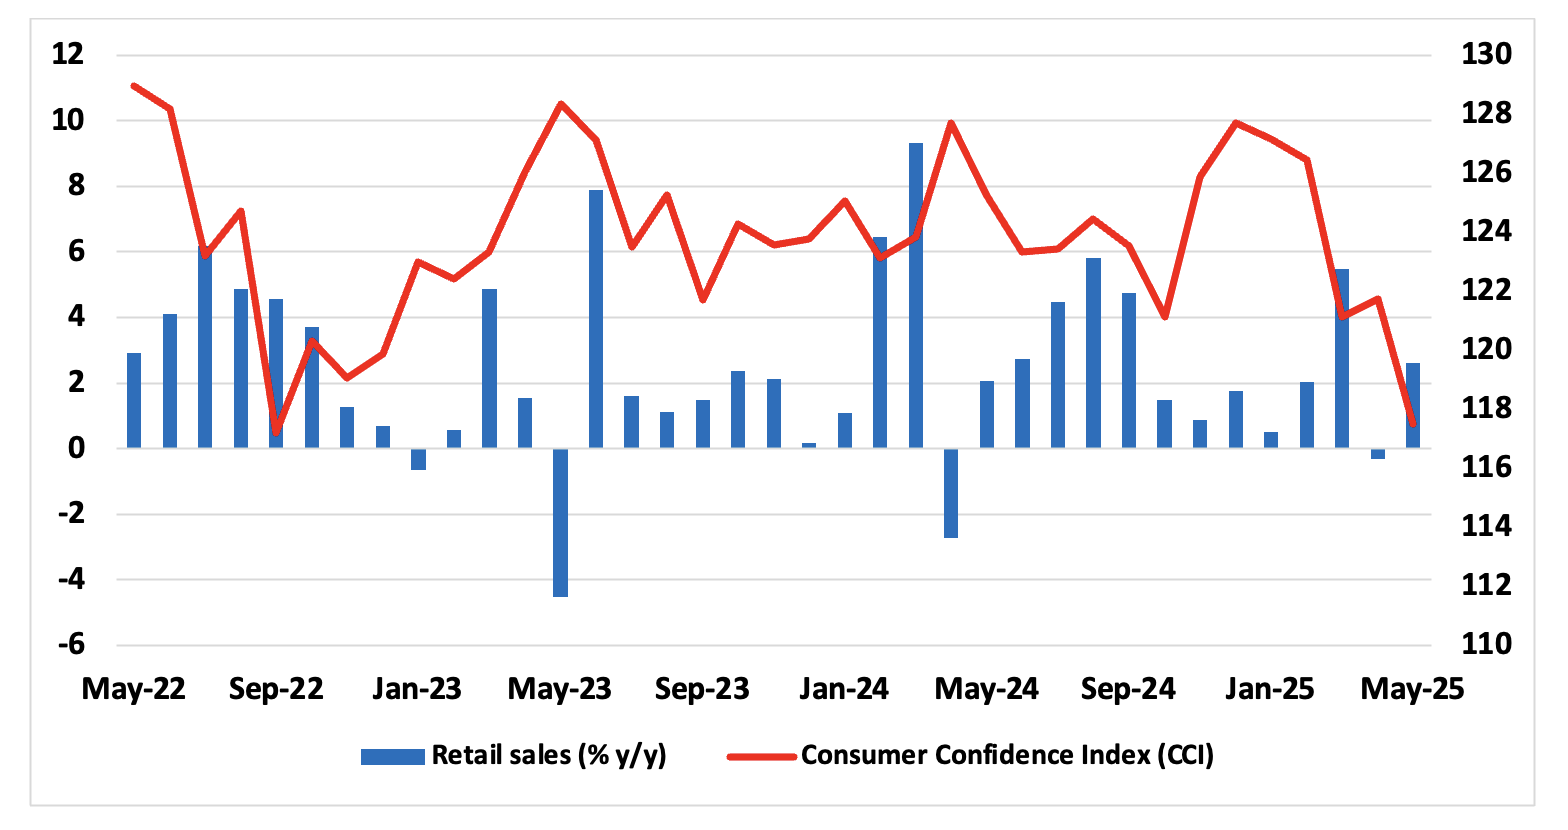
Source: Continuum Economics
Indonesia’s GDP growth fell short in Q1 2025, coming in at 4.9% yr/yr—the slowest pace in over three years. The data effectively unlocked BI’s easing cycle, with a 25bps cut in May to 5.50% following an earlier 25bps reduction in January. The government too has revised its forecast down to 5% from an earlier projection of over 8%. Key indicators reinforce the loss of momentum. Retail sales, vehicle purchases, and purchasing power have softened, while private consumption growth is projected to slow to 4.9% in 2025. Government support, via stimulus worth USD1.5bn in Q2—including transportation discounts, wage support and cash transfers—aims to counteract this drag. However, this is unlikely to deliver a meaningful boost, given the magnitude of demand compression and waning employment growth.
Figure 8: Indonesia Real GDP Growth (%)
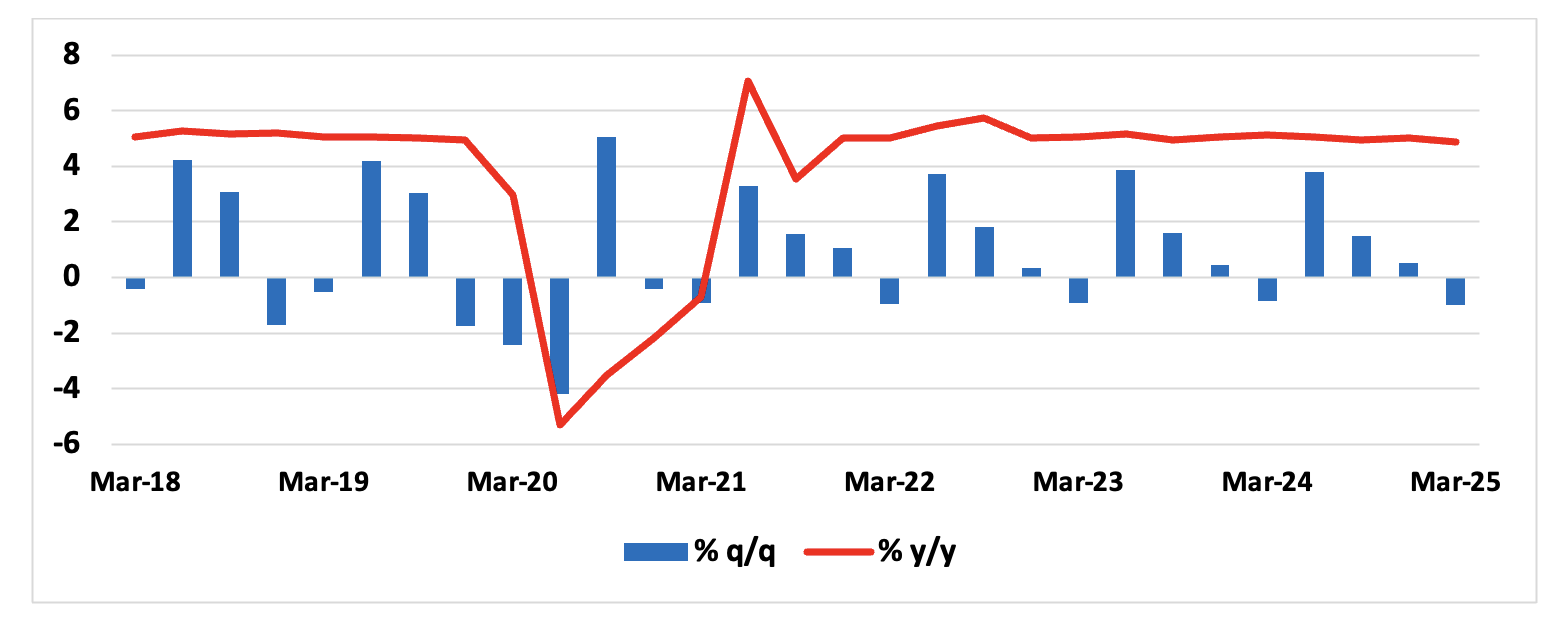
Source: Continuum Economics, Badan Pusat Statistik Indonesia
President Prabowo’s redirection of fiscal resources toward his flagship free meals programme, which is expected to cost USD28bn annually, has further delayed infrastructure spending. While the scheme is intended to stimulate rural economies, the growth payoff is likely to be longer term. In the near term, fixed investment remains uneven, despite some rebound in capital goods imports. Infrastructure outlays are expected to gain ground only in the latter part of the year. Despite the near-term slowdown, investment in strategic sectors remains encouraging. The World Bank’s recent approval of USD2.1bn in blended finance packages will catalyse financial sector reforms, clean energy expansion, and infrastructure financing—supporting medium-term growth.
Indonesia is also beginning to benefit from its downstream industrial strategy, especially in battery and EV sectors. The Hyundai battery plant inauguration and incoming Chinese investments (e.g., BYD’s factory slated for early 2026) position the country well in the global energy transition. However, delays in Nusantara’s development and constraints in skilled labour will continue to impede scale-up across sectors. Indonesia will also face growing difficulty attracting labour-intensive FDI relative to peers like Vietnam.
Figure 9: Indonesia Balance of Payments (USD bn)
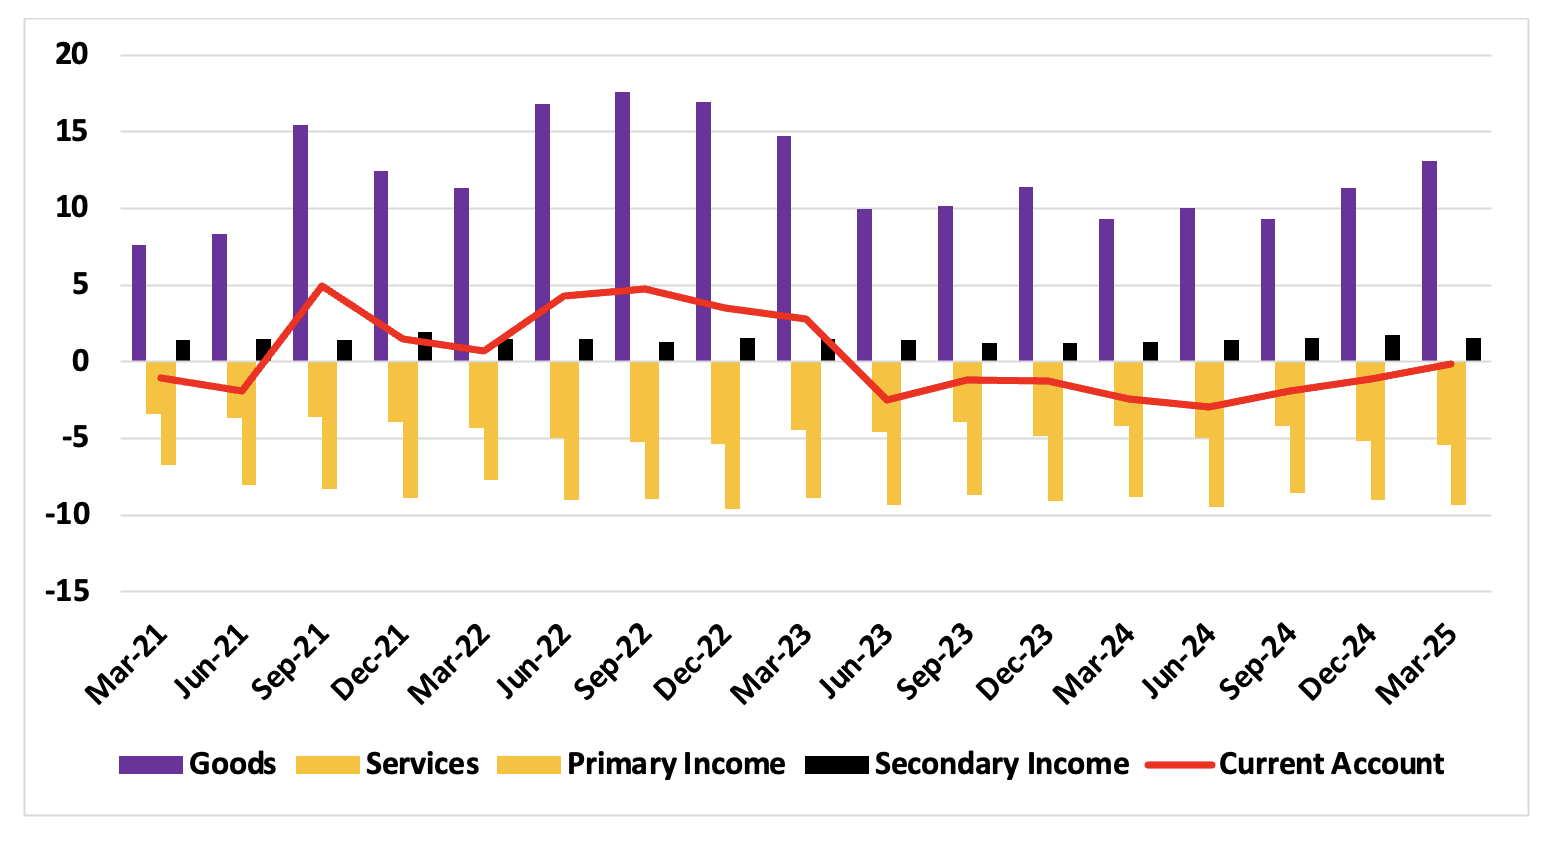
Source: Continuum Economics, Bank Indonesia
Indonesia’s trade surplus collapsed to USD159mn in April 2025—its lowest in five years—down sharply from USD 4.3bn in March, reflecting a step-change in trade dynamics. While headline export growth appeared resilient at 5.8% yr/yr in April, this masks a 5% m/m contraction—the fourth in five months. In volume terms, non-oil and gas shipments have declined by 12.9% since December, led by falling demand from China. Nominal exports to China account for nearly half of the overall export drop so far this year. Additional pressure stems from paused but persistent US tariff threats, which undermine Indonesia’s competitiveness and disrupt demand patterns via China’s supply chains. At the same time, there are pockets of optimism. Imports of capital goods surged to an all-time high in April, rising 36.3% yr/yr and 8.3% m/m (seasonally adjusted). This suggests a rebound in investment activity in Q2 after a poor Q1 showing. Real imports of consumer goods are also recovering, albeit from a low base. This import profile supports the view that the Q1 investment weakness was a temporary blip, though external demand headwinds will continue to cap export growth through the rest of 2025.
Figure 10: Indonesia Inflation, Core Inflation and Main Policy Rate (%)
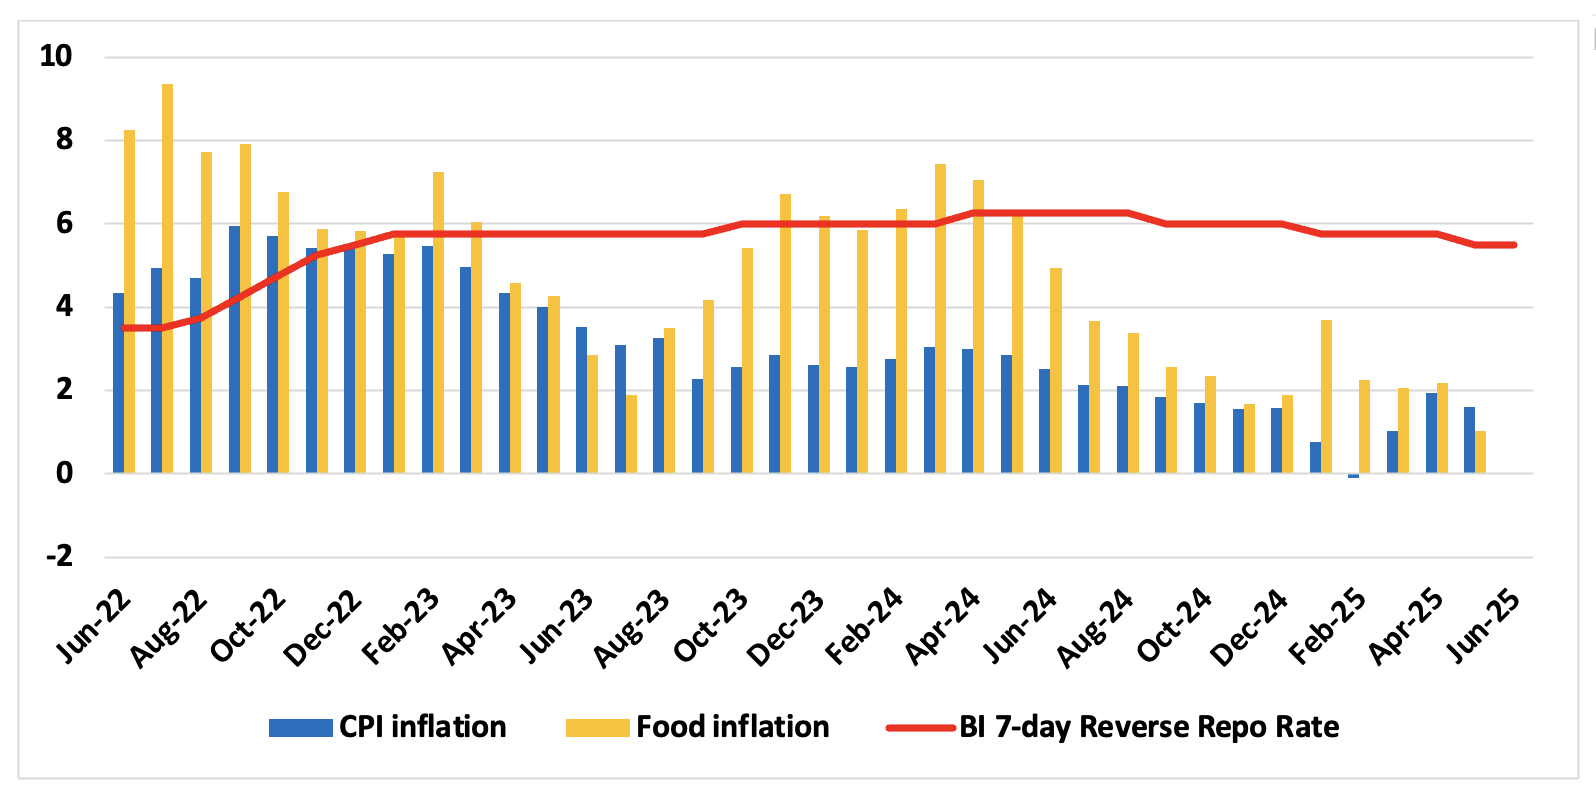
Source: Continuum Economics
With headline inflation likely to undershoot the lower bound of the 1.5–3.5% target range in mid-2025—due to electricity subsidies and disinflation in services—BI has room to continue easing. Inflation will remain muted, supporting accommodative policy, but the rupiah’s weakness will remain a key variable to watch. Further, given expectations of subdued private consumption, inflation will average 1.4% yr/yr in 2025. We expect two more cuts in H2, taking the policy rate to 5% by end-2025. BI maintained the interest rate at 5.5% in June, but highlighted that it would monitor the data for further cuts. Consequently, in our view, if the rupiah stabilises, BI could cut interest rates early into H2. Beyond 2025, we expect BI to reduce the policy rate gradually to a 4.75% over the medium term, balancing currency, inflation and growth priorities. It is noteworthy that BI’s growth-biased stance has become clearer in recent statements, with Governor Perry Warjiyo acknowledging the need for further stimulus to support domestic activity. Real rates remain above long-run averages, giving the bank ample space to move.
Australia: Slow Cuts to Come
The RBA cut by another 25bps in the May meeting to 3.85% and is expected to bring rates to 3.2% before end 2026. Domestic demand contributes positively towards growth (0.2% for GDP) as headline inflation treads lower while real wage stays positive. However, Australian consumers are still saving more than spending as we see the household saving ratio rising to 5.2%. Australia’s labour market remains solid with participation rate at historical high and unemployment rate at 4.1%. Wage price index y/y has however moderated and will tread lower alongside the GDP slowdown caused by the slowdown of the global economy into H2 and lagged feedthrough of previous tightening.
Real wages are forecast to be in positive territory throughout 2025/26 and should support more recovery in private consumption in 2025/26. The recovery in household consumption is welcome but still warrants caution as we see a higher saving rate. It indicates Australian consumers are still cautious to consume at higher prices levels that have occurred over the past few years. While household spending grew by 0.4% y/y, it was dominated by energy prices. Discretionary spending remains slow. Public spending contracted for the first time since Q3 2017 after a jump in Q1 2025 (reduced energy rebate). The stronger Australian exports are also neutralized by higher imports. Industrial commodity demand from China has been strong, so has global demand for other commodities, but could soften as Trump tariffs impact in H2.
The RBA acknowledged headline inflation will tread lower, while underlying inflation is now forecast to be around the midpoint of the target range throughout their outlook. Our central economic forecast is little changed and they believe the Australian economic growth will remain modest in 2025 (1.7%) and pick up its pace in 2026 (2.4%). We forecast headline y/y CPI to tread lower for H1 2025 as households continue to replenish their savings, before CPI rebounds in H2 2025 and we look for 2.4% for the year as a whole. 2026 CPI will likely edge closer to the topside of target range at 2.8%. The headline inflation has fallen more than expected from the drop in service inflation which seems to be mostly driven by rent and insurance cost and this could partially unwind.
The RBA sees much uncertainty in the global outlook with such impact tilting towards softer economy and inflation within the target range. With that in mind, the RBA will likely choose to keep their easing cycle fluid with sensitivity to data. Our central forecast sees two 25bps cut in Q3 2025 and a 15bps cut in Q4 2025 to 3.2%, when they will pause on CPI rebounding towards the high band of target range into 2026. This policy rate is also close to neutral rate estimates.
Malaysia: Steady growth, policy recalibration
Malaysia’s economy is entering 2025 with a stable domestic foundation, but global volatility and tough fiscal choices will shape the trajectory. We have revised our growth forecast down to 4.4% yr/yr as private consumption shows signs of softening and export strength may taper in the second half.
Private consumption is expected to stay resilient, underpinned by wage hikes, civil service salary adjustments, and a strong labour market. In Q1 2025, household spending rose 5% yr/yr, and the retail sector has seen support from policy-led income gains. That said, April’s retail sales growth slowed to 3.4% yr/yr, the weakest since January 2024, and food-related purchases—the bulk of household consumption—expanded just 2.2% yr/yr. This deceleration suggests that the consumption recovery is losing some steam, particularly in discretionary segments.
Looking ahead, we expect spending to hold up modestly but remain below historical averages, constrained by high household debt, a cautious credit environment, and the gradual withdrawal of subsidies. However, festive-related support and tourism recovery will continue to drive services growth. Visitor arrivals, especially from China, are on track to exceed pre-pandemic levels in 2025.
Malaysia’s external sector remains a bright spot for now. Exports jumped 16.4% y/y in April, driven by a surge in electrical and electronics (E&E) shipments (+35.4% y/y). Import volumes of capital goods also spiked, suggesting that the production pipeline remains active and that factory output will stay strong in the first half of the year. But the second half looks more uncertain. Malaysia faces a 24% US reciprocal tariff, which is temporarily paused but may resume in Q3. So far, semiconductors have been excluded—but this remains a key downside risk given the U.S. is still considering semi tariffs.
The government is moving ahead with structural fiscal reforms in 2025, starting with the expanded SST from July 1. The new tax structure applies 5–10% sales tax on non-essentials and raises the services tax from 6% to 8% across key segments like financial services, leasing, and logistics. While officials estimate the impact on inflation at only 0.25pp, industry feedback suggests deeper pass-through effects. Fuel subsidy rationalisation—originally expected mid-year—may now be staggered. A revised plan is likely to target only foreigners and the top 5% of income earners. While this narrows the inflation impact, it still presents upside risk later in the year, particularly for transport and supply-chain linked sectors.
We have revised our 2025 inflation forecast to 1.8%, with upward pressure building into H2. April CPI held steady at 1.4% y/y, but core inflation picked up to 2.0% y/y, led by housing and services costs. Fuel remains subsidised, but prices will likely rise post-reform. Communication prices, a recent deflationary anchor, may also stabilise, removing one of the key drags on headline CPI. Meanwhile, BNM is expected to keep the OPR unchanged at 3%, balancing weak external demand with domestic price risks. We don’t see scope for easing in 2025; if anything, further cuts may only come in 2026 if global demand weakens more than expected. For businesses, 2025 will be a year of navigating shifting cost structures and supply chain recalibrations within an otherwise stable macro environment.