U.S. Equities: Vulnerabilities Remain
We are concerned that valuations remain high and inconsistent with nominal and real government bond yields going into a growth slowdown as tariffs hit the U.S. economy. Our baseline is for the S&P500 to fall to 5000-5200 mid-year before recovering to 5500 by end 2025. The 10yr budget bill is likely to be neutral for the economy, despite all the PR spin. Hopes will rise of a recovery into 2026. In a mild recession scenario (35% probability), the S&P500 could fall to 4500-4750, with the Fed unlikely to cut rates to zero and 10yr bond yields only falling to 3.25%. Unhedged returns could be worse for European investors, where we look for 1.20 on EUR/USD by end 2025.
Figure 1: 12mth Fwd P/E Ratio S&P500 and Inverted 10yr Real Bond Yields (%)
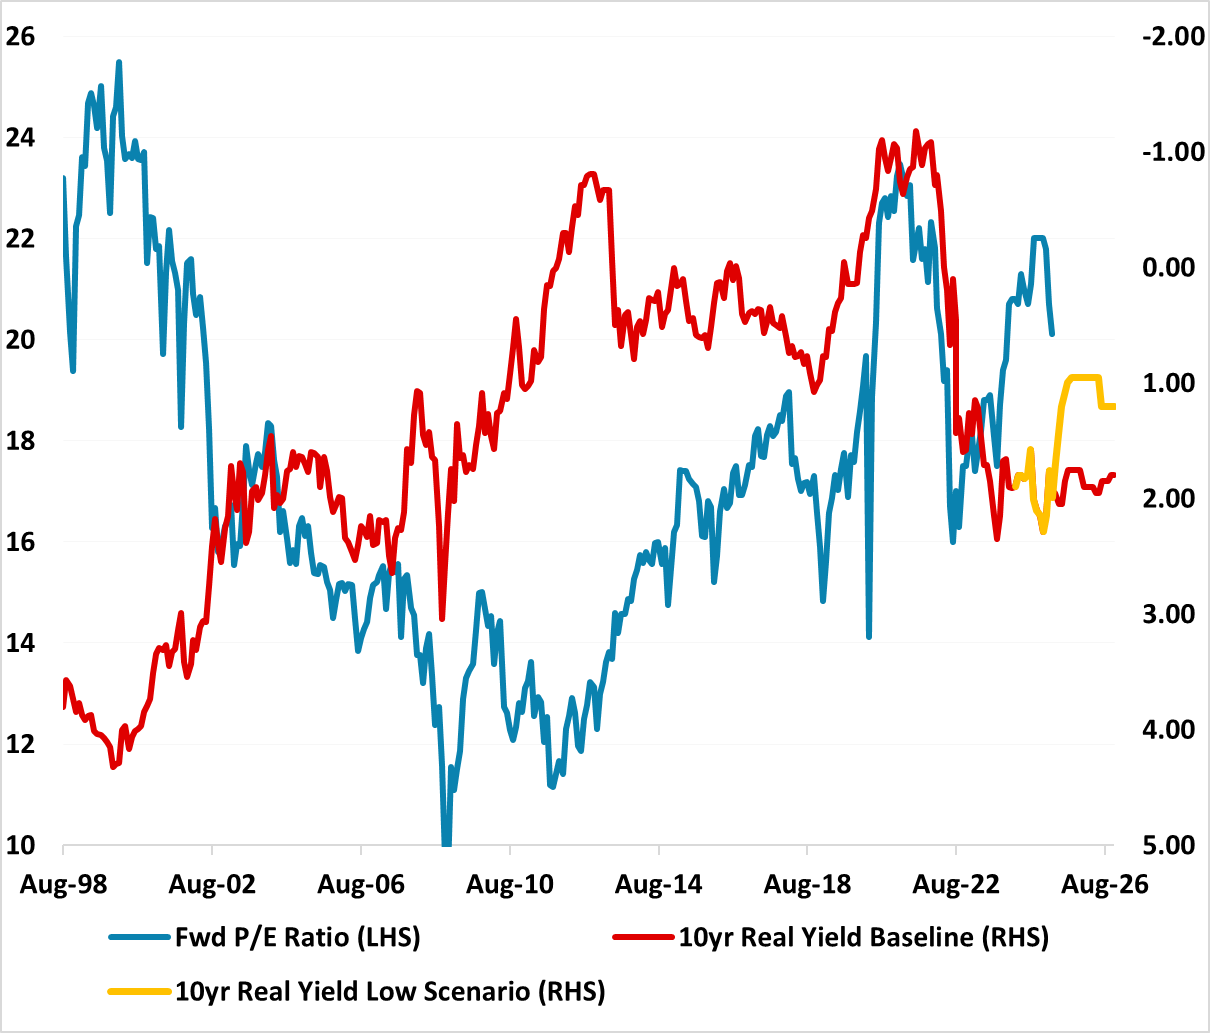
Source: Continuum Economics (using breakeven inflation)
The U.S. equity market has managed to recover to close to the April 2 levels, as the Trump administration has watered down the implemented reciprocal tariffs. We feel that a combination of trade deals in the coming months and a truce with China (with lower tariffs) will likely reduce the effective tariff rate to around 15% (here). While this is less bad news, it is not good news. The U.S. economy will still slow into H2 towards 1% growth and CPI will push above 3%, which will likely keep the Fed cautious and 10yr yields elevated (here). The U.S. equity market resilience is partially due to a combination of continued large buyback programs; ingrained optimism among most domestic players and speculative longs.
We are concerned that valuations remain high and inconsistent with nominal and real government bond yields (Figure 1). However, the difference between slow circa 1% growth and a mild recession is significant in valuation terms. Our baseline is for the S&P500 to fall to 5000-5200 mid-year before recovering to 5500 by end 2025. CE central view is a growth slowdown, which does not produce an earnings recession and allows long-term optimism to remain in the equity market. The mid-year selloff reflects the current overvaluation in what will be a bumpy ride for real sector data in the next three to six months. The magnificent 7 have also had a bigger pull back than the S&P500, which reduces downside risks if this is mid cycle growth slowdown and could restart Tech buying by the market – fwd P/E ratio are below the 5 yr average at 26.8. The lack of an alternative big equity market with Tech or long-term growth also creates inertia among U.S. investors and protects the downside in a soft landing.
However, a mild recession would likely see a fall in a few P/E valuations. 2025 would also face a decline in corporate earnings expectations versus the current consensus of +10% (264 EPS S&P500). Additionally, the March 2001 recession (mild and 8 months) shows that the market can go through a derating in the fwd P/E ratio if the starting point is overvaluation (Figure 2). Could aggressive Fed easing change the valuation picture? The Feb 2020 recession saw rate cuts and QE push 10yr real bond yields from +0.75% to -1% (Figure 1), which helped market valuations to rise in H2 2020 and 2021. However, we would see this as exceptional, as a mild recession is likely to see the Fed cutting to 2-3% Fed Funds rate rather than zero and the odds are also against new QE in this scenario. Additionally, the large U.S. budget deficit, plus a less friendly environment for foreign investors (here), means that U.S. 10yr nominal yields would likely fall to around 3.25% in a mild recession and this would still mean +1% 10yr real yields (yellow line in Figure 1). Could this mean that the 12mth fwd S&P500 fwd P/E ratio falls to 18 rather than 16 in a mild recession? We would probably say yes and based on 2025 and 2026 S&P500 forecasts of 232 and 265 in a mild 2025 recession, this would mean a fall to 4250-4750 in the recession scenario – 35% probability. If corporate buybacks are not cut significantly, then the outcome would likely be closer to 4750.
Figure 2: Fwd P/E Ratio Pre and Post in Last 4 U.S. Recessions (Ratio)
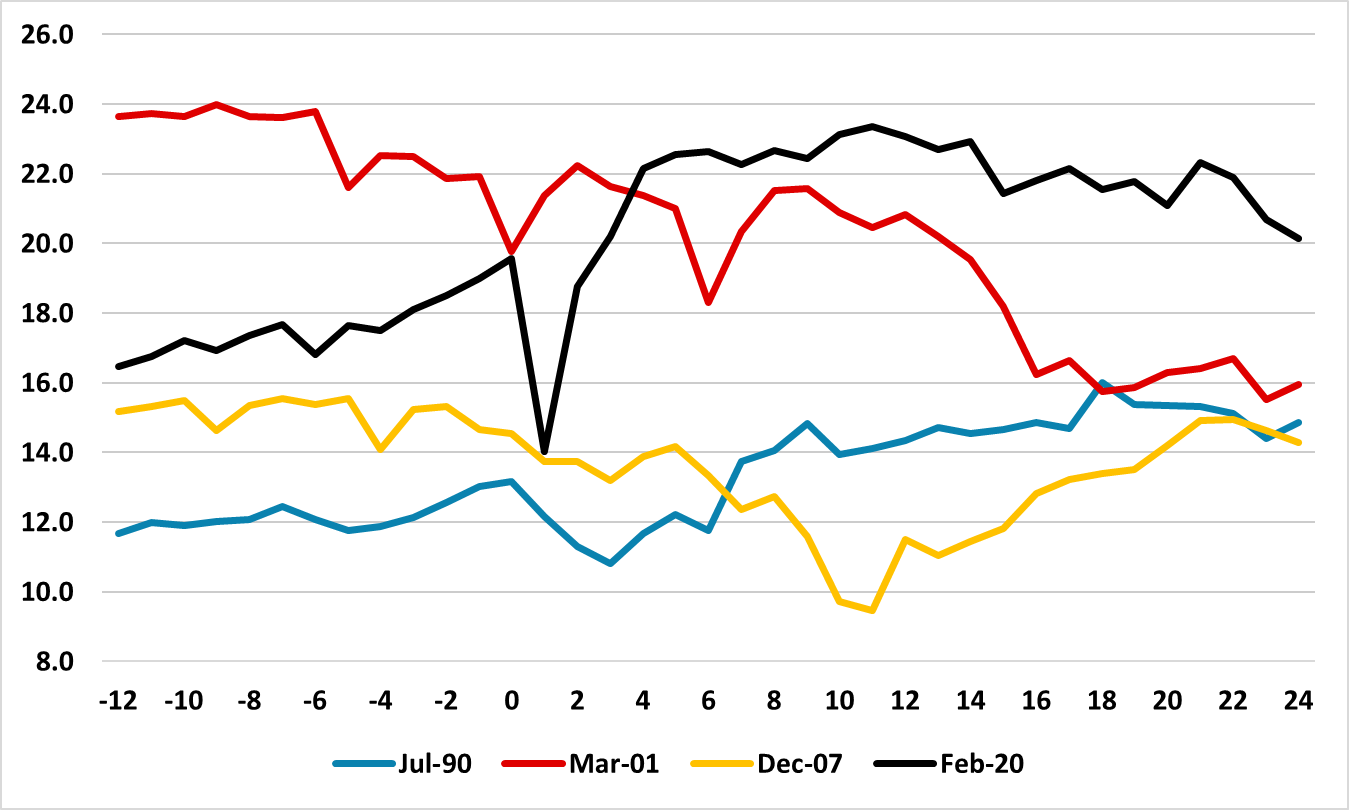
Source: Datastream/Continuum Economics (0 is the start date of recession)
Do foreign investors change the picture, given the concern that this group of investors feels that the period of exceptional U.S. profits is over? Our baseline of 15% effective tariffs, plus no net stimulus from the 10yr budget bill, will likely mean that long-term U.S. profit growth will likely be less than last decade and the return on equity will be lower. The U.S. oil boom will not start with current oil price levels, while extra deregulation effects are uncertain. U.S. companies will see friction from tariffs that squeezes profit margin growth in the next economy recovery. This is not yet discounted by all investors.
Meanwhile, the USD is set to further unwind its overvaluation and we look for 1.20 on EUR/USD end 2025 and 1.25 for end 2026. The last few years have seen a firmer USD and rising U.S. equity market lead to superior total returns in U.S. equities (Figure 3). A weakening USD gets global investors to question whether they should continue new investment at the same pace and whether overweight U.S. equity positions need to be reduced still further into any excessive rallies. A rebound from a weak EUR amplified European investor losses in 2001-03. It is a force to watch, but the EZ and China equity stories are better but not compelling. The critical factor for the U.S. equity market in the next 3-18 months is whether a recession is avoided or occurs.
Figure 3: S&P500 in USD and EUR’s (Index)
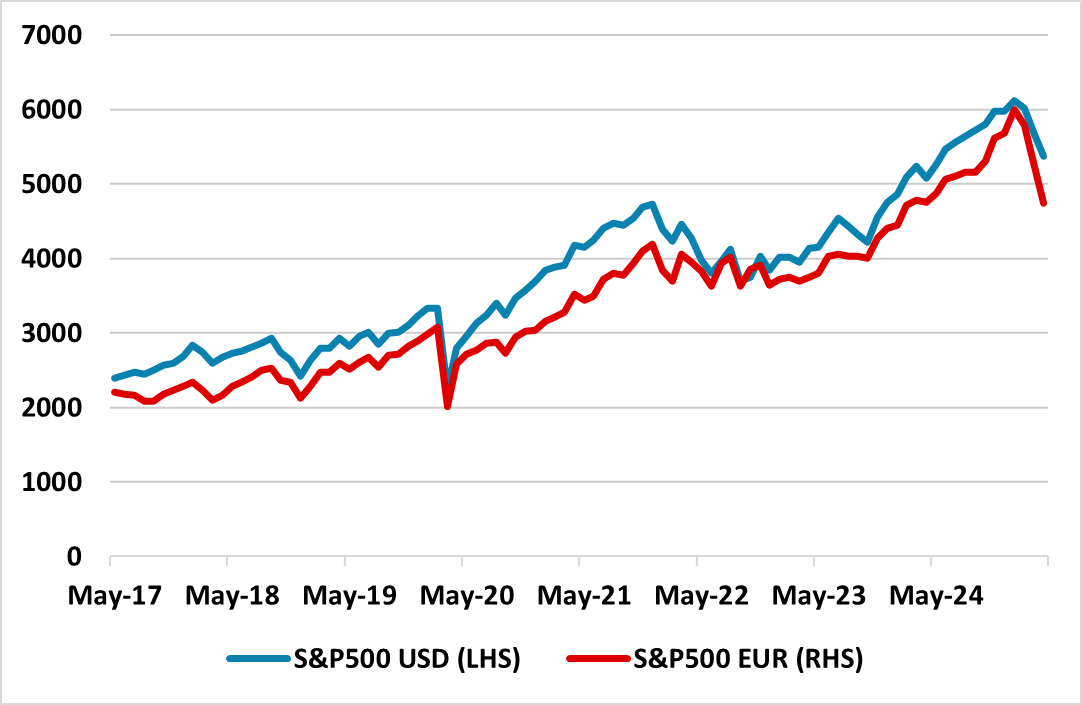
Source: Datastream/Continuum Economics