U.S. Yields Drag Germany and France Higher
The EUR real exchange rate is well above the 2014 low, while ECB officials are guiding that more rate cuts are coming. 2yr German yields are unlikely to rise much further and will likely come back down in Q2 (here). A January 30 ECB cut will likely build more easing expectations, though more of a reset is likely to occur after a further dovish 25bps cut at the March 6 ECB meeting alongside a downgraded 2025 GDP forecast. This will eventually help the 10yr Bund yield to decouple from the U.S.. However, we continue to feel that the bond market jitters can return for France and we look for the 10yr spread against Germany to 100bps by the summer.
Figure 1: 10yr Germany and France Government Bond Yields (%)
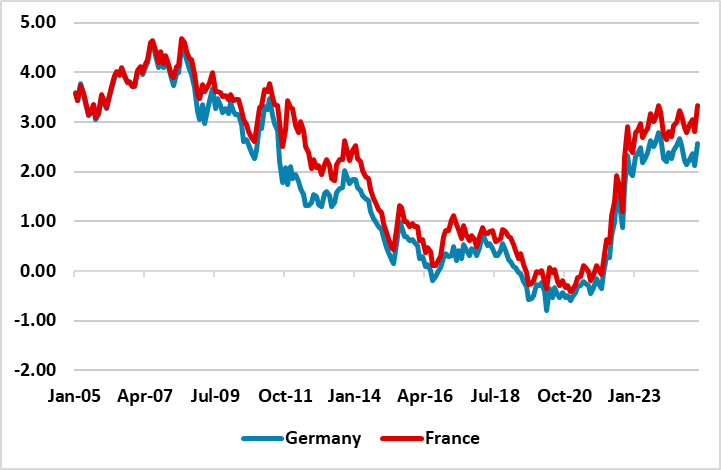
Source: Datastream/Continuum Economics
The rise in U.S. Treasury yields has also spilled over to drag EZ yields higher across the curve, but more noticeably at the long-end. 10yr German yields are now nearly 50bps above the December low (Figure 1), while 10yr French yields have also been pushed higher. This is the normal initial spillover impact of a rise in U.S. Treasury yields. The economy picture has not changed in the EZ. A weak economic recovery is coupled with remaining disinflationary forces that are likely to produce a further decline in Yr/Yr CPI in H2 2025 – see our Eurozone Outlook (here). Though the money market is attaching a 90% probability to a 25bps cut at the January 30 ECB meeting, only 75bps of cuts are now fully discounted for 2025 versus previous thoughts a couple of months ago. The rethink on Fed expectations is causing money and bond markets to scale back easing expectations.
However, the EUR real exchange rate is well above the 2014 lows (Figure 2), as EURUSD is a USD strength story across the board. The EUR TWI does not stop the ECB from undertaking more easing than the Fed at present and we feel it is unlikely to be a constraint in 2025. Secondly, If Donald Trump imposes tariffs on China or the EU directly, then this is a disinflation shock for the EZ. The EU is unlikely to follow the same scale of tariffs as the U.S., which will limit any adverse import price effects but U.S. tariffs will hurt EZ exports and restrain the recovery/enhance disinflationary pressures. Finally, ECB officials in January so far are guided that the Fed do not restrain the ECB (ECB Rehn), policy rates should go to neutral by the summer (ECB Villeroy) and more easing is coming (ECB Lane). A January 30 ECB cut will likely build more easing expectations, though more of a reset is likely to occur after a further dovish 25bps cut at the March 6 ECB meeting alongside a lowered 2025 GDP forecast. 2yr German yields are unlikely to rise much further and will likely come back down in Q2 (here).
Figure 2: EUR Real Effective Exchange Rate
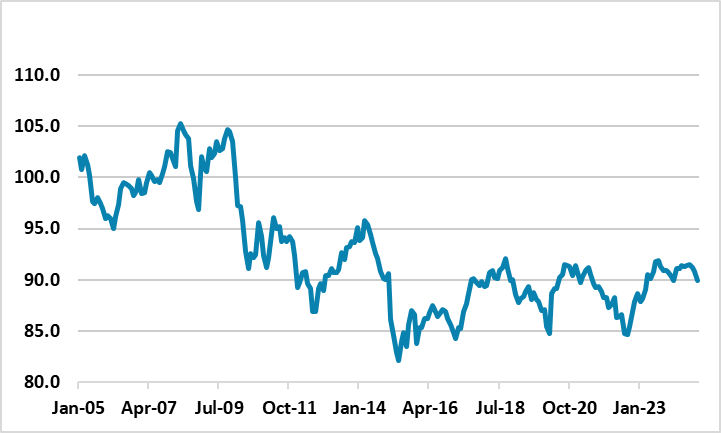
Source: Datastream/Continuum Economics
The 10yr area of the curve is more complicated tactically in Q1, through strategically we see 10yr Bund yields coming back down to 2.30% by end 2025 (here). The competition from 10yr U.S. Treasuries will remain a volatile influence in the coming months. Though U.S. Treasury secretary elect Bessant will seek to soothe U.S. budget deficit worries, President elect Trump could start threatening tariffs after his inauguration and hurt inflation expectations. Additionally, if the Fed signal that the easing cycle needs to pause, then the market could start to fear Fed tightening in 2026 (here). This could mean that the German 10-2yr yield curve (Figure 3) steepens somewhat further in the near-term. The German yield curve was also at times over 100bps in the pre GFC years, which are probably a better point of comparison than post GFC years under QE.
For 10yr France, the budget spotlight will be back on again, with reports that the new PM Bayrou will present a fiscal deficit target of 5.0-5.5% for 2025. The coalition will likely struggle to get this through however and any post July parliament election is unlikely to produce a pro fiscal consolidation budget. We continue to feel that the bond market jitters can return for France and we look for the 10yr spread against Germany to 100bps by the summer.
Figure 3: 10-2yr German Yield Curve (%)
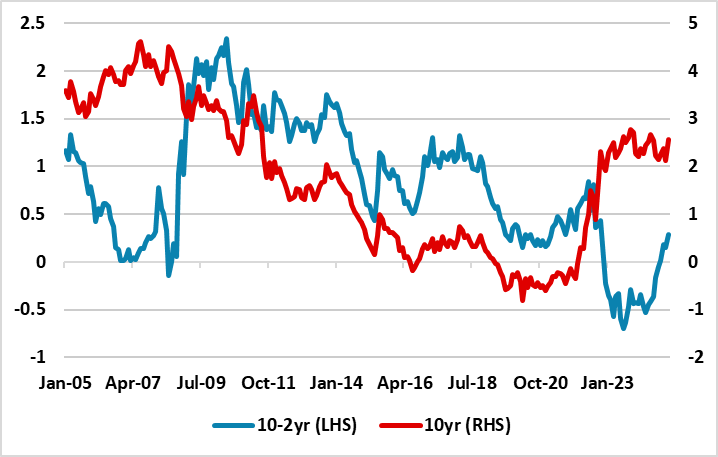
Source: Datastream/Continuum Economics