China Outlook: Cyclical and Structural Headwinds
· Our baseline scenario of a 4-8 week war (here) is not a problem, aside from higher prices. We have pushed up our 2026 CPI forecast to 1.4% from 0.5% (higher food prices are also an issue), but as oil/gas prices come down, this suggests very subdued 2027 inflation, which we have cut from 0.4% to 0.1%. We also trimmed our 2026 GDP forecast by 0.2% to 4.2%, as oil and gas prices remain more elevated than pre-war levels throughout 2026.
· Elsewhere, private domestic demand remains modest, with modest consumption (slowed by the housing wealth hit; soft jobs/wage growth and population aging) and investment impacted by the ongoing adverse drag of the residential property bust. Growth remains supported by AI and high-tech manufacturing, though the positive contribution from net exports will slow in 2026 as countries watch for China dumping of exports. For 2027, we keep the forecast at 4.2%, as we expect further modest fiscal stimulus. Reported GDP could be higher for social and political cohesion reasons.
· China’s authorities feel fiscally constrained by the surge in the general government debt/GDP ratio on the IMF measure. Aggressive fiscal policy is being held in reserve for emergencies. Meanwhile, PBOC remains reluctant to cut interest rates much further, as it could undermine banking system profitability and lending.
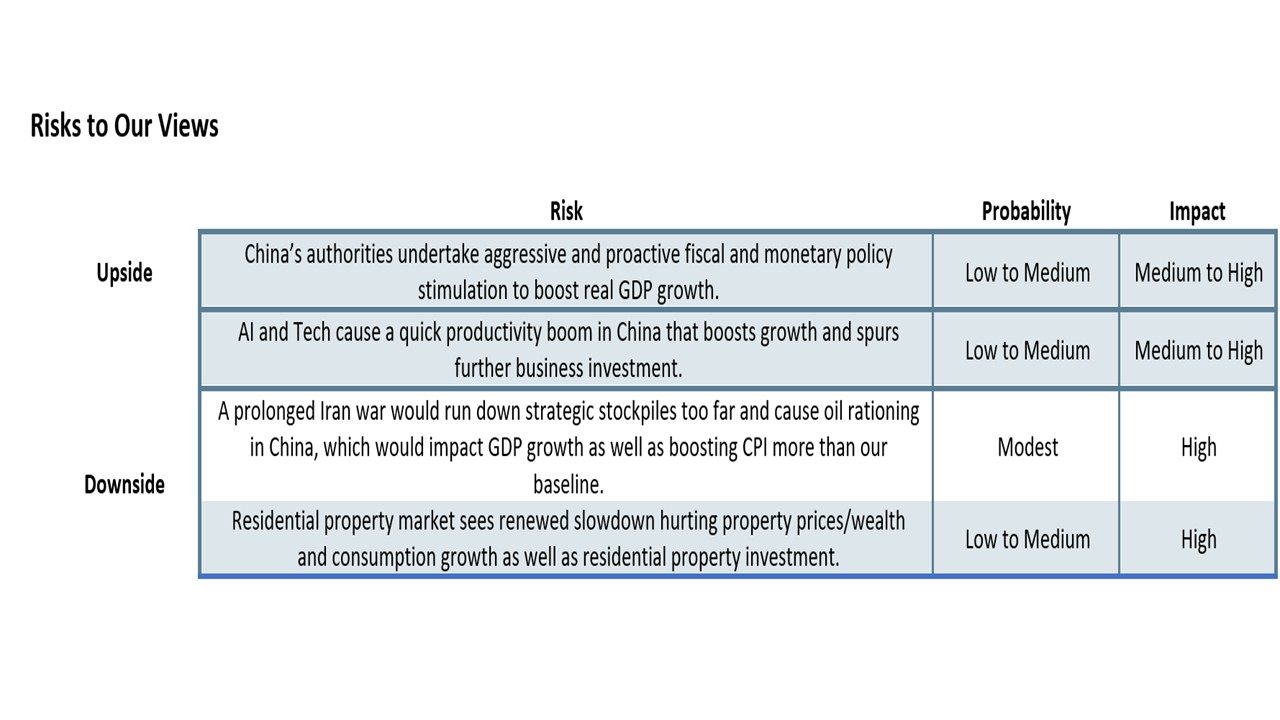
Risks to the Outlook. A prolonged Iran war would run down strategic stockpiles too far and cause oil rationing in China, which would hurt GDP growth as well as boosting CPI more than our baseline. We would not see major 2nd round inflation effects however, given excess production and labor market slack. An invasion of Taiwan/blockade is very high impact, but we still only attach a 5% probability in 2026 and 10% in 2027 to such a high risk Taiwan policy (here).
Our Forecasts
| 2026 | 2027 | ||||||||||
| Q1 | Q2 | Q3 | Q4 | Q1 | Q2 | Q3 | Q4 | 2025 | 2026 | 2027 | |
| Real GDP (%, y/y) | 4.3 | 4.3 | 4.0 | 4.2 | 4.1 | 4.5 | 4.4 | 4.0 | 4.8 | 4.2 | 4.2 |
| CPI (%, y/y, avg) | 1.2 | 1.9 | 1.7 | 0.6 | 0.0 | -0.5 | 0.2 | 0.6 | -0.1 | 1.4 | 0.1 |
| 7-day reverse repo rate (%, eop) | 1.40 | 1.40 | 1.40 | 1.30 | 1.30 | 1.20 | 1.20 | 1.20 | 1.40 | 1.30 | 1.20 |
Source: Continuum Economics
The rebalancing of China’s economy more towards consumption remains a slow process, intermittently facing cyclical and structural forces that drag on growth. Key points to note include:
· Iran war a temporary cyclical hit? China imports 4-5mln barrels per day via the Strait of Hormuz and China buyers can only redirect a portion to other oil producers. This means that commercial and strategic stockpiles will likely be used, but they are a huge 1.2-1.3bln barrels of oil (some estimates are higher). Our baseline of a 4-8 week war (here) is thus not a problem, aside from higher prices with WTI down to USD80-85 by June; USD65-70 end 2026 and USD60 by Q3 2027. We have pushed up our 2026 CPI forecast to 1.4% from 0.5% (higher food prices are also an issue), but as oil/gas prices come down this suggests very subdued 2027 inflation, which we have cut from 0.4% to 0.1% (our forecasts above). However, China is reluctant to run down the strategic oil reserves too much, given the 5yr plan to boost the reserve. Thus a prolonged Iran war would likely see the run-down of the strategic stockpiles being curtailed and cause oil rationing in China, which would adversely impact GDP growth as well as boosting CPI more than our baseline. We would not see major 2nd round inflation effects however, given excess production and labor market slack.
· Modest underlying consumer spending. China’s authorities are trying to improve the consumer spending outlook by cyclical means (including trade in programs) and structural improvement in safety nets (unemployment/health/pensions). However, the scale for 2026 is modest, with the trade in programs Yuan50bln lower than 2025. The structural safety net improvements are also small for a middle income nation, while China authorities have also not taken up IMF suggestions to improve Hukou benefits for 200mln migrants living in urban areas (here). This all likely means that precautionary savings will remain high and not provide a windfall boost to consumption. Without a major government boost to consumption, the consumption growth trajectory will remain modest. Wage growth has slowed noticeably since COVID (Figure 1), while households remain worried about slow employment growth. Additionally, adverse housing wealth effects remain an issue, both impacting consumer sentiment but also seeing households reluctant to borrow (Figure 2). Modest consumption momentum will likely be the story for 2026 and 2027, though still supported by the traditional broadening of services consumption as a middle-income country matures.
Figure 1: China Private Sector Wage Growth (Yr/Yr %)
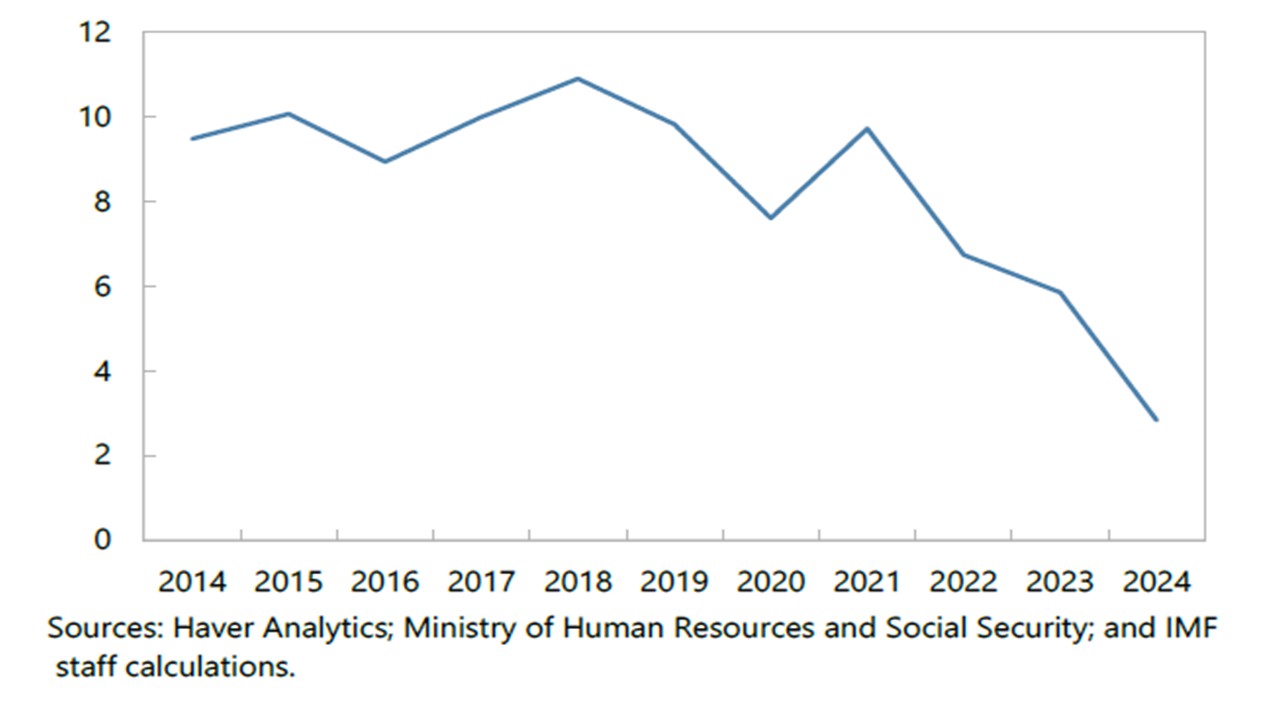
Source: IMF Article IV Feb 26
Figure 2: Domestic Credit To Households (Yr/Yr %)
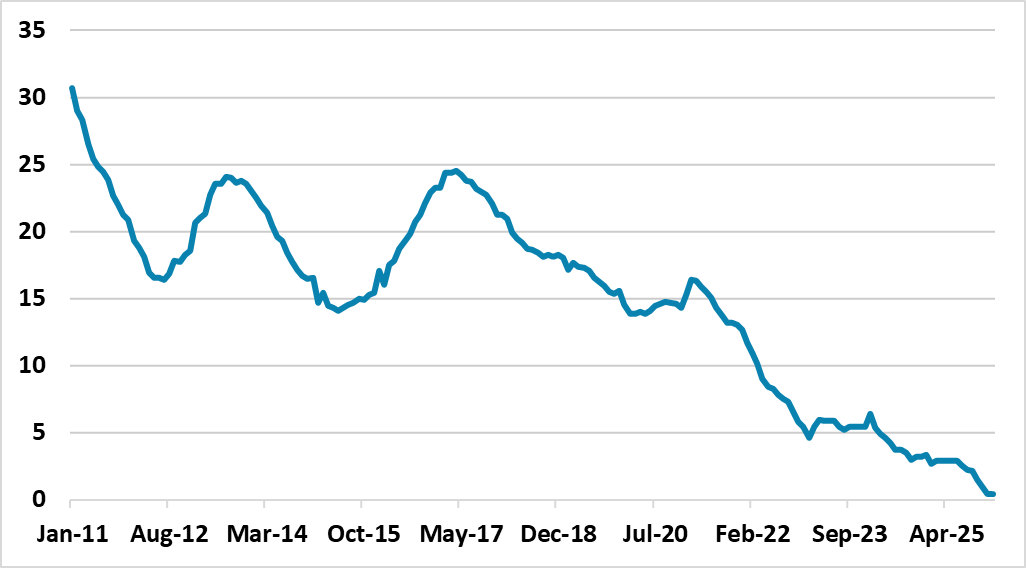
Source: Continuum Economics
• Residential property no bottom yet. Official views that the housing market is bottoming appear premature (here). Firstly, a large inventory of complete and incomplete property continues to curtail the interest in new residential construction. Secondly, property developers’ finances remain volatile, while government support is modest rather than aggressive. Thirdly, households' property optimism has been significantly dented by the bust of the last few years, with some households keen to paydown mortgage debt and meaning domestic credit to households is zero (Figure 2), which only occurs normally in recession or balance sheet constrained economies. Demand remains soft and fragile. Though we see the negative drag from residential property on GDP being less in 2026/27 than 2023/24, it will still knock around 0.75% off GDP in 2026 and 2027. Aggressive local and central government purchases of property would help market clearing and reduce downward pressure on house prices, but the authorities rejected this IMF recommendation in the recent Article IV consultations.
• Net exports. A positive contribution should be seen in 2026, but lower than 2025. China was lucky in 2025 in being able to redirect exports to other countries and via 3rd countries to the U.S. The U.S. will continue to tighten China exports through 3rd countries, while the EU and major EM countries want to avoid any cheap dumping by China’s manufacturers. Meanwhile, though the October 2025 U.S./China framework deal avoids renewed escalation of trade tension, it is unlikely to be followed by a comprehensive trade deal in 2026 as China does not want major import and bilateral trade commitments. Effective tariff rates are also now not much above the EU/Japan deals after the U.S. Supreme court rejected reciprocal and fentanyl tariffs and the U.S. introduced a flat 10-15% section 122 tariff.
· .
· AI/High-tech production/Infrastructure spending. The bright spot for the economy remains AI and high-tech manufacturing, with government support having helped ignite a spending wave in these areas that should be sustained through 2026/27. Open sourced AI applications are more reasonable than U.S. models and this is prompting some transformation. China’s manufacturing sector is also aggressively investing in factory robots to replace workers and increase profit margins. March’s NPC meeting announced new public sector infrastructure investment for 2026 to try to push GDP growth back up again. A similar modest scale of fiscal easing will likely be seen in the 2027 NPC meeting.
Overall, the cyclical headwinds to GDP growth from modest consumption and negative residential property investment remain and net exports will be less of a support. It is also worth mentioning that population aging is more evident on a structural basis, which slows new house demand and absolute consumption levels for the over 55’s (here). The underlying momentum for 2026 looks like 3.8-4.0% -- the Multi week Iran war will likely knock 0.2% off 2026 growth. Though optimists could argue that the AI/tech wave could boost productivity, this is a long-term trend, while humanoid robotics is a 2030s story due to cost and battery problems (here). The announced fiscal stimulus will likely lift GDP to around 4.2% for 2026. For 2027, we see a further trend slowing to below 4.0%, as the structural headwinds get larger. Even so, further moderate fiscal stimulation will likely come through in 2027 and we forecast 4.2%. It could also be that the reported GDP numbers are higher (to hit the 4.5-5.0% target) than the actual reality, as this still remains the political bias for good news messaging.
One consequence of this unbalanced economy and modest consumption growth is that production continues to exceed domestic demand and produce disinflation pressures. Though China authorities are keen to avoid price wars, they will not aggressively push for excess production capacity to be shut as this would provide a vicious adverse circle for China’s economy. We forecast CPI at 1.4% in 2026 due to more elevated oil and gas prices throughout the year but 0.1% in 2027 when energy prices come down to pre-war levels.
Fiscal and Monetary Policy
Though China’s authorities have delivered further fiscal stimulus for 2026, this is modest rather than aggressive. China’s authorities feel fiscally constrained by the rapid build-up of government debt/GDP as shown by the main IMF measure (Figure 3) – the augmented IMF measure that includes the remaining 1/3 LGFV debt is on a still higher trajectory. The general government budget deficit is projected by the IMF to remain in excess of 8% of GDP in the remaining years to 2030.
Figure 3: China General Government Debt/GDP IMF Measure (%)
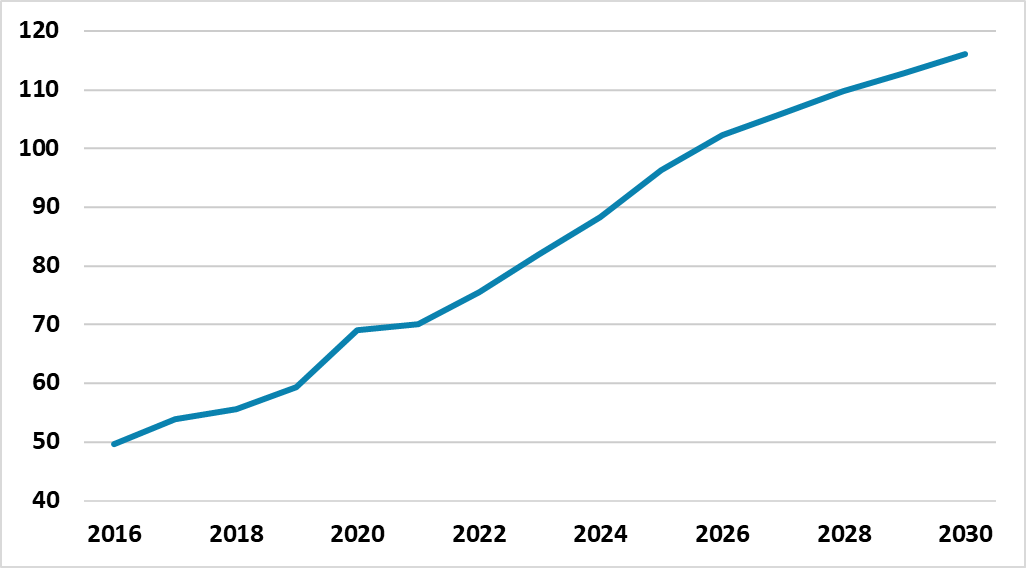
Source: IMF October 2025 Fiscal Monitor
In terms of monetary policy, the authorities’ action continues to be restrained by concerns that too low interest rates could hurt China’s banking system interest margins and lending. Additionally, internal PBOC opposition to ultra-low interest rates and QE remains significant. The 2024 PBOC financial stability review (here) shows only 2% of banking assets in troubled banks, but the 2023 stress tests show this could surge with a 100% pick up in NPLs and lower profitability (here). Cutting policy rates risks hurting margins for weak banks and hurting lending capacity!
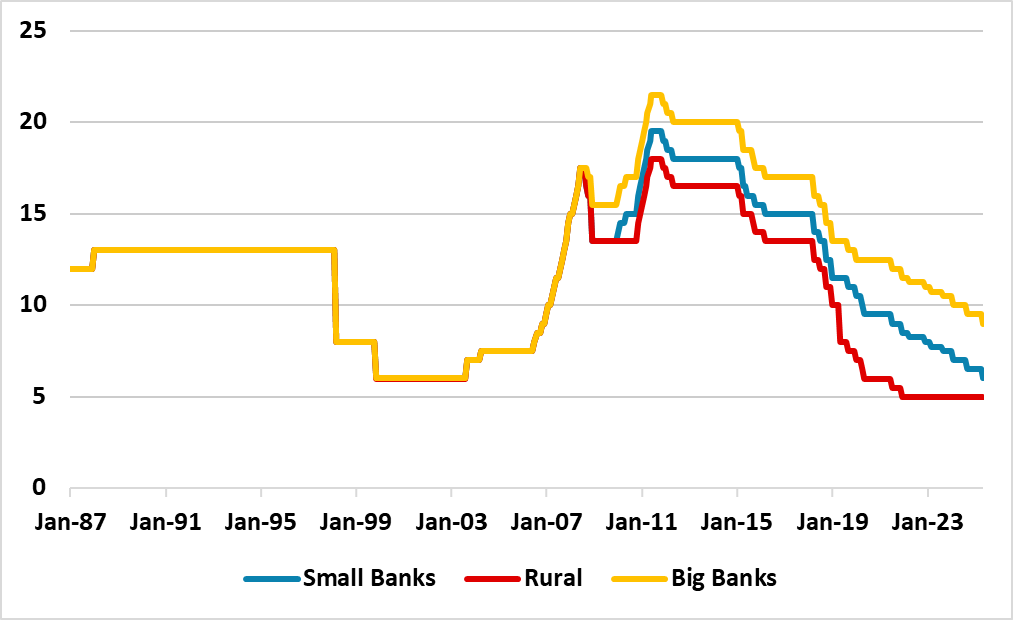
We still also only see 10bps of reduction in the seven-day reverse repo rate in 2026 to 1.3%. Some further scope exists to cut RRR for big banks but they have better balance sheets than small and rural banks. We see a 50-75bps reduction in the RRR rate in 2026, which will likely also apply to small banks but not rural banks that are already at the 5% floor (Figure 4).
Figure 4: Reserve Requirements (%)
Source: Datastream/Continuum Economics
For 2027, we see a further 10bps reduction in the 7 day reverse repo rate, which is restrained by PBOC concerns over the banking system but driven by the need to do something as a signal for the economy. Even so, current low interest rates are not stimulating the private sector, as some households and businesses are facing a balance sheet recession, which would ideally require fiscal policy and market clearing polices to improve confidence.