U.S. Q3 GDP: Better Than Expected, But
Q3 GDP came in better than expected due to a big net export contribution to growth. Gross domestic purchases at 2.7% were more in line with expectations, with mixed performance in key expenditure sectors. We see growth slowing in Q4, with net exports unlikely to repeat the Q3 outcome and consumer spending slowed by the aggregate slowdown in employment and income.
Figure 1: Volatile GDP Into 2026 (SAAR %) 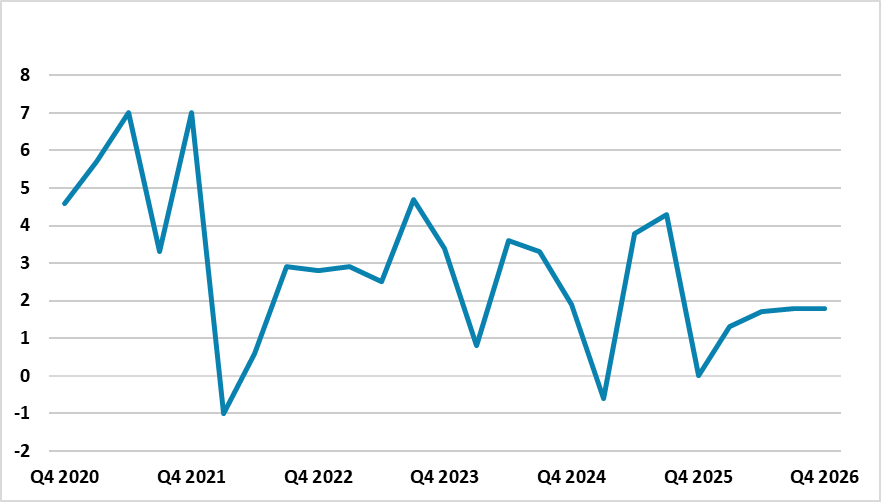
Source: BEA/Continuum Economics
Q3 came in higher than expected, but is unlikely to be repeated in the coming quarters. Key points include
· Q3 GDP. 4.3% versus 3.3% consensus for Q3 GDP, but most of the surprise is the 8.8% export rise and 4.7% import fall. Gross domestic purchases came in at a more moderate 2.7% and the Fed are likely to look at that and understand that imports were depressed by unwinding of H1 pre tariff surge -- though exports were also surprisingly good. Elsewhere, the breakdown shows that consumption was better than expected at 3.5% (service spending was good at 3.7%), but non-residential investment only rose 2.8% and expectations had been higher (AI helped IP and equipment spending). Residential investment was really disappointing with a 5.1% fall. Our forecast is for zero GDP Yr/Yr in Q4 (Figure 1), due to the government shutdown in October and November and also as net exports are unlikely to add to growth like Q3. Additionally, slower employment growth means less aggregate income and in turn less aggregate consumption growth. Weaker Q3 real disposable income growth was outstripped by consumption growth.
· AI investment boom but Consumption depends on the rich. Into 2026, the AI investment boom will support overall business investment with the U.S. hyperscalers expected to spend USD500bln in 2026 and most of that in the U.S. Though Oracle is showing volatility for external finance (here), Amazon/Microsoft and Alphabet investment plans are credible and mainly from cash flow. Meta plans are more high risk for shareholders, but can also be largely done out of cashflow. Consumption is the other main bedrock of economic momentum, but has increasingly been talked about as K shaped. Workers on average or below average income are struggling with the high level of prices compared to 2019, as wages have not outpaced prices. However, the richest 20% are driving consumption, with the Dallas Fed estimating that this group accounts for 57% of consumption (Figure 2) helped by a high share of income and wealth. This group is most vulnerable to a bear market in U.S. equities, which could cause an adverse wealth effect. While this is not our baseline for U.S. equities in 2026, it is a faultline. This all points to a soft H1 2026 as outlined in our U.S. outlook (here), but lagged Fed easing plus two more 25bps cuts should help support the economy H2 2026.
Figure 2: Income, Wealth and Consumption of top 20% (%)
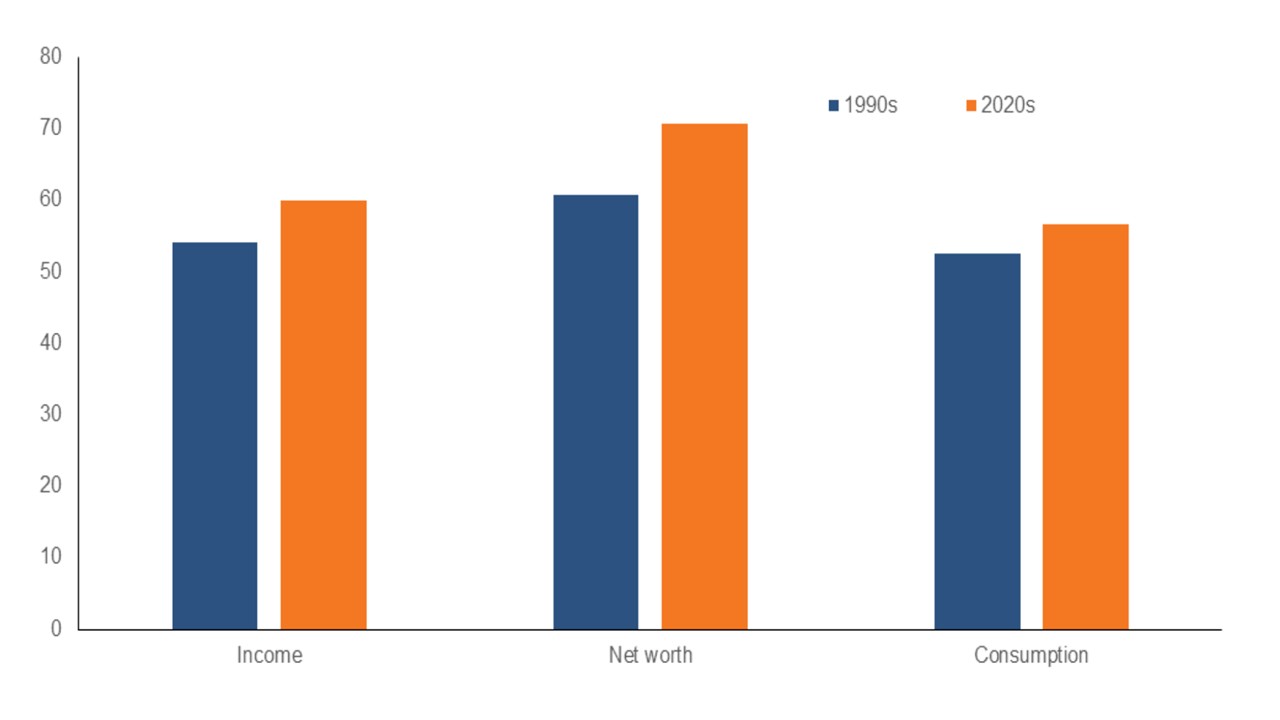
Source: Dallas Fed (here)