DM FX Outlook: USD Set for 2025 Decline
· Bottom Line: The USD has reached the end of year targets of 1.12 for EUR/USD and 140 for USD/JPY that we forecast in June, when it was trading at 1.07 and 159 respectively. From here, we still favour the USD downside through both the rest of the year and 2025, as the Fed continues to ease policy, but the majority of this year’s move is likely to be complete, while we see 1.20 and 125 EUR/USD and USD/JPY respectively for end 2025. The pace of the USD decline will depend on whether the U.S. sees a hard or soft landing, and whether we see European economies build on better H1 growth or slip back into the zero growth mode seen in late 2023.
· Forecast changes: Most of our forecasts remain unchanged, but we have raised our GBP forecast slightly to reflect the modest improvement in UK growth performance and a slightly slower pace of BoE easing. Even so, we still expect GBP to fall against the EUR, with EUR/GBP reaching 0.88 by end 2025. We have also revised up our forecast for EUR/NOK due to NOK underperformance this year, but still expect a EUR/NOK decline to 11 by end 2025.
· Risks to our views: There are uncertainties relating to the US election and the Ukraine war, as well as the normal economic developments. However, it isn’t clear whether the USD would prefer a Trump or Harris presidency. We doubt that either will be able to enact their more radical policies due to a split Congress, so impact is likely to be modest unless there are surprise victories for the Democrats in the Senate or the Republicans in the House. There is still a major undervaluation of the JPY, in part due to relatively low Japanese inflation in recent years, and this could produce more rapid gains for the JPY in the event of a hard landing or a sharp equity market decline.
Figure 1: Percentage differences from PPP

Source: OECD
JPY weakness remains extreme despite recovery
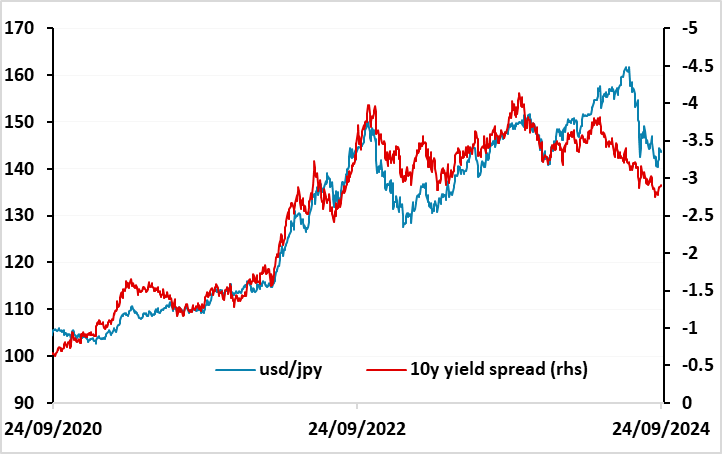
The big move in Q3 has been the recovery of the JPY, initially triggered by a combination of BoJ intervention, a rise in Japanese rates, and an equity market decline which triggered lower U.S. yields and a narrowing of yield spreads. There has also been an increase in hawkish rhetoric from the BoJ, although this has not yet translated into any significant rise in Japanese yields, and the latest comments from BoJ governor Ueda have suggested there is no hurry to tighten further. Of course, with USD/JPY at 160 yield spreads were already pointing significantly lower even without any further narrowing, but the turn in equity sentiment was required to trigger the USD/JPY reaction.
Figure 2: USD/JPY responding to lower yield spreads
Source: Continuum Economics/Datastream
From here, we still look for substantial JPY gains over the next year, with 125 a target for the end of 2025. But there is a less strong case for further immediate JPY gains, even though yield spreads still point lower for USD/JPY (Figure 2) and the JPY remains a lot weaker in real terms than it looks in nominal terms. Much of the JPY strength in Q3 came on the back of weakening risk sentiment and concerns about a potential hard landing for the U.S., but these concerns have dissipated as U.S. data has continued to suggest underlying solidity and the Fed has shown a willingness to ease aggressively with the initial 50bp rate cut. U.S. equities are once again trading new highs, and even though we consider valuations to be stretched, even in a soft landing scenario, a new trigger may now be required to reignite JPY gains. This may come in the form of BoJ tightening, and higher Japanese yields. Up to now, most of the movement in yield spreads has come from the U.S. (and European) side, but we would expect U.S. 10 year yields to stabilize close to current levels, and further narrowing in the 10 year spread over the next year is likely to come from the Japanese side, with scope for 10 year JGB yields to reach 1.5% by mid-2025. Despite the recent comments from Ueda indicating a less urgent pace of tightening, tightening is likely by year end 2024, and with the BoJ talking about rates reaching 1% or higher in the longer run, this is likely to trigger a move in 10 year yields above 1%.
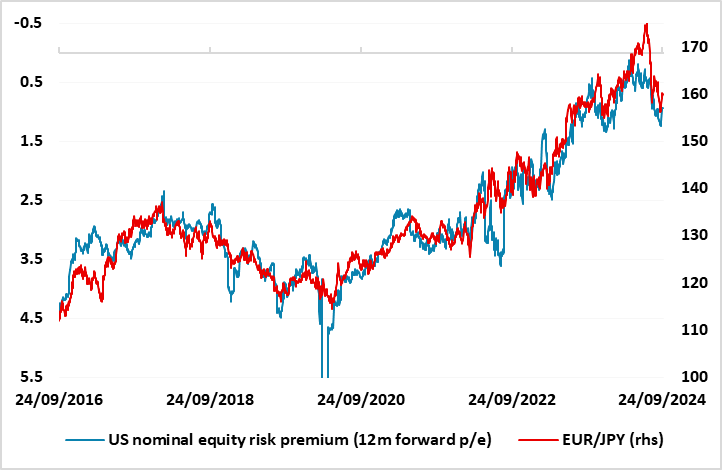
Figure 3: EUR/JPY still moving with equity risk premia
Source: Continuum Economics/Datastream
Equity market performance still key for JPY crosses
Whether the JPY outperforms other currencies against the USD has tended to depend in recent years on fluctuations in risk sentiment, with most JPY crosses highly correlated with movements in equity risk premia (Figure 3). EUR/JPY has reconnected with this correlation in Q3 after overshooting at the end of Q2, and by the end of Q3 was trading close to fair based on this metric. But we would still see scope for EUR/JPY to fall from here, for two reasons. First, because equity risk premia remain very low by historic standards, and we would expect some correction higher and second, because the JPY has weakened a lot more in real terms than in nominal terms due to relatively low Japanese inflation, and this weakening will need to be corrected at some point.
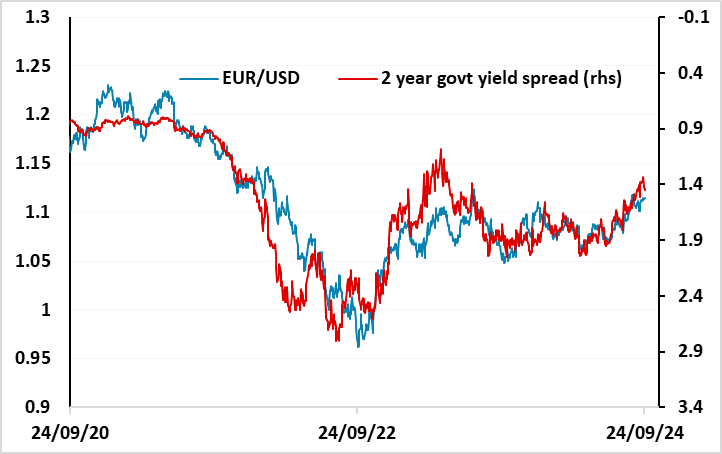
Figure 4: EUR/USD still tracking short term yield spreads
Source: Continuum Economics/Datastream
EUR/USD has been much less volatile than USD/JPY this year, but has scope for gains over the rest of this year and 2025. As Figure 4 shows, EUR/USD has broadly followed short term yield spreads for most of this year, and these are already suggesting some scope for further gains. However, the EUR tends to need an environment of positive risk appetite, particularly related to the Eurozone economy, in order to make convincing gains. The dip in equities in the summer held the EUR back to some extent, but the recent recovery has helped sustain a EUR recovery, particularly against the JPY. While EUR/USD has tended to correlate with short term rate spreads, EUR/JPY has tended to move with U.S. equity risk premia. The recovery in equities combined with the slight rise in U.S. yields in the wake of the first Fed rate cut has triggered a strong EUR/JPY rally. But EUR/JPY is now looking a little stretched, and further EUR/USD gains may be dependent on USD/JPY declines as a result.
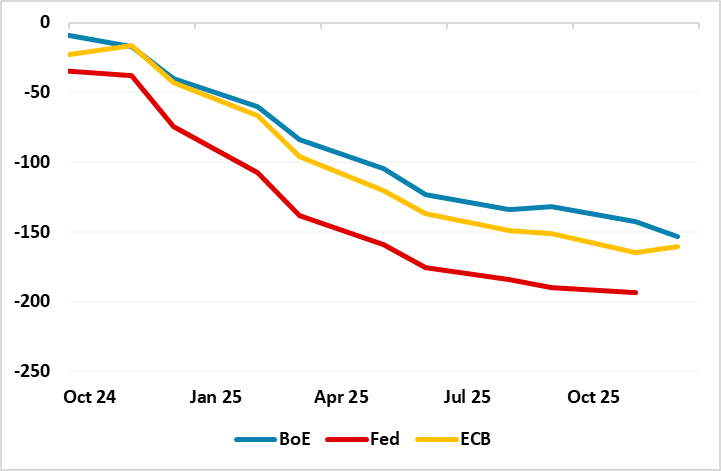
Figure 5: Market pricing of policy rate moves
Source: Continuum Economics/Refinitiv
We also have some concerns about the robustness of the Eurozone economic recovery, so that there are some risks of a more rapid decline in Eurozone yields than the market is currently pricing in. At the moment, the ECB is priced to ease somewhat less rapidly than the Fed over the next year, but that could change if we see the Eurozone economy slip back towards zero growth and inflation come back under target. Nevertheless, such a scenario might only reduce the scope of EUR/USD gains given the low EUR starting position and the current yield spread which already suggests scope for gains above 1.12.
GBP strength likely to fade
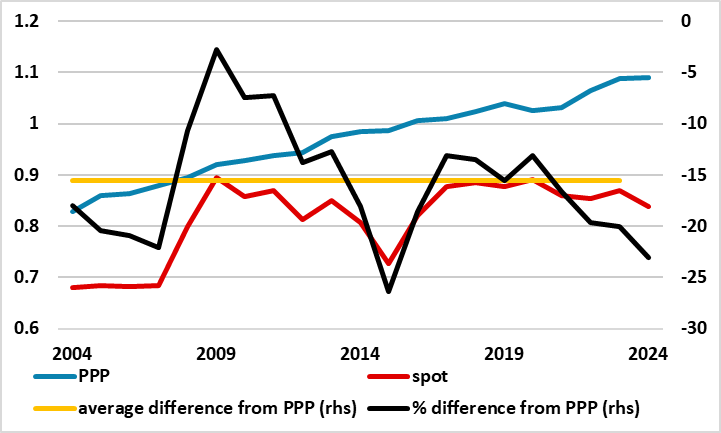
GBP strength has been one of the notable developments this year, with the pound benefiting from the stronger than expected H1 growth performance and a slower pace of easing from the BoE relative to the other major central banks. This has supported an improvement in sentiment that has justified some reduction in the risk premium that had built up in GBP during the latter years of the previous UK government. But the rise in GBP against the EUR has been less obviously supported by yield spreads. EUR/GBP has fallen to its lowest level in real terms since the Brexit referendum in 2016, a move that doesn’t look well supported by yield spreads, even assuming a slower pace of BoE easing. While the UK growth picture improved in H1, the latest recovery in growth doesn’t yet make up for the major growth underperformance of the last 5 years, so GBP may now be vulnerable to any evidence that the growth recovery has stalled.
Figure 6: EUR/GBP approaching the pre-Brexit referendum lows in real terms
Source: Continuum Economics/Datastream/OECD
Commodity currencies have potential to outperform
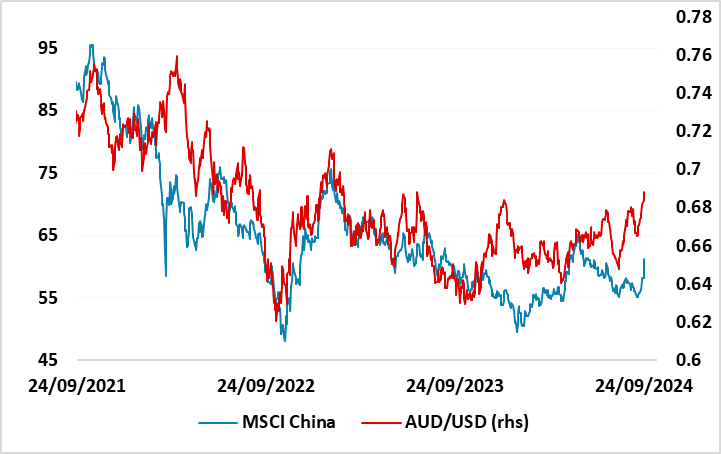
Despite the generally risk positive environment of the last year, commodity currencies have not performed particularly well, even though they have mostly had the support of relatively tight monetary policies. The NOK has been the big underperformer, but the AUD has also failed to make gains in spite of relatively tight RBA policy and a significant move in 2 year yield spreads in the AUD’s favour. The AUD has been held back to some extent by the weakness of the Chinese economy and particularly the Chinese equity market and this has thus far prevented a break above the high of the year seen right at the beginning of the year. While it’s hard to be negative on the AUD due to the solid domestic economic performance and the relatively tight RBA, some improvement in the China picture may be necessary if we are to see AUD/USD gains extend to 0.70 and beyond. Nevertheless, we do see gradual AUD gains over the next year.
Figure 7: AUD held back by Chinese equity weakness
Source: Continuum Economics/Datastream
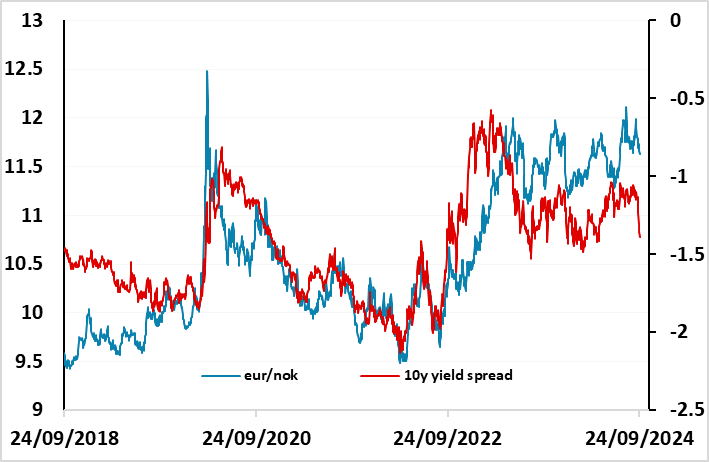
For the NOK, the rationale behind the underperformance is less clear. It may be that the market is in the process of correcting the very high valuations that we saw in the mid-2010s in the wake of the Eurozone debt crisis (see Figure 1). But the economy has generally performed relatively well, the current account surplus remains huge, and yield spreads have moved in its favour. Of course, the government pension fund ensures that most of the current account surplus is held in foreign currency, so doesn’t lead to a direct flow across the exchanges, but this is not a new thing. While we wouldn’t expect a return to the NOK heights of the mid-2010s, we do see scope for EUR/NOK to fall back from the all time highs near 12 to below 11 by the end of 2025.
Figure 7: EUR/NOK to move down towards 11
Source: Continuum Economics/Datastream