France and Japan: Debt Fuelled Growth Problem
Most of the surge in debt/GDP in Japan and 40% in France is due to higher government debt and this should not be a binding constraint provided that large scale QT is avoided – we see the ECB slowing QT in 2025 and are skeptical about BOJ QT in the next few years. The adverse impact of higher debt and debt servicing on France’s economy should be small provide a property crash or anti Euro government are avoided.
France and Japan have seen a large increase in total non-financial sector debt/GDP since 2007, though these have been exceeded by China. What are the consequences of this build up?
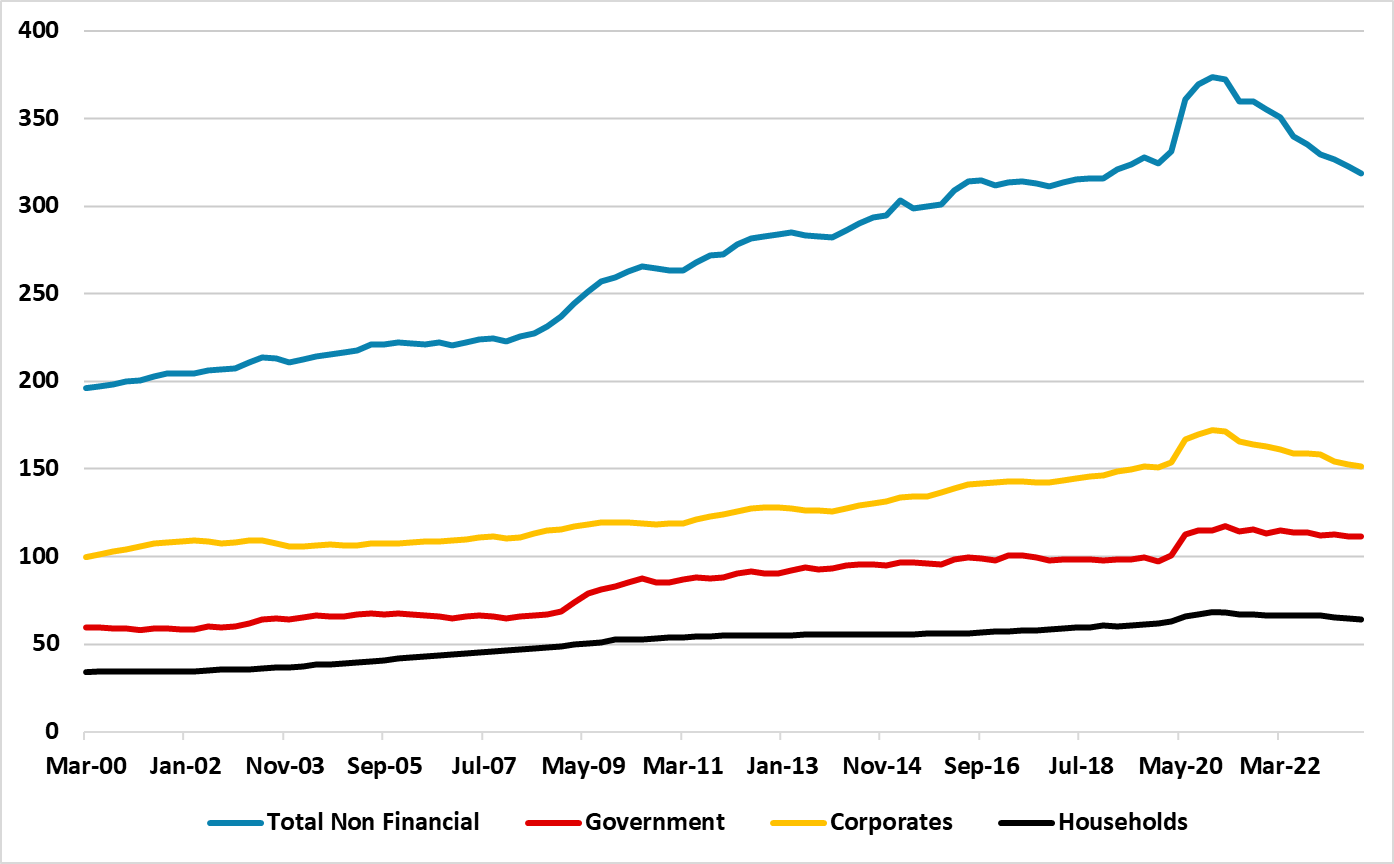
Figure 1: France Debt/GDP Total and Key Sectors (%)

Source: BIS
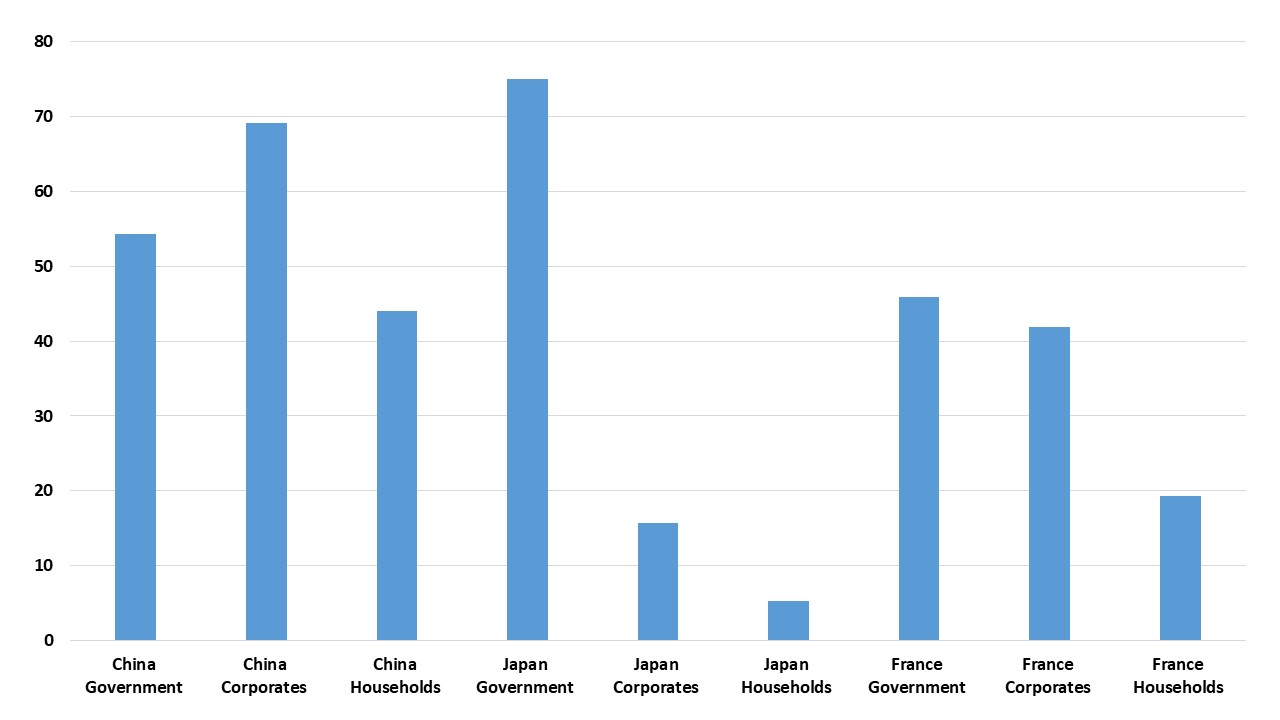
France is not perceived to have a debt problem, despite the total of government/household and corporate debt rising by 96% of GDP since Q1 2007 (Figure 1). It is similar to the 96% rise in Japan and well above 4 place Brazil (66%) in the G20 but behind China 167% (here) over the Q1 2007-Q3 2023 period. Nevertheless, the total of France non-financial sector debt at 316% of GDP exceeds the U.S. and EZ. Government/Corporate and Households have all contributed to the pick-up in France (Figure 2). The total debt has come down a lot since Q1 2021 helped by high inflation outstripping debt growth and the corporate sector repaying COVID era loans. These two features are unlikely to be repeated going forward with French trend growth and the ECB inflation target suggesting a forward looking nominal GDP trajectory of 3.5% is a good working assumption. This means that debt growth for France could now stop falling.
Can the French corporates/households and government ignore the previous build-up in debt? The French economy cannot ignore that future debt servicing costs are likely to be higher than the post GFC era of ultra-low interest rates. Though we do see a consistent ECB easing cycle, we would still see the ECB deposit rate at 2.25% with French yields will likely be at a premia to this level across the curve. As borrowers come to refinance, they will find higher borrowing costs and this will cause distress and economic restraint from weak borrowers but not for strong borrowers. For the corporate sector the BDF has done work on this (here), with an increasing proportion of market based finance since the GFC. For the household sector, the BDF points out that the rise in household debt has accompanied a surge in household wealth driven by higher land/property prices (here). Eur2trn of household debt is supported by Eur14trn of property assets, which is fine provide residential property prices do not see a major reversal. Overall, weaker borrowers can be hurt, but the macro impacts could be small. This may not be noticed given the volatility of the economic cycle in the 2020-24 period.
In most scenarios, the debt/GDP build-up should not be a problem for the French government, as the ECB balance sheet has indirectly absorbed a good portion of the increase via QE in government debt/GDP seen since 2007. Though the ECB is increasing QT, it is unlikely to be the scale and duration of QE and we see the ECB slowing QT in 2025 as part of the easing cycle. The French government debt build up would be a major problem if French elects a government that wants to radically reform or leave the Euro, which remains a low risk event in the next 3-5 years. The current large structural budget gap of around 5% and an elevated government debt/GDP profile is a long-term concern, but it does require a catalyst to ensure a noticeable market and economic impact.
Figure 2: Change in Debt Q3 2023 v Q1 2007 (%)
Source: BIS
Japan build of debt since 2007 has been dominated by the government. This has not had much impact as the 75% surge in government debt/GDP has been exceeded by BOJ assets (mainly JGB’s) increasing by 104% over the same period. The BOJ through secondary market QE has absorbed the debt surge. It is clear that the BOJ is slowing the net QE pace to close to zero, as part of its normalization process. However, QT is an idea, rather than any advanced planning having occurred by the BOJ. Indeed, we forecast that Japan CPI inflation will likely slow into 2025, as consumer resist attempts by businesses to pass on high prices. This will likely stop the BOJ from increase the policy rate beyond the 10bps move we see in the coming months and also delay discussions on an eventual QT plan. If the BOJ surprised and started QT into 2025, then it would cause an interest rate shock through higher JGB yields but also dramatically reduce the fiscal space for Japan’s government.
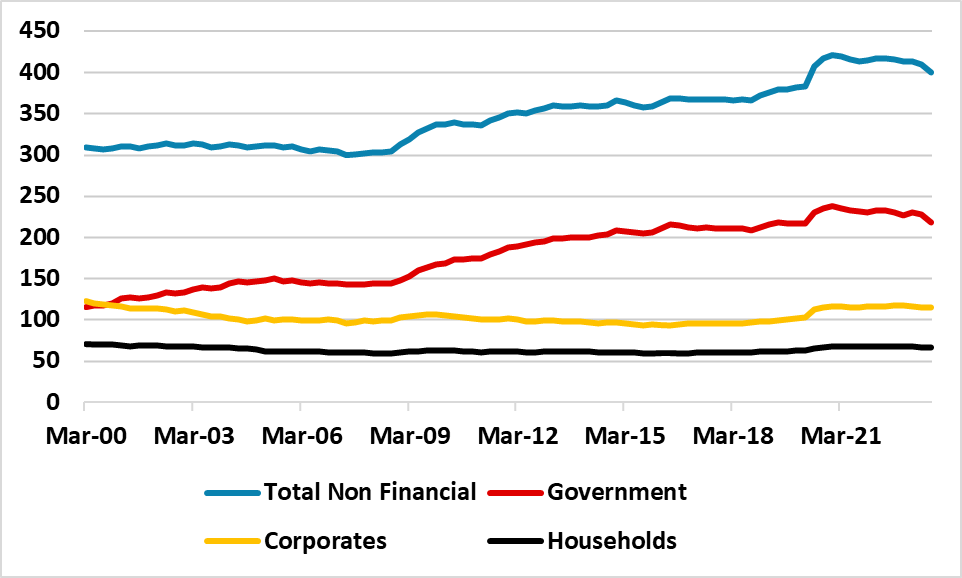
Figure 3: Japan Debt/GDP Total and Key Sectors (%)
 Source: BIS
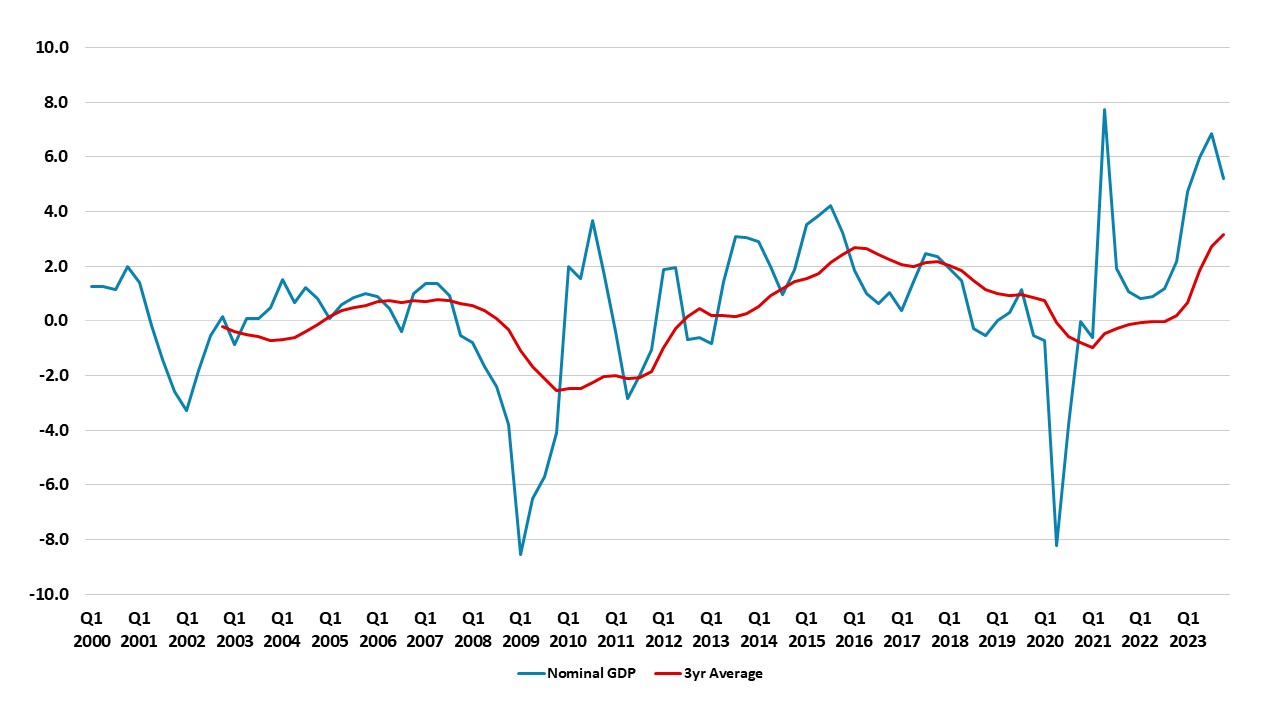
Japan normalization process will also be restrained by policymakers desire for a goldilocks economy. Higher real and nominal GDP that the post 1989 era, but not too hot inflation. Nominal GDP is certainly higher than the 2000-19 experience (Figure 4), but would need to be consistently at 3% or above to ensure that Japan’s debt/GDP trajectory comes down further – higher nominal GDP growth has helped total debt come down in 2023 (Figure 3).
Figure 4: Japan Nominal GDP and 3yr Average (Yr/Yr %)
Source: Continuum Economics

