DM FX Outlook: The Rest of 2026
Our baseline is for a 4-8 week Iran war, with WTI down to USD80-85 by June; USD65-70 end 2026 and USD60 by Q3 2027. This should see the USD return to a weaker profile later in the year. In our December Outlook, our favorites were the AUD and NOK based on yield spreads, but it is also worth noting they are net energy exporters and helped if energy prices remain elevated. Given our view that the March USD bounce should recede later in the year as energy prices come down, we still forecast 0.72 for end 2026 on AUD/USD. On EUR/NOK we also look for renewed appreciation to 11.00 by end 2026. On EUR/USD, we see an easing of energy prices allowing H2 Fed easing and a return to 1.20.
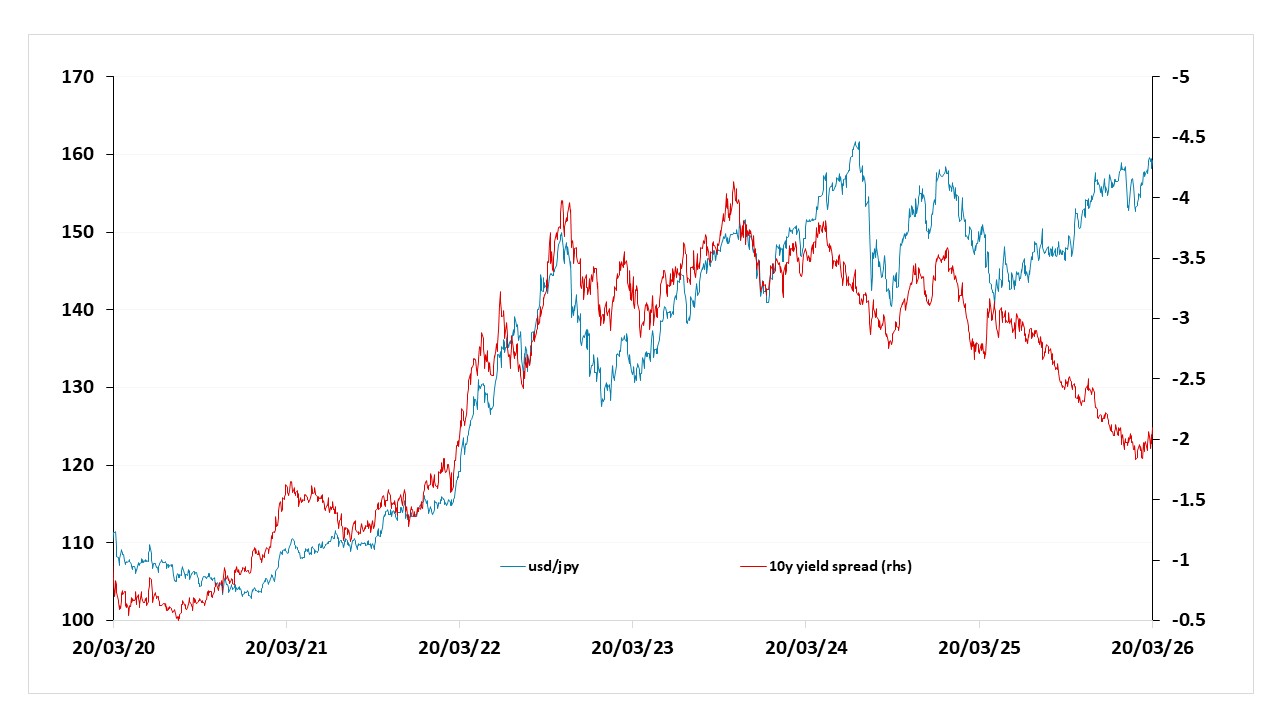
On USD/JPY, the Iran war and Takaichi success has depressed JPY sentiment and the market has ignored the further narrowing of 10yr government bond spread. We would still be inclined for this extreme JPY undervaluation to be reconsidered, but we now look for 148 rather than 140 for end 2026. A deeper equity market correction in the U.S. could be one catalyst, while another could be BOJ FX intervention.
• Risks to our views: A more prolonged 2-6 month Iran war could sustain a higher USD for long, but the U.S. equity market could crack in this scenario and produce a risk off decline in the USD. AUD and NOK could still be rerated in this situation, though more so against EUR and GBP.
Figure 1: Energy trade, measured as the percentage of energy use (-ve is net importer, +ve net exporter)
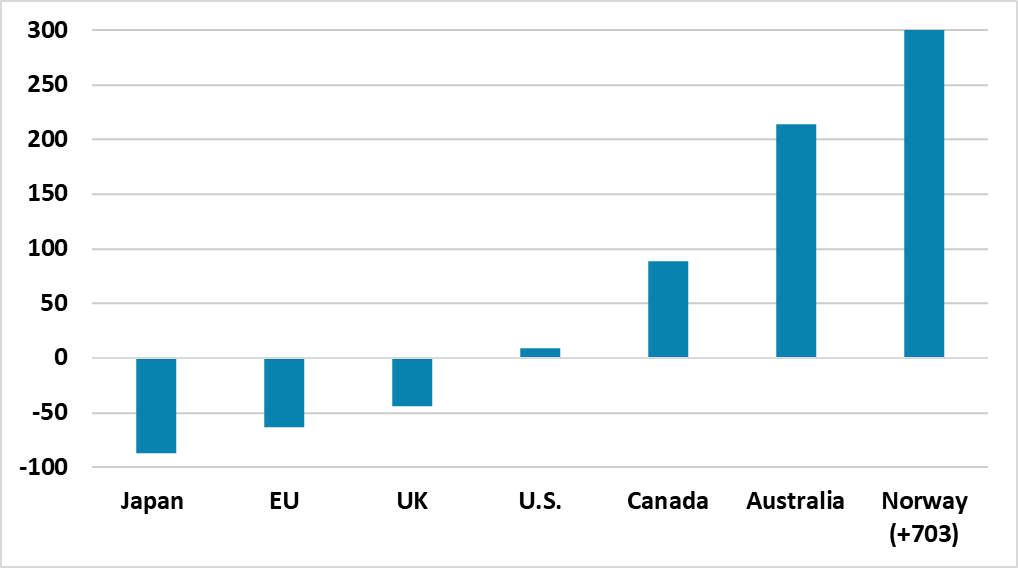
Source: World Bank (2023 data), CE
For global FX our baseline (here) is for a 4-8week Iran war, with WTI down to USD80-85 by June; USD65-70 end 2026 by June and USD60 by Q3 2027. A fragile situation will mean it will take until 2027 for energy prices to return to pre war levels. This would mean only temporary economic effects and a refocus on underlying cyclical and structural forces. However, the Iran war and post war energy price trajectory has interrupted the USD downtrend and prompted a bounce on safe haven flows and tempering of Fed easing expectations. Additionally, the U.S. energy self-sufficiency stands in sharp contrast to the EZ/Japan dependence on imports energy (Figure 1).
For EUR/USD, the memories of the Ukraine war energy crisis in Europe have reawakened, when a super surge in natural gas prices rocked European industry and households much more than the U.S. This prompted a fall below parity on EUR/USD and a detachment from 10yr bond yield differentials (Figure 2). While the EUR is vulnerable to a prolonged multi month war this is not our central scenario, while it is also worth noting that natural gas through the Straits of Hormuz is 2% of global consumption (LNG is 10% of global natural gas) compared to approximately 20% of global oil consumption through the Straits. This is less of a natural gas shock to Europe than the Ukraine war. Thus we are not overly pessimistic on the EUR, despite what will likely become a fragile situation after hostilities end. As energy prices ratch down through the course of 2026 we would see the EUR starting to recover ground on this understanding that the economic hit is temporary. Additionally, 10yr Bund yields has narrowed structurally versus the U.S. with Germany huge defense and infrastructure spending kicking in throughout 2026. We can see EUR/USD returning to 1.20 by end 2026. For 2027, we generally feel that the overvalued USD will continue to unwind as part of a multi-year cycle and we can see EUR/USD at 1.24 by end 2027.
Figure 2: EUR/USD and the 10 year US/Germany yield spread
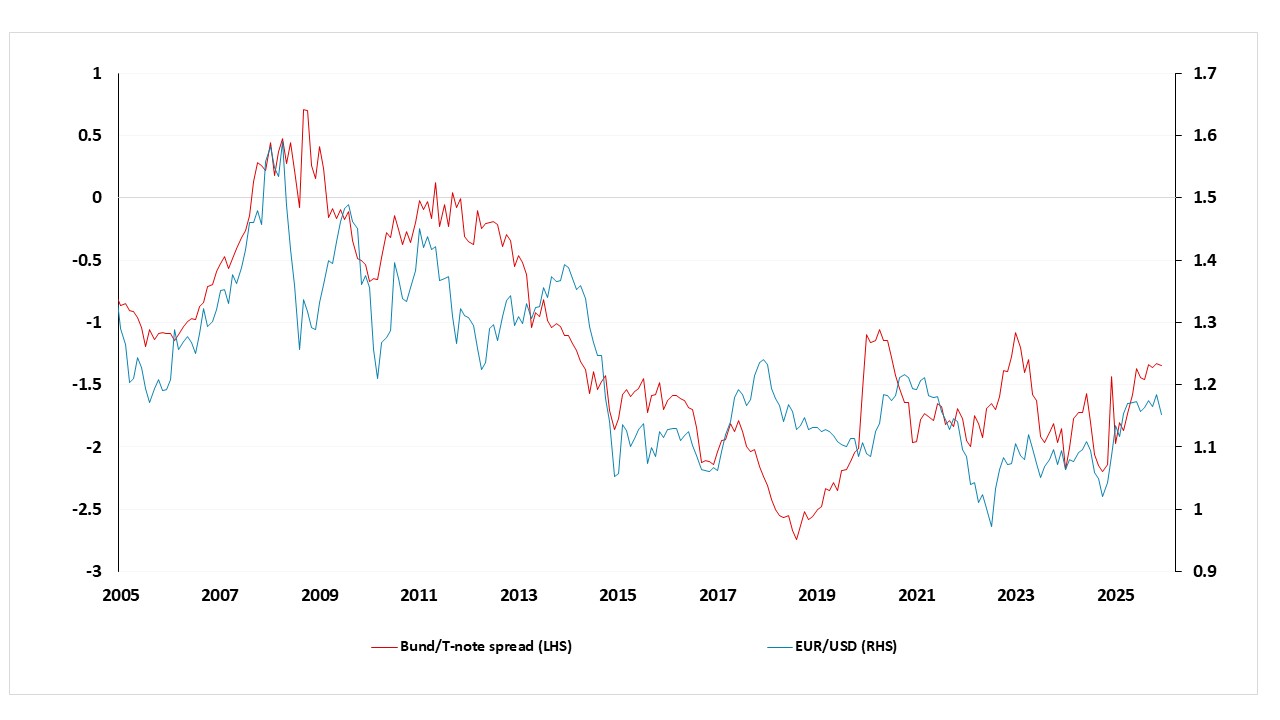
Source: Datastream, CE
In our December Outlook, our favorites were the AUD and NOK, which were rerated noticeably against the USD in January and February, before the Iran war bounce for the USD. AUD and NOK of course are beneficiaries from the more elevated energy prices (Figure 1) and long-term energy investment could be reignited by a desire to diversify away from the Gulf and the Straits of Hormuz. Our primary reason for AUD and NOK also still holds in the context of yield spreads. The RBA is expected by the market to tightening by a further 50bps this year, as it leans against domestic inflation and a tight labor market. Given our view that the March USD bounce should recede later in the year as energy prices come down, we still forecast 0.72 for end 2026 on AUD/USD. However, we did note in December that the AUD is also attractive on a cross-rate basis as well and Figure 3 shows room exists for a rerating against the EUR. GBP/AUD also looks ripe for a rerating, as a slack UK labor market and the recent tightening in UK financial conditions will likely mean that the BOE does not actually hike rates. Additionally, though the FX market has not normally differentiated between government debt sinners and saints, Australia government debt trajectory gives it fiscal space that does not exist to the same degree in the UK or the U.S.
Figure 3: EUR/AUD and 10 year yield spreads
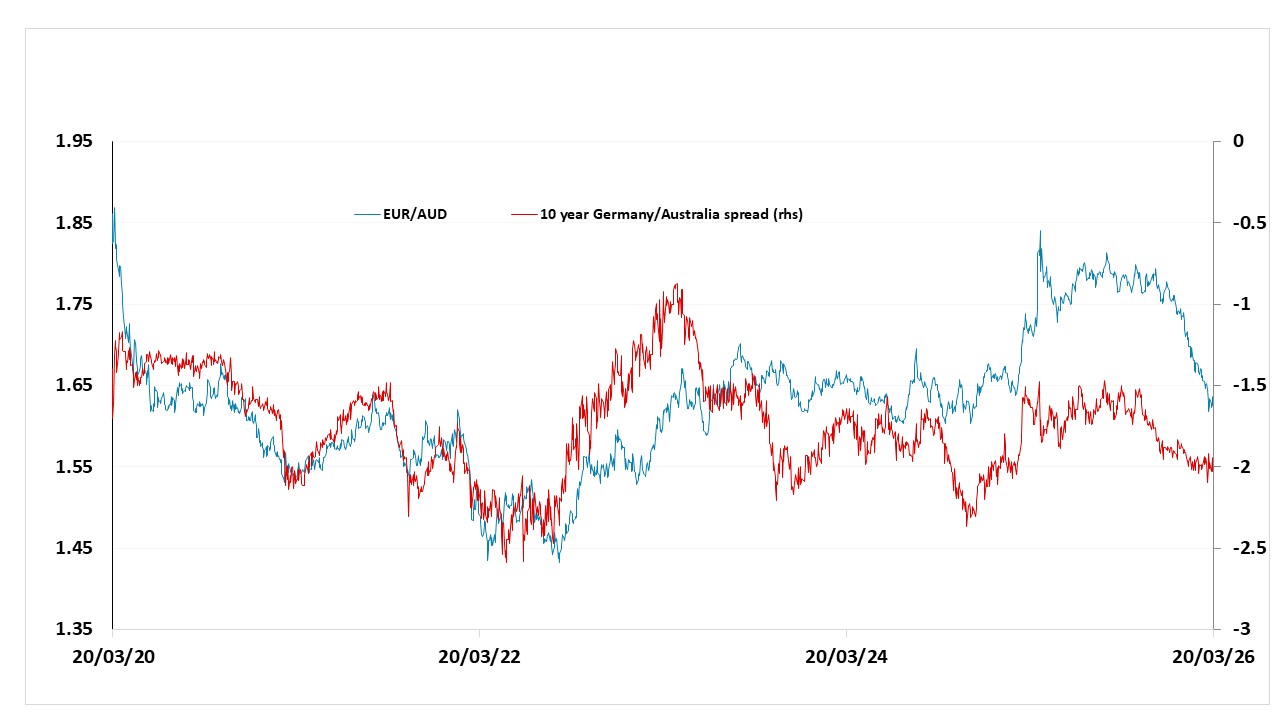
Source: Datastream, CE
The NOK also is a fiscal saint thanks to the windfall of oil and gas revenue. The uprating of the NOK can return later in the year as the Iran war tensions ebb and an reassessment of remaining NOK undervaluation comes through. The Norges bank policy rate level also stands above most other DM countries, which is helpful and we see NOK as a high yield safe haven. In December, we highlighted NOK/SEK as one way to play for this NOK reassessment and Figure 4 suggest that we still have scope for NOK appreciation. On EUR/NOK we also look for renewed appreciation to 11.00 by end 2026.
Figure 4: NOK/SEK and 10 year yield spreads
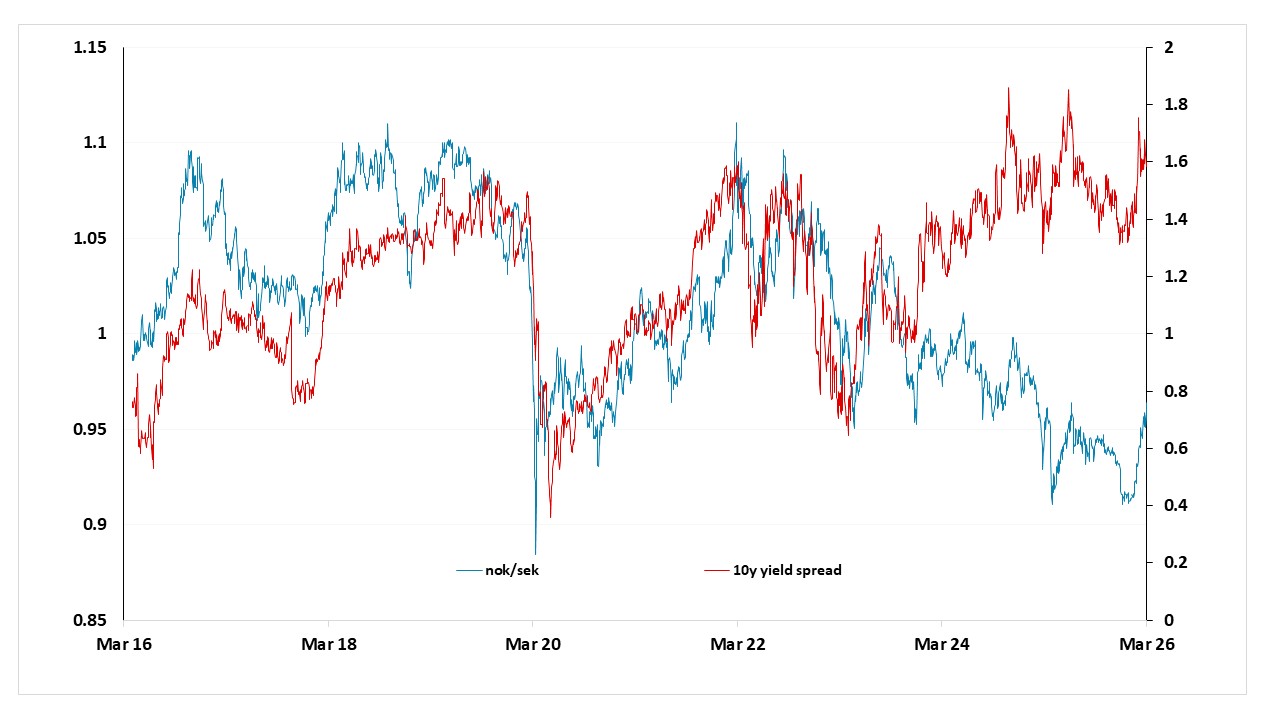
Source: Datastream, CE
JPY still has the most scope for gainsQ1 saw the JPY weaken again after the Lower House election strengthened Takaichi and the LDP and fueled expectations of a return to “Abenomics” – involving both easier fiscal and monetary policy. However, while Takaichi has passed an expansionary budget, it is not substantially different from previous budgets. Additionally, though the PM has tried to pressure the BOJ not to hike policy rates further, we feel a further 25bps hike will arrive in the spring (most probably in April) given that headline and core inflation argue for some further normalization. JGB yields have also moved significantly higher in recent months, and the historic relationship between yield spreads and USD/JPY suggests USD/JPY should already be a lot lower (Figure 5). Indeed, the BOJ QT continues to become more aggressive, as they are scaling down bond buying alongside allowing redemptions to roll off. We see QT getting to 6% of GDP and causing a spike in 10yr JGB yields to 2.5% or above, which could be an event risk for the JPY bears.
Figure 5: USD/JPY and 10 year yield spread
Source: Datastream, CE
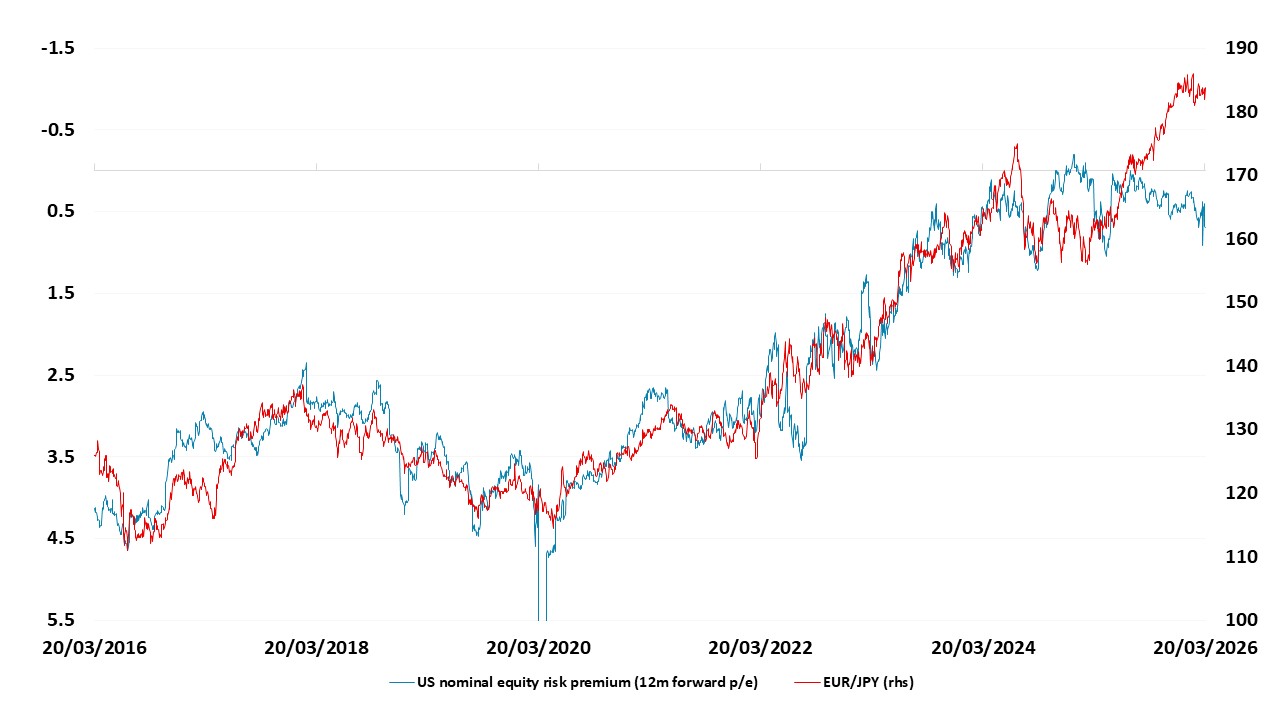
However, the relationship between USD/JPY and yield spreads appears to have broken down for now, although history and theory suggests this will not last indefinitely. There has also been a strong historic relationship between equity risk premia and the JPY (Figure 6 show ERP and EUR/JPY for a change), which, though less theoretically sound, has held up better in recent months. This suggests that we will need to see a bigger turn lower in U.S. equities or, more precisely, a turn higher in equity risk premia for the JPY to turn. The Iran war has prompted a modest shakeout in U.S. equities, but we feel U.S. valuations are so stretched that they can prompt a deeper U.S. equity correction later in the year. Bigger picture, we would expect USD/JPY to move closer to long term fair value in the next couple of years. Purchasing Power Parity for USD/JPY is below 100, but as long as real yields in the U.S. are relatively high the USD can be expected to trade well above that. Even so, with JGB yields likely to rise in the coming years, we would expect to see USD/JPY close to 130 by the end of 2027. Very rapid JPY gains may be seen in the event of a sharp U.S. equity correction. For end 2026, we would still be inclined for this extreme JPY undervaluation to be reconsidered, but we now look for 148 rather than 140, as the Iran war and Takaichi success has depressed JPY sentiment. Also the new Japanese government have verbally protested recent JPY weakness, and the level of the JPY is so weak that intervention to support it would be seen as acceptable.
Figure 6: US real equity risk premium and EUR/JPY
Source: Datastream, CE, FRED
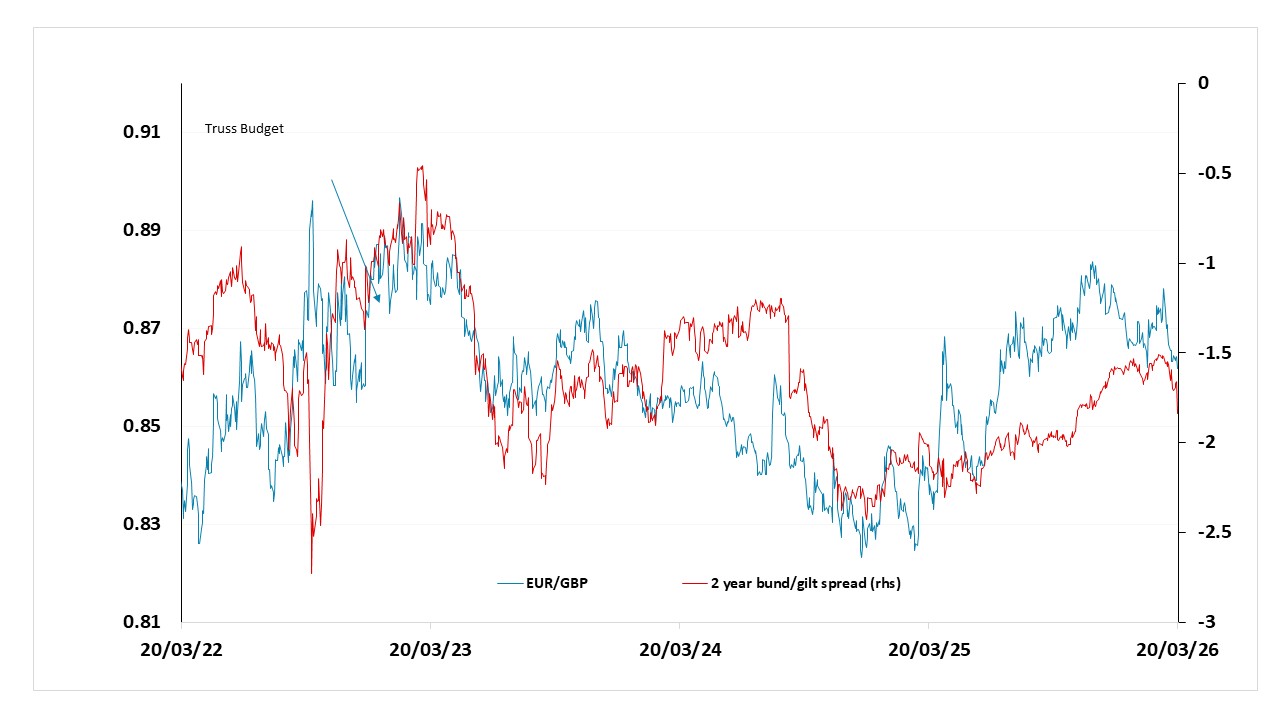
GBP to edge lowerWe expected GBP to continue the gradual decline against the EUR seen through this year. Though the market has abandoned BOE rate cut expectations during the Iran war, as UK economic slack and the recent tightening in UK financial conditions will likely mean that the BOE does not actually hike rates (here). Indeed, as energy prices come down in H2 we would see a refocus on underlying softer UK inflation. The labor market remains the weakest in the DM, as poor business confidence and government multi-year fiscal consolidation are leading to job losses that will feed into further slowing of wage inflation. We expect the Bank of England to cut rates in H2 2026 and 2027 in contrast to current overdone tightening expectations. While we also see potential for the ECB to ease again this is only 25bps compared to 75bps from the BOE. Nominal and real yields spreads should move in the EUR favor. Politics is a swing factor for GBP in 2026 and 2027 ahead of a 2029 general election, with a high risk that PM Starmer or Chancellor Reeves could be replaced. This would likely lead to a softening of the fiscal rules rather than a major fiscal easing but could temporarily boost 10yr yields (here) but hurt GBP. Even so, GBP weakness is unlikely to be dramatic in 2026, with EUR gains likely to be capped at 0.90.
Figure 7: EUR/GBP and 2 year yield spread
Source: Datastream, CE