Commodities Outlook: Shifting Dynamics
The oil market faces mixed forces, including geopolitical pressures, demand concerns, and supply shifts. OPEC+ plans production hikes, driven by stricter U.S. sanctions on Iran and Russia and President Trump’s push for more supply. However, global demand prospects, especially in the U.S. and China, remain weak due to their economic performance. The U.S. is expected to contribute to supply growth, though a production boom is unlikely. We forecast WTI prices at USD 65 by end 2025 and USD 60 by end 2026, with risks stemming from geopolitical and trade factors.
Copper prices are influenced by several elements, including economic uncertainty in China (particularly its sluggish residential property sector) and potential tariffs on copper imports under President Trump's policies. While China’s strong electric vehicle and high-tech sectors may support demand, a weaker U.S. economy and trade war concerns will limit copper demand growth. Supply remains tight but not at deficit levels, with moderate growth in major producing countries. Copper is forecast to end 2025 at USD 9,500 and 2026 at USD 9,800. Risks include tariff changes and supply disruptions.
Gold reached a record high in Q1 2025, primarily driven by central bank demand, and found additional support in economic uncertainty, especially from President Trump’s tariff policies and their impact on global economic growth and inflation. Investor interest has risen and the macroeconomic environments in China and the U.S. could be a drag on jewelry consumption. We forecast gold to end 2025 at USD 2,900, with a slight decline to USD 2,800 by end 2026.
Oil: Multiple Influencing Forces
During the first quarter of the year, the oil market has been influenced by a number of developments, including both demand and supply shocks. On the demand side, the start of Donald Trump's second term as President of the U.S., particularly his tariff policies, has sparked uncertainty regarding economic growth prospects both in the U.S. and globally. Similarly, concerns about China’s ability to meet its 5% growth target have weakened the outlook for oil demand growth. This view is reinforced by developments on the supply side. Specifically, the group of countries within OPEC+ that implemented voluntary supply cuts of 2.2 mb/d since November 2023 has decided to proceed with the planned production increases, which are set to begin in April. Additionally, the U.S. has introduced further uncertainty by more rigorously enforcing and expanding sanctions on Iran and Russia, along with Trump’s “drill, baby, drill” policy, which aims to boost oil and gas production in the country.
Indeed, the group of countries within OPEC+ has decided to proceed with its planned production hikes, marking the first OPEC hike since 2022. With the market's reaction to this announcement, we believe there are two key questions to address.
1. Why did OPEC+ decide to increase production at this time?
Our assessment is that this decision is primarily driven by geopolitical pressures and the stricter enforcement of sanctions on Russia and Iran. This hypothesis is supported by the following factors: i) President Trump has publicly urged OPEC, and in particular Saudi Arabia, to increase oil production; ii) The U.S. has intensified sanctions on Iran and Russia, further constraining their oil exports and thereby giving OPEC more room to increase output; iii) Over the past year, OPEC has consistently revised its global oil demand projections downward (Figure 1), suggesting that increasing oil supply in response to strong demand prospects is unlikely; and iv) The IMF estimates the fiscal breakeven oil price for key OPEC members to be above the current level—Saudi Arabia (USD 90.9), Iraq (USD 92.4), and Kuwait (USD 81.8).
2. How likely is it for OPEC+ to pause the production hikes?
In an official statement published in March, OPEC noted that "this gradual increase may be paused or reversed subject to market conditions". Our central scenario assumes that production hikes will proceed as planned. However, we assign a 40% probability to a case in which the group of countries within OPEC+ pauses the hikes, given concerns about oil demand growth—discussed below—and the relatively frequent changes in their policy decisions. If geopolitical considerations were a key driver of the decision to increase production—which we believe they were—pausing the hikes becomes more complex due to potential political repercussions. On the other hand, if the decision was purely driven by expectations of demand and supply dynamics, pausing the hikes would be easier to implement.
Figure 1: OPEC's Revisions to Global Oil Demand Forecasts for 2025 and 2026 (mb/d)
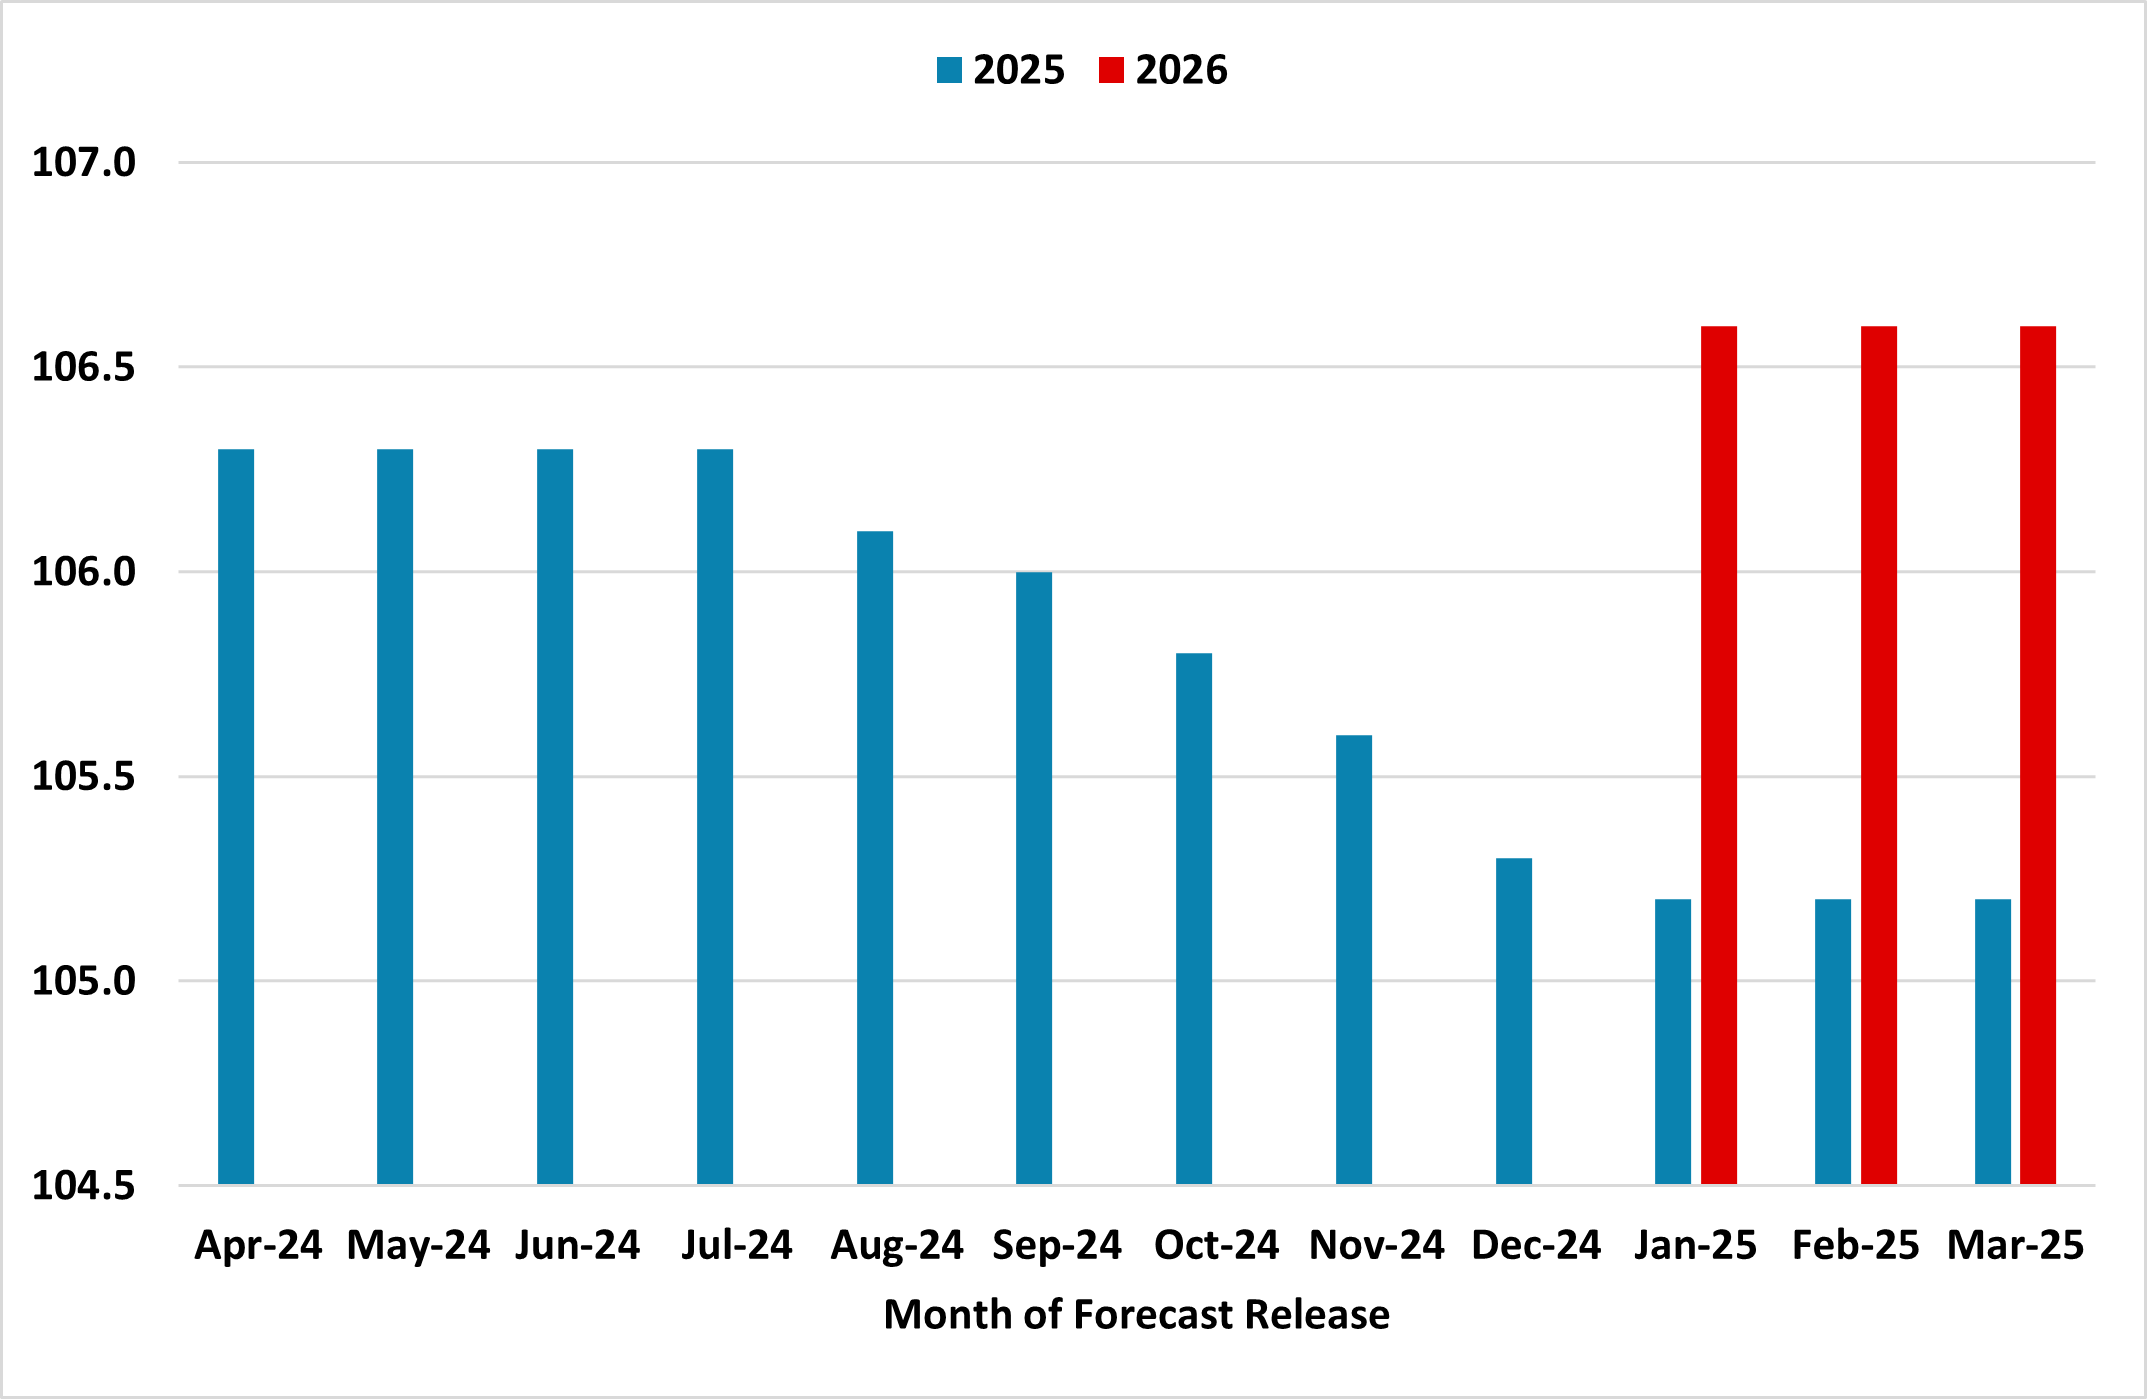
Source: Continuum Economics / OPEC
We expect the U.S. to be one of the leading contributors to supply growth over the next two years. However, we do not anticipate an oil production boom as envisioned by President Trump and his “drill, baby, drill” policy. This assessment is based on two factors. First, oil investors are currently prioritizing shareholder returns over increasing investment. Second, a survey conducted by the Federal Reserve Bank of Dallas (here) highlights that the average breakeven price for profitable drilling ranges from USD 59 to USD 70 per barrel. In addition to its own production, the U.S. remains a dominant player influencing the supply outlook through sanctions. We expect sanctions on Iran and Venezuela to tighten, while a possible peace deal between Russia and Ukraine could lead to a relaxation of restrictions on Russia, as discussed in the EMEA chapter. Brazil, Canada, and Guyana are expected to be key contributors to supply growth.
The global macroeconomic landscape has deteriorated due to President Trump’s trade war, which is expected to impact oil demand growth. As discussed in our U.S. chapter, several factors are anticipated to weigh on demand growth in the U.S., including slower economic growth, only one rate cut in the last quarter of the year, the absence of fiscal stimulus directly benefiting households, the pass-through of trade tariffs to consumers, sluggish real disposable income growth, and weaker employment growth. In this environment, we believe these factors will outweigh the impact of lower oil prices and policies opposing clean energy initiatives.
In China, the demand outlook is not promising. Multiple factors suggest that demand growth could be constrained. As explained in our China chapter, we remain negative on the country’s residential property sector, and associated industries such as cement and steel, which have historically been a key driver of oil demand. Likewise, we do not anticipate a large-scale fiscal stimulus to boost consumption. Additionally, China continues its transition from a manufacturing-based to a services-driven economy (here) and is accelerating its shift toward electric vehicles. Outside the U.S. and China, India persists as a key player in oil demand growth.
The outlook we laid out leads us to forecast WTI at USD 65 by the end of 2025. Our central scenario foresees that 2026 will follow a similar trajectory to 2025. This means we expect OPEC+ production hikes to continue, and production from non-OPEC countries to remain strong. In terms of demand, we anticipate a slightly better U.S. growth by the end of next year, while some deceleration is expected in China by year-end. We continue forecasting WTI at USD 60 by the end of 2026. Regarding the risks associated with our views, supply-side risks include a change in OPEC’s output policy, weaker enforcement of sanctions on Iran and Venezuela, a continuation (or even an acceleration) of sanctions on Russia if a peace deal is not reached in Ukraine. On the demand side, the biggest risk is that the trade war could escalate more than expected, causing a greater impact on demand.
Copper: Tariffs on the Horizon
In our previous assessment of the copper market, we identified several factors as key determinants of the metal’s price over the next two years. We believe these remain valid and will continue to be fundamental in guiding copper prices. From a demand perspective, we foresee economic uncertainty in China, particularly the sluggish residential property sector, continuing to weigh negatively on prices. Similarly, the possibility of President Donald Trump implementing tariffs on copper imports, along with his intentions to deprioritize the energy transition, has already impacted the metal’s price. On the supply side, we remain neutral, expecting a tight market but not large deficits, which could come later in the decade.
Developments in China, the largest global consumer of copper, will continue to play a pivotal role in determining the direction of copper prices. As we highlighted in the China chapter, we still believe that the government has not provided, and is unlikely to provide, sufficient stimulus to drive a significant recovery in the residential property sector—a fundamental driver of copper demand. Beyond this sector, and despite various plans to boost consumer spending, we remain skeptical of their effectiveness and its impact on spending. On the positive side, China continues to see strong electric vehicle consumption. Additionally, the country’s focus on high-tech industries will likely support copper demand, given the needs for data centers, AI, and 5G. A weaker dollar is also positive.
In the U.S., President Trump launched a series of initiatives that have sparked uncertainty in the copper market. The most significant of these is the initiation of a new national security investigation under Section 232 of the Trade Expansion Act of 1962, which could lead to the imposition of a 25% tariff on copper imports. Our central view is that the tariffs will be implemented during the second half of the year. While the short-term impact is an increased demand due to a build-up in inventories in anticipation of the tariffs, we believe that copper consumption would be negatively affected by this policy in the medium to long term, given that the U.S. imports around 45% of its copper consumption (Figure 2).
Overall, the outlook for copper demand in the U.S. is not bright. As discussed in our U.S. chapter, the trade war is expected to weaken the country’s economic growth. We foresee only one Fed rate cut in 2025, which means monetary easing will not be a factor boosting copper prices. Fiscal stimulus is expected to have limited impact on consumer spending, and President Trump’s policies slowing the energy transition will also weigh on copper demand growth.
Figure 2: U.S. Net Import Reliance as a Percentage of Apparent Consumption*
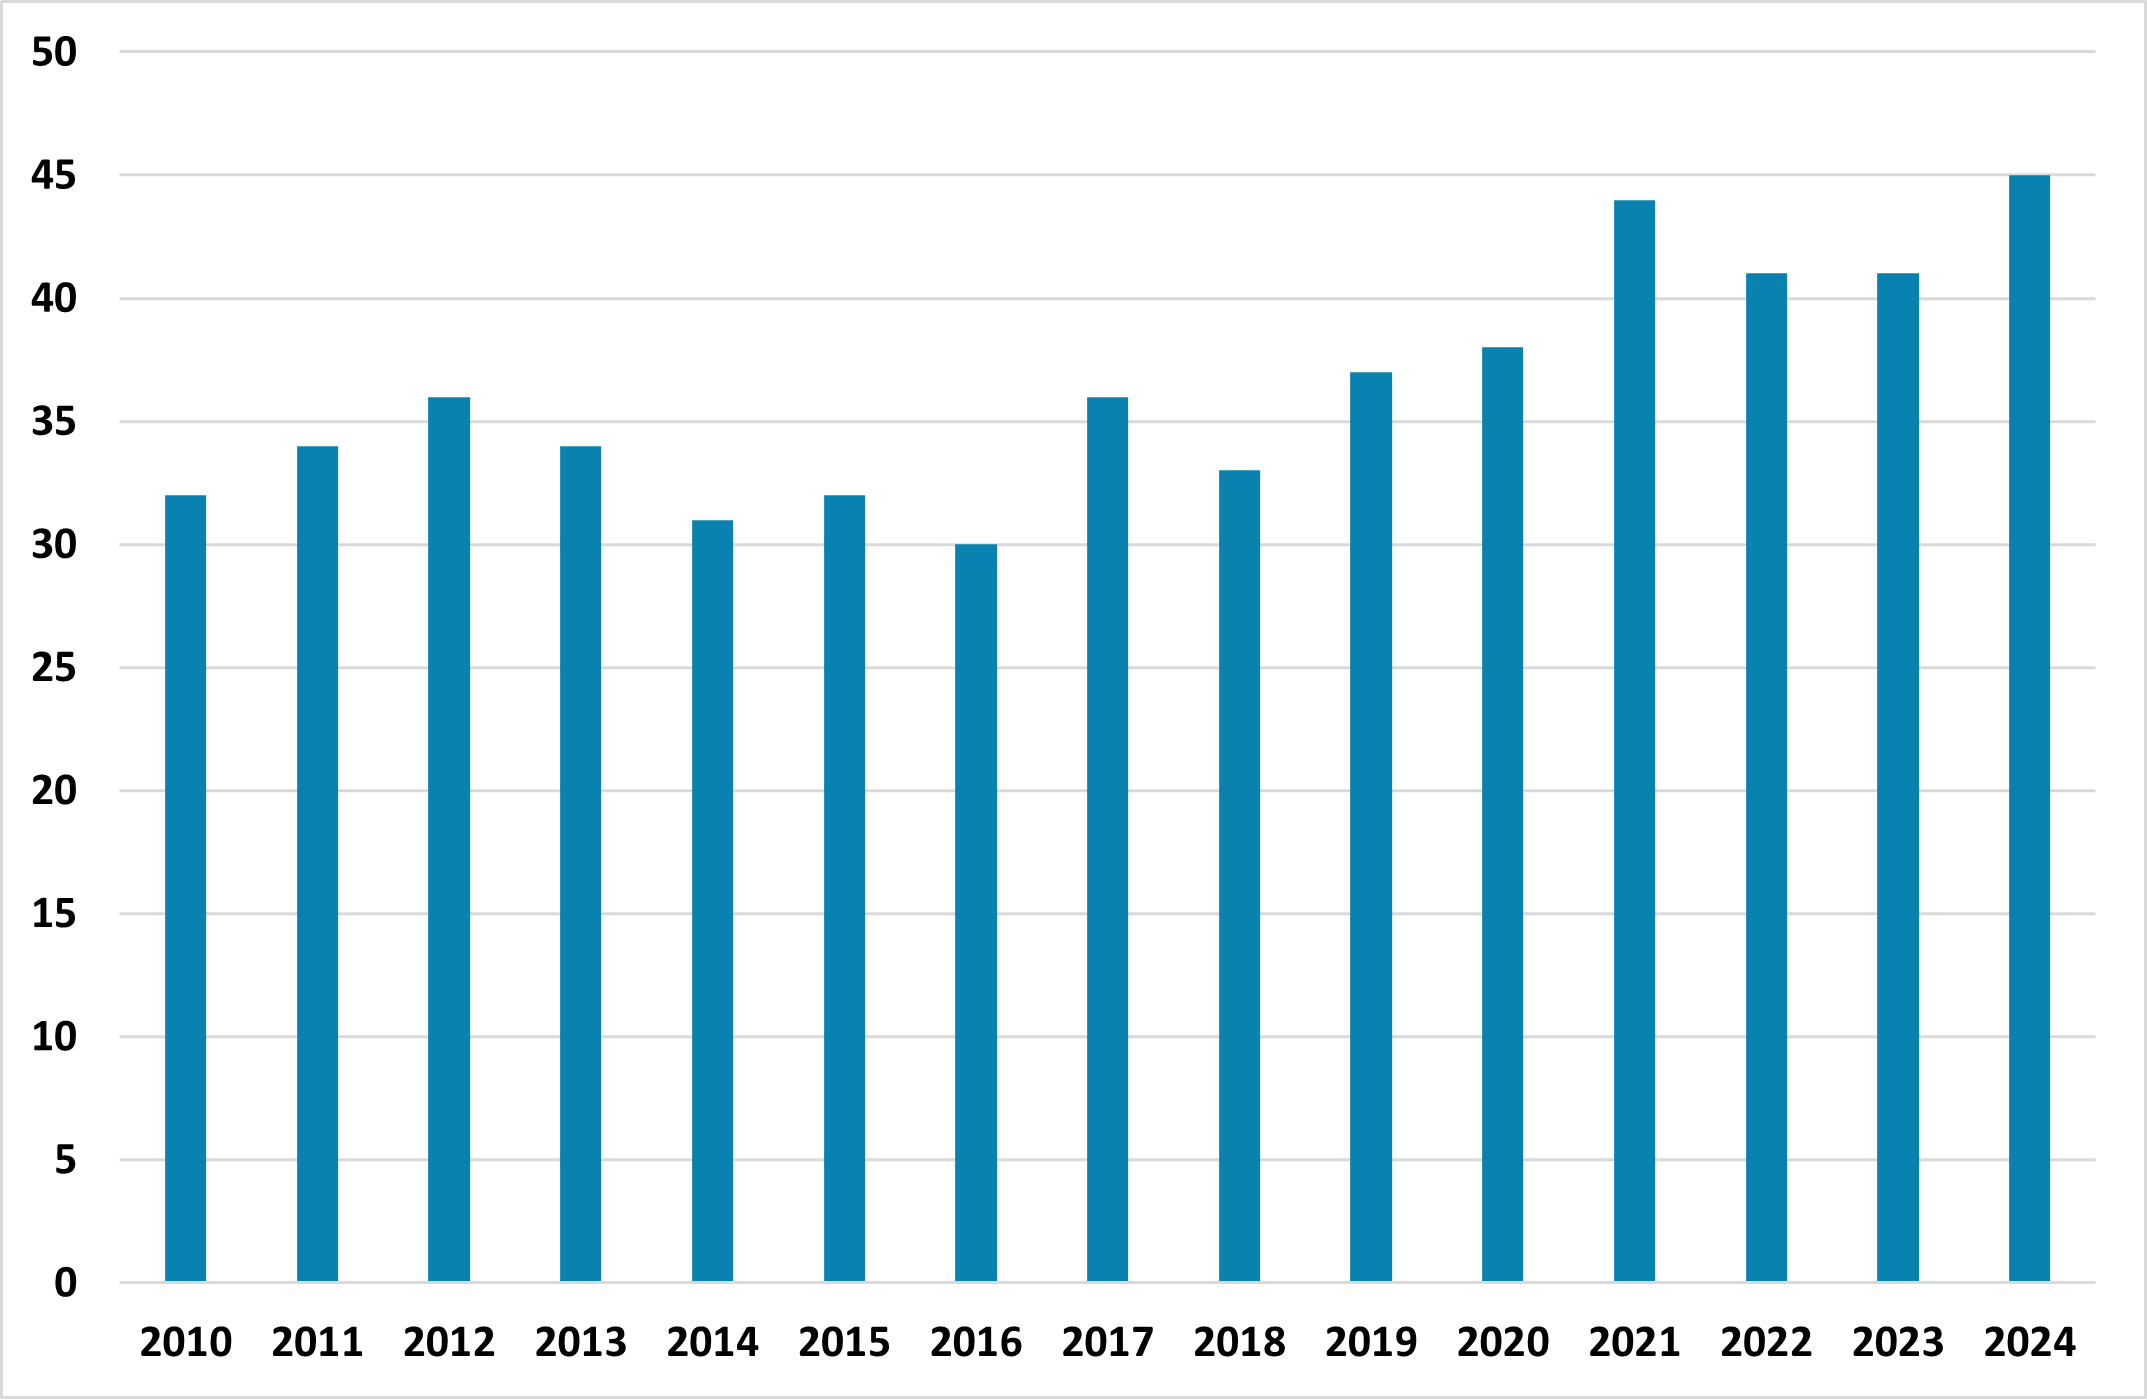
Source: Continuum Economics / United States Geological Survey
* Defined as refined imports – refined exports ± adjustments for refined copper stock changes
The surge in new copper demand streams has fueled concerns about potential deficits in the metal’s market, especially when considering underinvestment in new mines and the long lead times required for mines to start operating. While we expect a tight global copper market, we do not foresee significant shortages in 2025. This outlook is based on the demand scenario we outlined, as well as our expectation that supply will grow moderately. The Chilean Copper Commission anticipates a 6% increase in the country’s copper production in 2025, with its global output share rising from 23.6% in 2024 to 27.3% by 2034. In the Democratic Republic of Congo, the second-largest copper producer, mines such as Kamoa-Kakula, Tenke Fungurume, and Kinsafu are expected to continue contributing to supply over the next two years. In Peru, the world’s third-largest copper producer, output is expected to remain flat or grow only modestly this year.
We forecast copper to finish at USD 9,500 by the end of 2025. Looking ahead to 2026, we expect moderate, rather than exceptional, growth in China, coupled with a weak U.S. economy and the continued implementation of tariffs, which are likely to weigh on demand. On the upside, a weaker dollar, further Fed easing, the continuation of trends in the electric vehicle and high-tech sectors, and a tighter market are expected to provide support to the metal. By the end of 2026, we forecast copper at USD 9,800. Risks associated with our forecast include a different tariff policy than expected, weaker demand due to a stronger trade war, and supply disruptions that could bring forward the expected market tightness.
Gold: Shining More than Ever
Gold reached an all-time high during the first quarter of the year, surpassing the USD 3,000 per ton mark. The rally's beginning can be attributed to central bank demand. Indeed, when Russia invaded Ukraine in 2022, Russian assets denominated in USD were frozen as a sanction. This marked a pivotal moment when several banks, led by the People’s Bank of China, either began adding gold to their reserves or accelerated their accumulation. Since then, central bank demand has remained a key factor supporting gold prices. Furthermore, during Q1 2025, gold found additional support in economic uncertainty stemming from President Trump’s tariff policies and their effects on global economic growth and inflation.
We believe central banks will remain a leading force driving gold demand. Data from the World Gold Council (WGC) shows that central bank demand in 2024 reached 1,044 tons, well above the 2010s decade average of 497.4 tons. However, it lagged behind the figures for 2023 and 2022 by 35.4 tons and 6.2 tons, respectively. The WGC data also positions Poland, Turkiye, India, Azerbaijan, and China as the largest net buyers of gold in 2024. Looking ahead, we foresee central bank demand continuing, though at a potentially slower pace, as these entities seek an inflation hedge amid the ongoing trade war, which has renewed inflation concerns. Additionally, gold's performance during times of crisis and central banks’ continued efforts to mitigate geopolitical risks through sanctions by diversifying their reserves will provide support.
Investors have also turned their attention to gold. Historically, high yields have been correlated with low gold prices, but this relationship broke down after 2022, when central banks began their buying spree. A stronger dollar, which makes gold relatively more expensive, has not prevented gold prices from rising. Looking ahead, and as we highlighted in our U.S. chapter, we expect the Fed to cut rates once this year, with 10-year Treasury yields falling to 4.05% by the end of 2025 and to 4.00% by the end of 2026. Helpful on the margin, but U.S. real yields remain higher than the last decade. Data from the WGC shows that global physically-backed gold exchange-traded funds (ETFs) have seen a consistent inflow since December 2024, with the strongest inflows in February 2025 since March 2022. Our outlook on the Fed’s policy rate and the trend in ETFs inflows are tailwinds for gold.
From a consumer perspective, our expectation of a weaker USD is positive for the price of gold. However, higher prices could weigh down jewelry demand. On the other hand, the economic outlook in China is not positive. In India, the strong macroeconomic momentum continues, which should also be positive for gold.
We have revised our forecast upwards and now expect gold to end 2025 at USD 2,900, before retracting to USD 2,800 by the end of 2026. We envision lower prices in 2026 as central bank demand continues to grow, but at a more moderate pace—possibly influenced by strategic pauses due to high prices. We also expect geopolitical tensions, including trade tariffs and the Russia-Ukraine conflict, to have eased by then. Deviations from these expectations could prevent gold from retracting and instead lead to a continuation of the rally. Another risk involves a potential divergence in the Fed’s policy rate and U.S. yields. A hard landing could mean much more accommodative monetary policy resulting in lower U.S. yields, making gold more attractive.