Country Insights: Labor Productivity and Growth in China
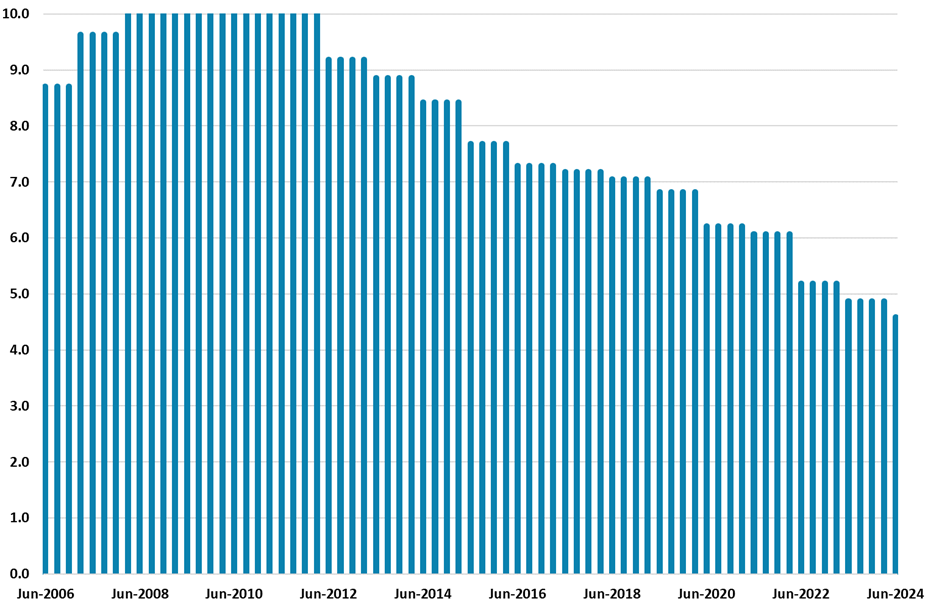
The most recent update of our Country Insights model ranks China as the seventh strongest performer in our labor productivity growth sub-factor. However, the country's score has shown a clear downward trend after the GFC.
The labor productivity growth sub-factor measures the extent to which labor contributes to GDP. It uses the average growth of GDP per person employed over the past five years to assign a score to each of the 174 countries covered by the model through our algorithm. This sub-factor is then used to calculate our Country Strength Index, which is the overall country strength score reflecting the country's macroeconomic, growth potential, political and social strength.
In the latest release of our Country Insights model (here), China obtained a score of 4.6 in the labor productivity sub-factor, ranking as the seventh strongest performer in this category, behind countries such as Guyana and Vietnam. While China is well ranked, there is a clear downward trend in its score following the Global Financial Crisis (GFC) (Figure 1), which we have highlighted (here) as a headwind to the country’s long-term growth prospects.
We remain concerned that productivity will not accelerate to offset population aging. Combined with the multi-year overhang from the residential property sector, we still forecast China growth slowing to 3.0% by 2027.
Figure 1. China Labor Productivity Growth Scores
Source: Continuum Economics
Note: 10 represents the maximum (and best) score and 0 represents the minimum (and worse) score.
China averaged an annual GDP growth rate of 10% from 1980 to 2007. This achievement was driven by several key factors, including the economic reforms initiated in 1978 that shifted the country towards a more market-oriented economy, China’s accession to the World Trade Organization in 2001, and the demographic dividend that provided a large and young workforce. Additionally, productivity improvements within sectors, along with the reallocation of resources from agriculture to industry and services and from state-owned enterprises (SOEs) to private firms, also played significant roles in enhancing productivity and thus in sustaining this high growth. Other factors also contributed to this period of rapid economic expansion.
After the GFC, however, China shifted from an export-based economy to an investment-driven model due to a sharp drop in external demand. More recently, it has been working towards transitioning to a high tech production economy, with less emphasis on residential investment. Following the 2008 crisis, China’s government launched a massive stimulus package heavily focused on infrastructure investment and while this approach helped the country maintain above-average growth rates during the 2010s, it brought several challenges. First, it led to a surge in China’s debt levels; for instance, total credit to the non-financial sector as a percentage of GDP increased from 138% in 2008 to 283% in 2023. Second, a significant portion of this debt was channeled through SOEs, which often results in a misallocation of resources to a sector that is generally less productive than private firms. Third, and perhaps most critically, this investment-heavy model is unsustainable in the long term, as highlighted by the recent lack of current and potential significant stimulus, which we discuss further (here).
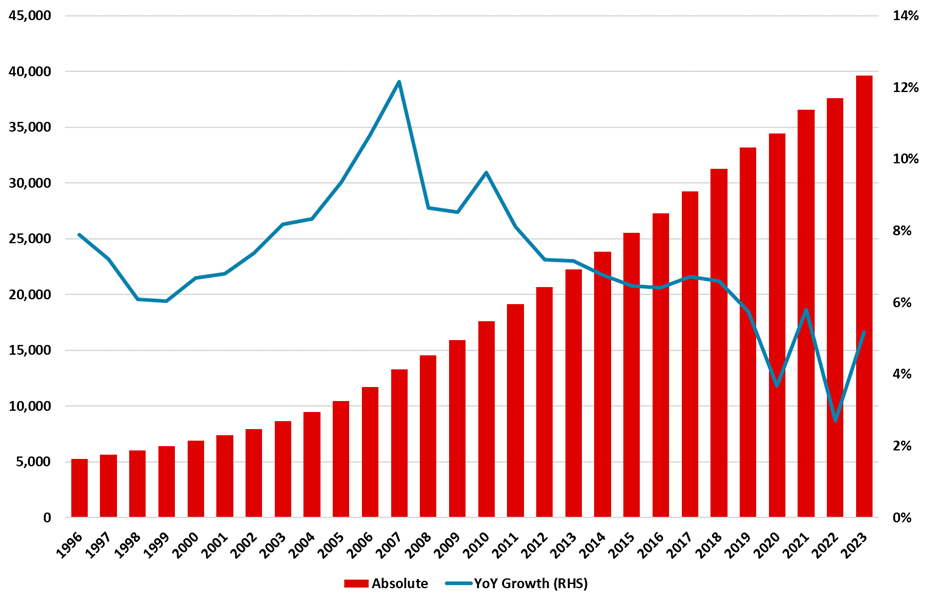
These hurdles have helped towards the stagnation of labor productivity growth. Figure 2 clearly displays a downward trend in output per worker since the GFC, which is highly impacted by investment; for instance, Brandt et al. (2022) (here) argue that since the crisis, physical capital accumulation accounted for nearly 80% of the growth in output per worker.
Figure 2. China GDP, PPP (Constant 2021 International USD) per Worker
Source: Continuum Economics, IMF, ILO
In a similar vein, if we look at additional factors that contribute to the country’s productivity and long-term growth, these include: (i) the reallocation of resources from the industrial sector to the less productive services sector and (ii) the diminishing demographic advantages that had previously fueled growth. We explore these and other determinants in greater depth (here).
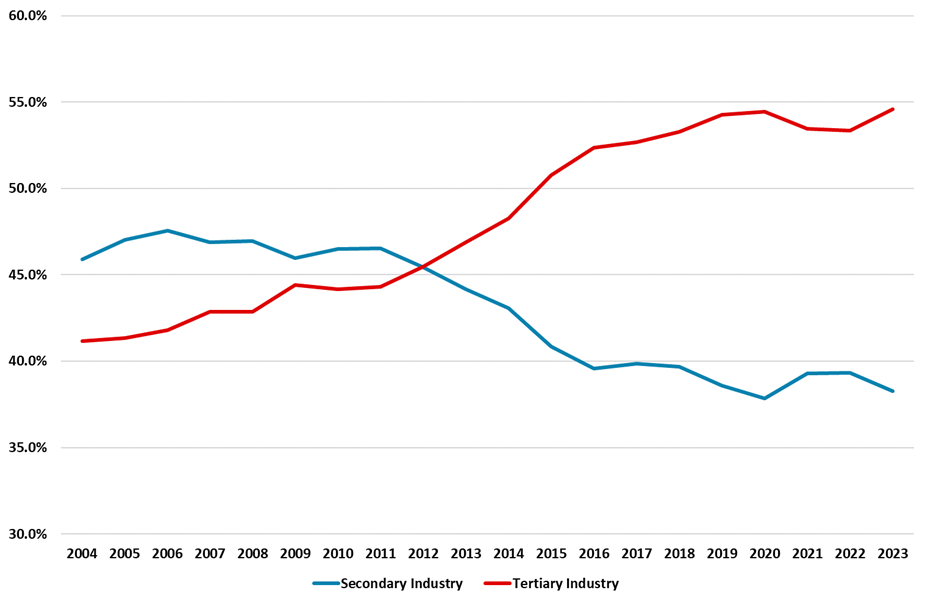
Reallocation of resources. Early in the 2010s, China entered a phase of deindustrialization, characterized by a shift of labor from the industrial sector to the service sector. This shift became more evident in 2012, when the tertiary industry began to contribute more to GDP than the secondary industry (Figure 3). This phenomenon has also been accompanied by a reduced shift of labor from the agricultural sector to the industrial sector. This change in economic structure is significant for labor productivity. For instance, the IMF estimates (here) that productivity in the industrial sector is 1.3 times higher than in the services sector, reflecting the services sector's lack of exposure to international competition and higher trade barriers compared to the industrial sector. Furthermore, the IMF's report also estimates that while the country’s industrial productivity convergence has been rapid—increasing from 15% of the optimal productivity by the late 1990s to 35% in the late 2010s—the services sector's productivity convergence has been slower, increasing from 10% to 26% over the same period.
Figure 3. Contribution of Secondary and Tertiary Industries to GDP in China
Source: Continuum Economics, National Bureau of Statistics
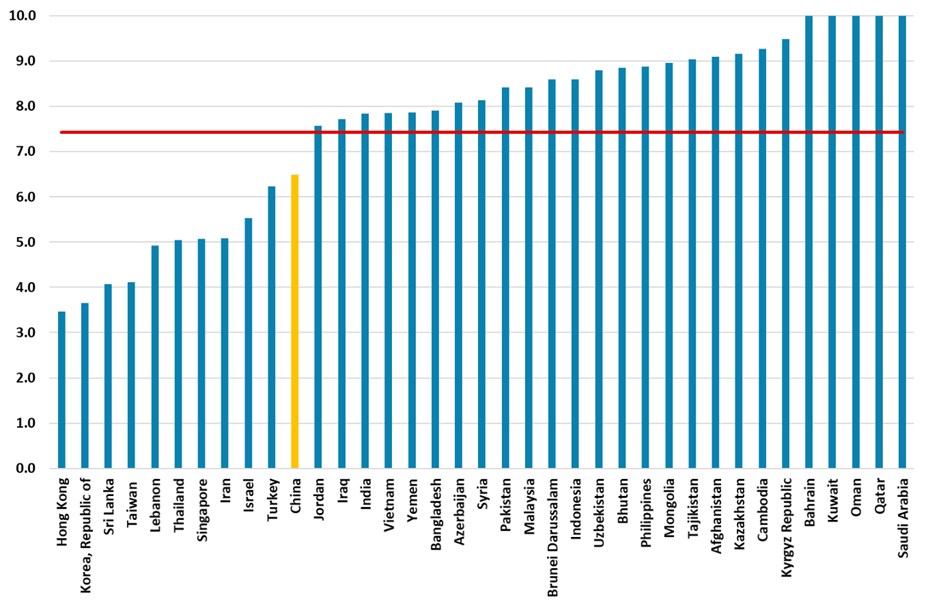
Demographic changes. Figure 4 makes use of our Old Population to Employment sub-factor to benchmark the burden of supporting retirees by taking the ratio of population aged 65 and over to employment for China and other selected Asian countries. The graph, and in particular the relatively low score for China, reflects that the country has experienced declining birth rates and aging population. This phenomenon is multifactorial, stemming from structural policies like the One Child Policy (1979-2015), socioeconomic changes such as industrialization and urbanization, and economic conditions including high youth unemployment and high childcare and education costs. In this context, the latest data from United Nations expects that by 2050, China’s population would have decreased by around 11%; similarly, Bloomberg estimates that in the next three decades the country’s labor force would shrink by 30%. We have argued that, given the lack of policies to address these issues, this will lead to a drag on consumption, thereby hurting growth.
Figure 4. 2024-Q2 Old Population to Employment Scores in Selected Asian Countries
Source: Continuum Economics
Note: 10 represents the maximum (and best) score and 0 represents the minimum (and worse) score.
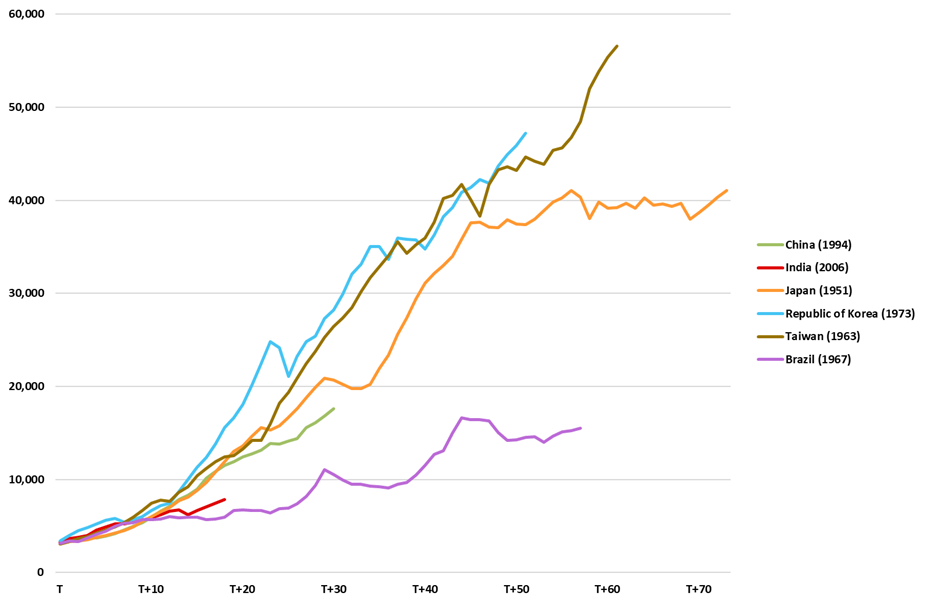
Looking forward. The path of China’s productivity, growth model, and economic structure matters when we look at the country’s income evolution (Figure 5) and try to visualize its progress. The question then becomes if China can avoid falling into the middle-income trap – that is, the scenario in which the country reaches a middle level of income but does not develop enough to reach a high income. While there is some consensus at stating that, the country is early on its path to convergence (with productivity and income per capita far from those at advanced economies), there is no consensus that the country will be able to achieve the success of, for example, the East Asian tigers.
Additional challenges. Demographic changes, the shift from an industry to services-driven model, high debt levels, and a less friendly attitude towards private business are some of the obstacles highlighted above for the country to achieve income levels such as those by Japan, Taiwan, South Korea, and others. However, some other hurdles are worth taking into account when visualizing China’s growth prospects, including:
Shifting supply chains. Indeed, we have argued that the global economy is shifting away from a globalization era towards resilience via shifting some parts of the supply chains to friendly countries– a process that was intensified by the global pandemic/Ukraine war. China is set to continue to be hurt from trade barriers (tariffs and sanctions) and changes in supply chains (nearshoring and friendshoring) which would limit technology transfers. This would be particularly relevant if Donald Trump were elected president in the November 2024 elections.
Institutional hurdles. With the country still far away from the optimal productivity, policies promoting innovation and making steady progress in addressing institutional and resource allocation issues are required; however, these policies appear unlikely to be easily implemented. Moreover, China authorities want to control the process of favored production sectors, which slows innovation. As the services sector grows in importance, facilitating doing business in the high-end and more productive side of this sector becomes fundamental – the country still has plenty of space to this as highlighted by the OECD’s Service Trade Restrictiveness Index (here).
Figure 5: GDP per Capita, Output-Side Real GDP, PPP (2017 USD)
Source: Continuum Economics, PWT 10.01, IMF
Notes: Year T is defined as the year when the GDP per Capita of each economy surpassed USD 3,000. Figures through 2019 are from Penn World Table 10.0; figures from 2020-2023 are calculated using estimates from the IMF.