EZ HICP Review: Services Inflation Less Resilient as Core Hits Cycle-Low
Having been range bound for some 5-6 months between 2.0% and 2.2% until November but after a fall to 1.9% in December headline HICP inflation dropped to 1.7% in the flash January data, thereby matching expectations and the short-lived Sep 24 outcome. The drop came in spite of higher food inflation, instead being pared back by energy, where base effects were at work, but with services down 0.2 ppt to match the September low of 3.2%. In turn, this allowed the core rate to fall a notch to 2.2%, the lowest in over five years and hinting at a clear undershoot of the ECB’s Q1 2026 projection. We see this as the continuation of what may be a short-lived fall toward 1.5% for the headline rate in the current quarter, but where the core rate easing may prove more durable. To what extent the fall in this latest data at least partly reflects a softness in non-energy industrial goods (NEIG) inflation. The latter may possibly reflect an increasing sign of softer import prices possibly related to Chinese export dumping and/or the stronger euro, either being an issue for the ECB.
Figure 1: Headline and Services Down Clearly
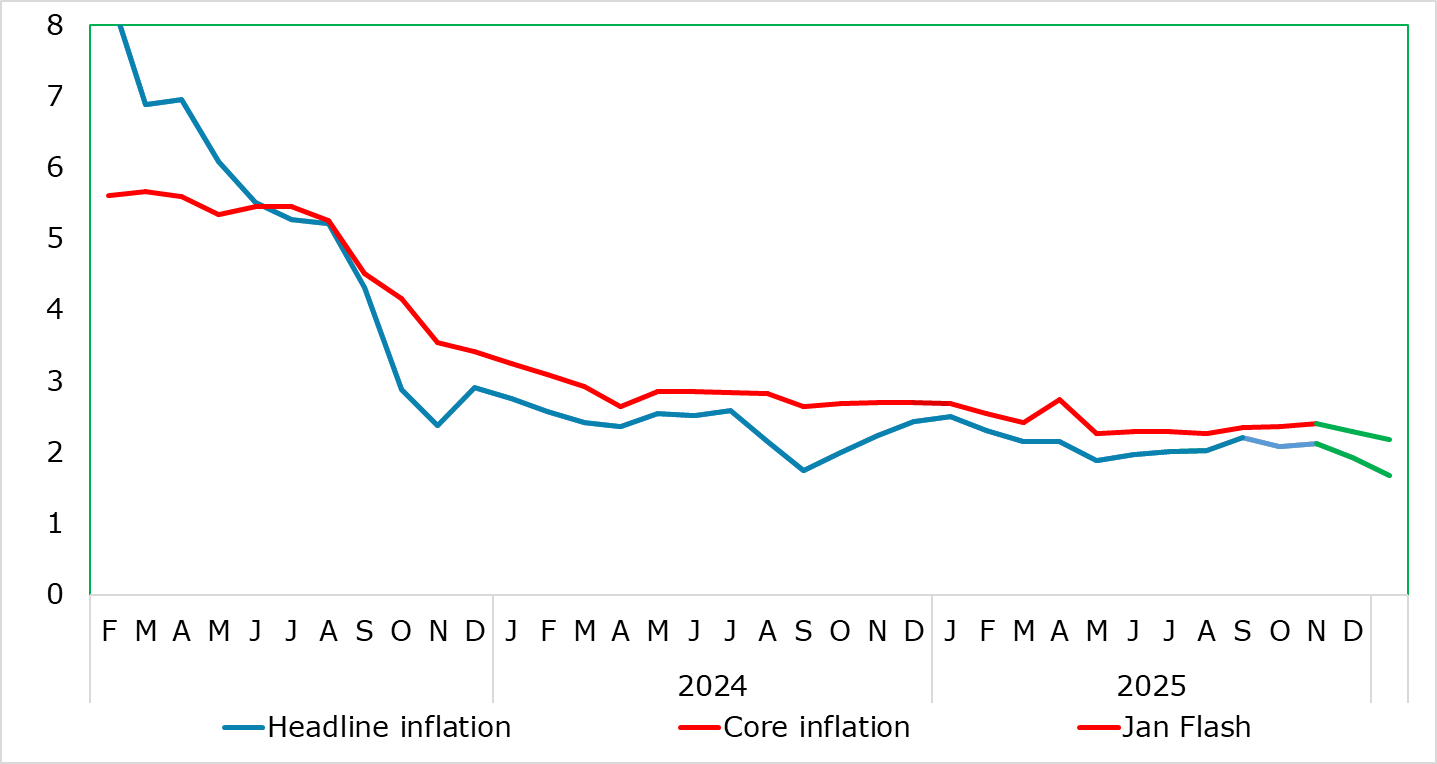
Source: Eurostat, CE
As of these latest numbers, several methodological changes take effect in the HICP. Over and beyond the usual annual reweighting of the components, the index will also now be compiled according to the new classification. Games of chance will be included in the HICP under the division of recreation, sport and culture. The index reference period will also be updated to 2025=100. What is clear is that with (relatively resilience) services having seen an increase in its weighting in the last three years this has acted to push up recorded overall inflation but the reverse may now be occurring. To what extent this reweighting may be behind the fall in January services inflation is unclear at this juncture. Regardless, it may just as much reflect weak demand paring back the ability of companies to raise prices, particularly those typically made at the start of each year!
Regardless, the diehard hawks at the ECB will have focused on the recent rise in services inflation to a seven month high of 3.4%, a shift higher far less echoed by less favourable, but still target-consistent, adjusted m/m data. Even so, this seems to have reverberated within the ECB and seemingly prompted the upward revisions made in December to the 2026 HICP outlook. Even so, the fresh fall back to 3.2% (seemingly very much transport price driven) will not placate the hawks, even if more short-run price dynamics very much back up the picture of disinflation even within services. However, the hawks will have to come to terms with other component of core inflation, namely non-energy industrial goods (Figure 2).
Figure 2: NEIG and Services Adjusted Inflation Both Looking Friendlier
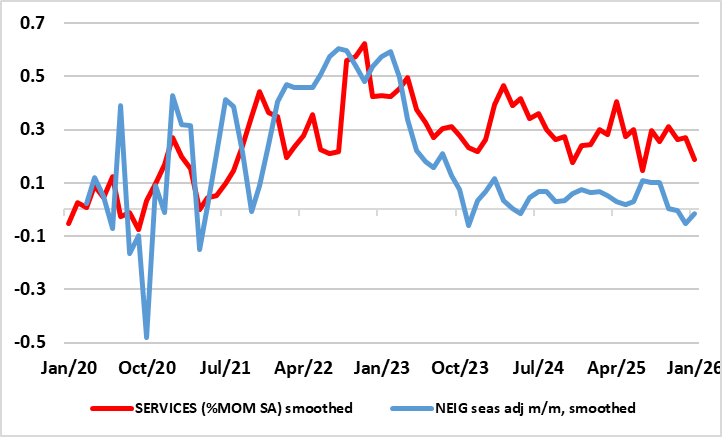
Source: Eurostat, CE,
Both services and NEIG have allowed the overall core rate to hit a five and half year low of 2.2% and where a drop to 2.0% in coming months seems likely, something the ECB do not envisage occurring until 2027. Moreover, using both seasonally adjusted m/m figures and the ECB’s preferred 3-mth annualised rate, we suggest that the core rate is now below 2% on this basis for the first time in well over two years (Figure 3).
Even so, with non-energy industrial goods inflation little changed from its 15-mth low of 0.4% in December, this may increasingly be seen as increasing evidence of softer import prices and with sigsn if more softness in NEIG to come (Figure 4). Very possibly this may be related to Chinese export dumping – ie such evidence is echoed by the clear fall in overall import price numbers of late, although the stronger euro may also be a very important contributory factor. From the ECB Council’s perspective either factor is important, not least as both stem from U.S trade policies and the uncertainties and swings they have triggered both in terms of the near record high in the trade-weighted euro and/or dumping by China if goods it no longer is able to sell to the U.S.
Figure 3: Core Rate Below Target?
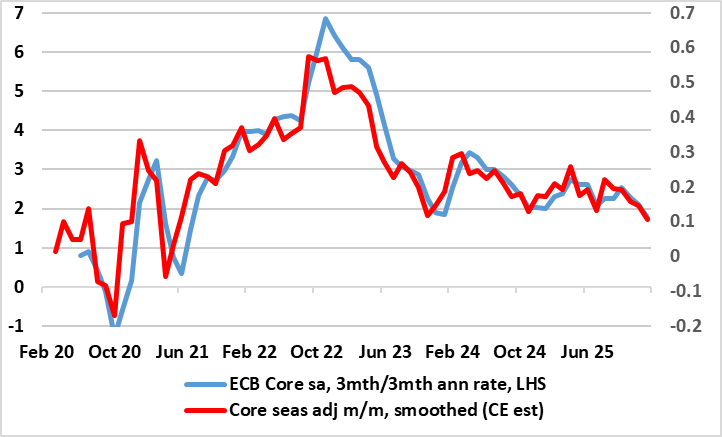
Source: Eurostat, CE
All of which intensifies the question as to whether what may be more than a cyclical fall in core goods inflation will offset any further (but not expected) resilience in services, should the latter not succumb to lower wage pressures as we think will be the case. Instead, and as hinted above, core inflation may now be seeing a two-pronged downward push, something already evident in m/m adjusted core and services data (Figure 2).
Figure 4: NEIG Inflation To Fall Further as Import Prices Drop
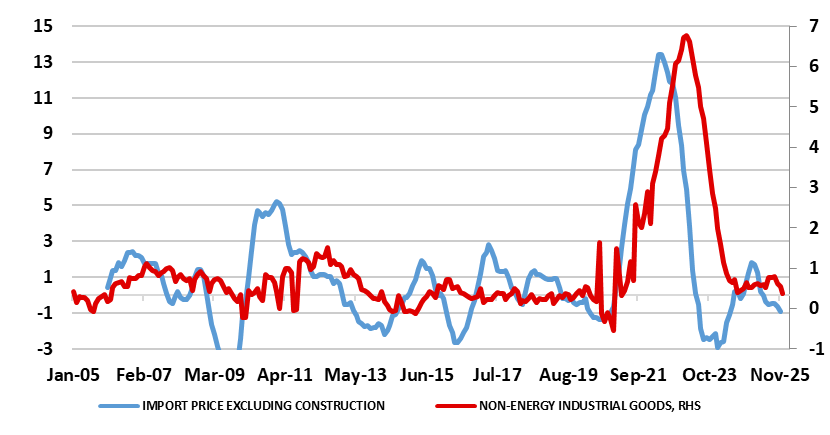
Source: Eurostat, CE, % chg y/y